

Highly accurate prophage island detection with PIDE
- PMID: 40836306
- PMCID: PMC12366036
- DOI: 10.1186/s13059-025-03733-0
Highly accurate prophage island detection with PIDE
Abstract
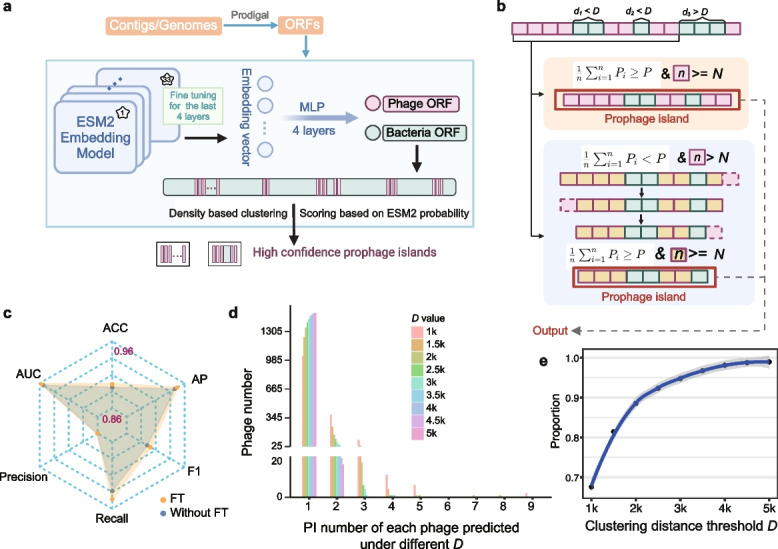
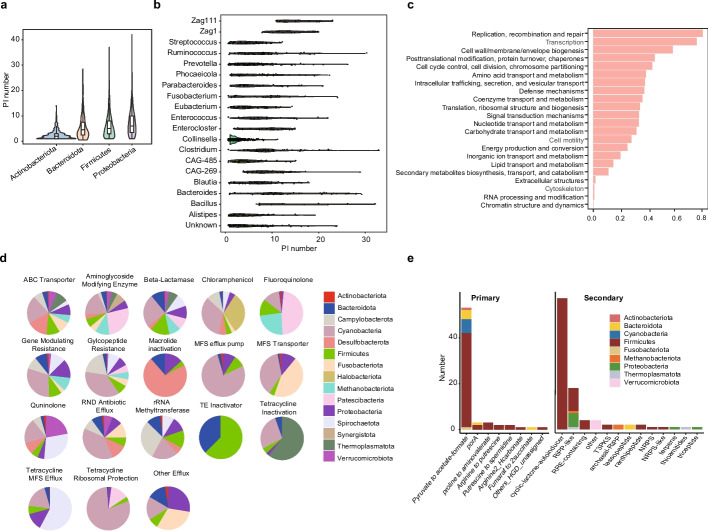
As important mobile elements in prokaryotes, prophages shape the genomic context of their hosts and regulate the structure of bacterial populations. However, it is challenging to precisely identify prophages through computational methods. Here, we introduce PIDE for identifying prophages from bacterial genomes or metagenome-assembled genomes. PIDE integrates a pre-trained protein language model and gene density clustering algorithm to distinguish prophages. Benchmarking with induced prophage sequencing datasets demonstrates that PIDE pinpoints prophages with precise boundaries. Applying PIDE to 4744 human gut representative genomes reveals 24,467 prophages with widespread functional capacity. PIDE is available at https://github.com/chyghy/PIDE , with model training code at https://zenodo.org/records/16457629 .
Keywords: Gene cluster; Human gut metagenome; Prophage identification; Protein language model.
© 2025. The Author(s).
Conflict of interest statement
Declarations. Ethics approval and consent to participate: Not applicable. Consent for publication: Not applicable. Competing interests: The authors declare no competing interests.
Figures


Similar articles
-
Prophages are infrequently associated with antibiotic resistance in Pseudomonas aeruginosa clinical isolates.mSphere. 2025 Mar 25;10(3):e0090424. doi: 10.1128/msphere.00904-24. Epub 2025 Feb 13. mSphere. 2025. PMID: 39945525 Free PMC article.
-
Characterization of integrated prophages within diverse species of clinical nontuberculous mycobacteria.Virol J. 2020 Aug 17;17(1):124. doi: 10.1186/s12985-020-01394-y. Virol J. 2020. PMID: 32807206 Free PMC article.
-
Directed evolution of bacteriophages: thwarted by prolific prophage.Appl Environ Microbiol. 2024 Nov 20;90(11):e0088424. doi: 10.1128/aem.00884-24. Epub 2024 Oct 30. Appl Environ Microbiol. 2024. PMID: 39475284 Free PMC article.
-
Perceptions and experiences of the prevention, detection, and management of postpartum haemorrhage: a qualitative evidence synthesis.Cochrane Database Syst Rev. 2023 Nov 27;11(11):CD013795. doi: 10.1002/14651858.CD013795.pub2. Cochrane Database Syst Rev. 2023. PMID: 38009552 Free PMC article.
-
Algorithm-based pain management for people with dementia in nursing homes.Cochrane Database Syst Rev. 2022 Apr 1;4(4):CD013339. doi: 10.1002/14651858.CD013339.pub2. Cochrane Database Syst Rev. 2022. PMID: 35363380 Free PMC article.
References
-
- Liang G, Zhao C, Zhang H, Mattei L, Sherrill-Mix S, Bittinger K, et al. The stepwise assembly of the neonatal virome is modulated by breastfeeding. Nat. 2020;581(7809):470–4. http://www.nature.com/articles/s41586-020-2192-1 - PMC - PubMed
MeSH terms
LinkOut - more resources
Full Text Sources
Research Materials
