

SPOCK1 promotes the progression of breast cancer by modulating cancer-associated fibroblasts and exerts a synergistic effect with ANXA2
- PMID: 40837013
- PMCID: PMC12361150
- DOI: 10.3389/fonc.2025.1619171
SPOCK1 promotes the progression of breast cancer by modulating cancer-associated fibroblasts and exerts a synergistic effect with ANXA2
Abstract
Background: SPOCK1, a matricellular glycoprotein, has been implicated in tumor progression, metastasis, and the tumor immune microenvironment, yet its specific roles in breast cancer (BRCA) remain unclear. This study aimed to systematically explore the expression pattern, prognostic significance, mutation landscape, immune association, and spatial localization of SPOCK1 in breast cancer through integrated multi-omics analyses.
Methods: Transcriptomic, genomic, and clinical data from The Cancer Genome Atlas (TCGA) and Gene Expression Omnibus (GEO) were utilized. Bulk RNA sequencing and single-cell RNA sequencing (scRNA-seq) analyses were conducted, including functional enrichment, immune infiltration assessments, mutation profiling, and transcription factor activity analysis. Multiplex immunohistochemistry (mIHC) was performed to validate the spatial distribution of SPOCK1+ cancer-associated fibroblasts (CAFs) within the tumor microenvironment. Statistical analyses were performed using R and GraphPad Prism.
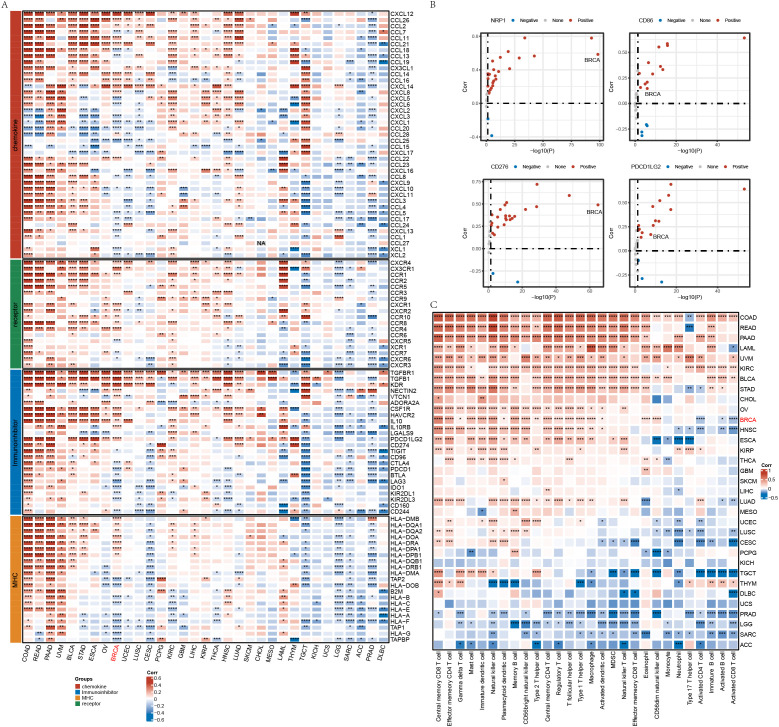
Results: SPOCK1 was broadly overexpressed in multiple cancer types and significantly associated with poor prognosis in BRCA. High SPOCK1 expression correlated with immune checkpoint activation, enhanced immune infiltration, and enriched metastasis-related pathways such as epithelial-mesenchymal transition (EMT) and TGF-β signaling. Single-cell analysis identified CAFs as the primary cell population expressing SPOCK1, with spatial mIHC confirming their close proximity to tumor cells. Furthermore, SPOCK1-high CAFs exhibited stronger intercellular communications with malignant cells via collagen, fibronectin, and IGFBP signaling pathways, alongside distinct transcription factor and metabolic profiles. In breast cancer CAF cell lines with knockdown of ANXA2 we found that the expression of both SPOCK1 and IGF1 was reduced.
Conclusion: SPOCK1 serves as a critical regulator of breast cancer progression, influencing tumor metastasis and reshaping the immune microenvironment via CAF-mediated mechanisms. These findings suggest that targeting SPOCK1+ CAFs could offer new therapeutic opportunities for breast cancer treatment.
Keywords: AnxA2; SPOCK1; breast cancer; cancer-associated fibroblasts; tumor microenvironment.
Copyright © 2025 Jie, Fei and Fan.
Conflict of interest statement
The authors declare that they have no known competing financial interests or personal relationships that could have appeared to influence the work reported in this paper.
Figures


Similar articles
-
Integrated single-cell and transcriptomic analysis of bone marrow-derived metastatic neuroblastoma reveals molecular mechanisms of metabolic reprogramming.Sci Rep. 2025 Aug 5;15(1):28519. doi: 10.1038/s41598-025-13626-8. Sci Rep. 2025. PMID: 40764361 Free PMC article.
-
Deciphering the tumor immune microenvironment: single-cell and spatial transcriptomic insights into cervical cancer fibroblasts.J Exp Clin Cancer Res. 2025 Jul 5;44(1):194. doi: 10.1186/s13046-025-03432-5. J Exp Clin Cancer Res. 2025. PMID: 40616092 Free PMC article.
-
Senescent fibroblasts secrete CTHRC1 to promote cancer stemness in hepatocellular carcinoma.Cell Commun Signal. 2025 Aug 25;23(1):379. doi: 10.1186/s12964-025-02369-8. Cell Commun Signal. 2025. PMID: 40855439 Free PMC article.
-
Systemic treatments for metastatic cutaneous melanoma.Cochrane Database Syst Rev. 2018 Feb 6;2(2):CD011123. doi: 10.1002/14651858.CD011123.pub2. Cochrane Database Syst Rev. 2018. PMID: 29405038 Free PMC article.
-
Cost-effectiveness of using prognostic information to select women with breast cancer for adjuvant systemic therapy.Health Technol Assess. 2006 Sep;10(34):iii-iv, ix-xi, 1-204. doi: 10.3310/hta10340. Health Technol Assess. 2006. PMID: 16959170
References
LinkOut - more resources
Full Text Sources
Miscellaneous