. 2025 Jun 1;5(8):2500061.
doi: 10.1002/smsc.202500061. eCollection 2025 Aug.

A Rapid Assessment Approach for Skin Stratum-Targeted Drug Delivery Systems Using Mass Spectrometry Imaging and Spatial Clustering

Affiliations

A Rapid Assessment Approach for Skin Stratum-Targeted Drug Delivery Systems Using Mass Spectrometry Imaging and Spatial Clustering

Ravit Yakobi Arancibia et al. Small Sci. .

Abstract

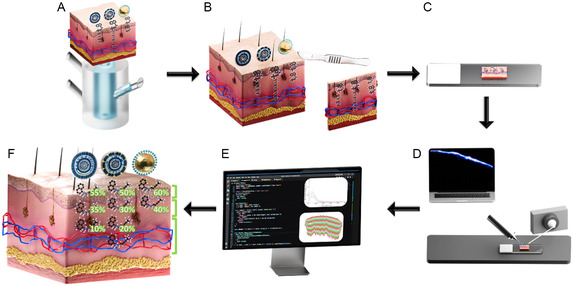
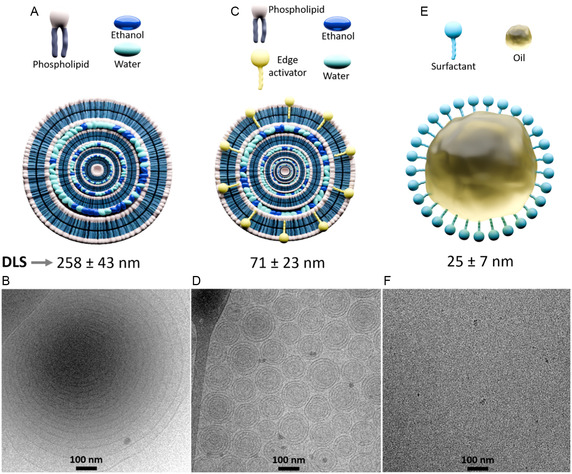
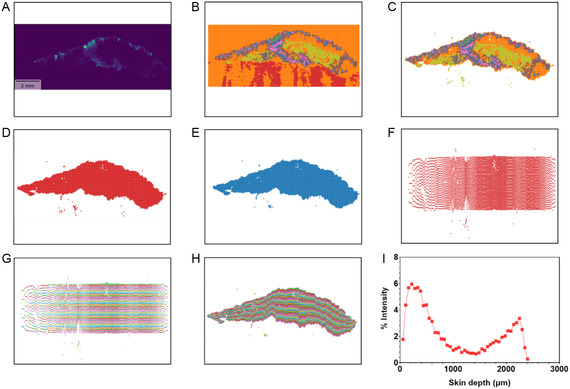
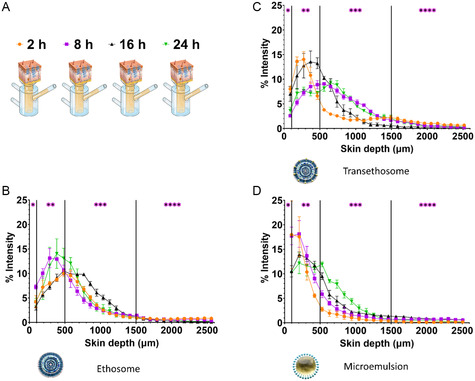
A novel mass spectrometry imaging (MSI)-based concept that enables rapid visualization and evaluation of active pharmaceutical ingredient (API) distribution across skin layers following dermal delivery is presented. This approach integrates desorption electrospray ionization MSI with a newly developed automated computational tool (access provided) that efficiently processes MSI data, isolates skin tissue signals from background interference, and segments the tissue into precise layers. The tool facilitates detailed and rapid assessment of API localization within skin strata in under 10 min per skin specimen. To validate this method, three nanoscale dermal drug delivery systems (DDSs) for the antifungal terbinafine that target distinct skin strata-ethosomes, transethosomes, and microemulsion-are designed and characterized. API permeation in human and porcine skin is evaluated using both manual and automated workflows. The integrated approach demonstrates superior accuracy in skin distribution analysis, a substantial reduction in processing time, and improved efficiency in signal-tissue overlay. Comparative analysis of the DDSs reveals marked differences in drug permeation depth and localization, with transethosomes showing the highest potential for deeper dermal delivery. This method not only provides a powerful tool for DDS evaluation but also enables detailed kinetic studies, offering insights into drug permeation dynamics.

Keywords: dermal delivery; desorption electrospray ionization mass spectrometry imaging; ethosomes; microemulsion; skin layers; terbinafine; transethosomes.


Conflict of interest statement

The authors declare no conflict of interest.

Figures

Figure 1
Figure 1
Rapid and direct method for visualizing and comparatively quantifying API distribution across different skin depths. A) Excised skin square is mounted on Franz diffusion cell for DDS application. B). Treated skin square is sectioned vertically in a cryostat. C) Skin section is mounted on the glass slide. D) Skin section is scanned with DESI‐MSI. E) Data are processed manually or automatically. F) API distribution across skin layers visualized and quantified.
Figure 2
Figure 2
Illustrations and characterization of the three DDSs containing TBF: A) Schematic illustration of the ethosomal DDS. B) Cryo‐TEM image of the ethosomal DDS. C) Schematic illustration of the transethosomal DDS. D) Cryo‐TEM image of the transethosomal DDS. E) Schematic illustration of the microemulsion DDS. F) Cryo‐TEM image of the microemulsion DDS. The average particle size of each DDS, measured by DLS, is displayed below the corresponding illustration. Additional DLS data and cryo‐TEM images can be found in S1, and S2 respectively, Supporting Information.
Figure 3
Figure 3
A) Experimental workflow: DDSs containing both FITC and TBF were applied to porcine ear skin squares equilibrated on Franz cells. The treated skin squares were mounted between two glass slides, and fluorescence signals were recorded in Z‐stack mode using CLSM. Each layer along the Z‐axis is represented by an image, and fluorescence intensity is plotted against skin depth. B–D) Fluorescence images in Z‐stack mode for (B) ethosomal DDS, (C) transethosomal DDS, and (D) microemulsion DDS. E) Comparison of fluorescence intensity signals of FITC delivered by the three DDSs versus skin depth.
Figure 4
Figure 4
A) Experimental workflow for the manual calculation of TBF in porcine ear skin layers using HDI software. This includes image overlay and ROI annotations for each layer. B) Process description for the ethosomal system. C) DESI‐MSI distribution image of TBF (m/z 292.207, [M + H]+) with a pixel resolution of 50 μm. D) Histological image of a vertically sectioned, H&E‐stained porcine ear skin sample, with the SC located at the bottom. E) Overlay of the DESI‐MSI distribution image (C) and the histological image (D) with 60% transparency applied to the DESI‐MSI image, created using HDI software. F–N) Nine consecutive manually defined ROI layers, each with a thickness of one pixel (50 μm). The SC direction is indicated in the images. A graph represents the average normalized intensity of TBF in each ROI layer after normalization by sum (as detailed in S7, Supporting Information), with colors corresponding to the respective ROI layers. The same methodology was applied to the other DDSs. O) Results for the transethosomal system. P) Overlay of DESI‐MSI and histological images for the transethosomal system. Q) ROI annotations created for the transethosomal system. Scale bar: 1 mm. R) Results for the microemulsion system. S) Overlay of DESI‐MSI and histological images for the microemulsion system. T) ROI annotations created for the microemulsion system. Scale bar: 1 mm. U) Comparative graph summarizing TBF permeation into porcine ear skin for the three DDSs. Skin strata are indicated as: epidermis (*), upper dermis (**), and lower dermis (***). The hypodermis was not present in the porcine ear skin samples.
Figure 4
Figure 4
A) Experimental workflow for the manual calculation of TBF in porcine ear skin layers using HDI software. This includes image overlay and ROI annotations for each layer. B) Process description for the ethosomal system. C) DESI‐MSI distribution image of TBF (m/z 292.207, [M + H]+) with a pixel resolution of 50 μm. D) Histological image of a vertically sectioned, H&E‐stained porcine ear skin sample, with the SC located at the bottom. E) Overlay of the DESI‐MSI distribution image (C) and the histological image (D) with 60% transparency applied to the DESI‐MSI image, created using HDI software. F–N) Nine consecutive manually defined ROI layers, each with a thickness of one pixel (50 μm). The SC direction is indicated in the images. A graph represents the average normalized intensity of TBF in each ROI layer after normalization by sum (as detailed in S7, Supporting Information), with colors corresponding to the respective ROI layers. The same methodology was applied to the other DDSs. O) Results for the transethosomal system. P) Overlay of DESI‐MSI and histological images for the transethosomal system. Q) ROI annotations created for the transethosomal system. Scale bar: 1 mm. R) Results for the microemulsion system. S) Overlay of DESI‐MSI and histological images for the microemulsion system. T) ROI annotations created for the microemulsion system. Scale bar: 1 mm. U) Comparative graph summarizing TBF permeation into porcine ear skin for the three DDSs. Skin strata are indicated as: epidermis (*), upper dermis (**), and lower dermis (***). The hypodermis was not present in the porcine ear skin samples.
Figure 5
Figure 5
Identification of the choline peak to improve overlay accuracy between histological images and DESI‐MSI TBF distribution images for the manual ROI layers method. A–C) Distribution images of choline (m/z 104.107, [M]+) overlaid with histological images of skin: (A) porcine ear skin, (B) porcine abdominal skin, and (C) human abdominal skin. D–F) Distribution images of TBF (m/z 292.207, [M + H]+) overlaid with histological images of skin: (D) porcine ear skin, (E) porcine abdominal skin, and (F) human abdominal skin. G–I) Combined overlay of TBF (m/z 292.207, green) and choline (m/z 104.107, red) distribution images with histological images of skin: (G) porcine ear skin, (H) porcine abdominal skin, and (I) human abdominal skin. The scale bar for porcine ear and porcine abdominal skin images is 2 mm, while the scale bar for human abdominal skin images is 3 mm. All images shown are of the ethosomal DDS series as an example. The SC direction is indicated in all images.
Figure 6
Figure 6
Comparison of TBF skin permeation across three different DDSs and three different skin sources, calculated manually using HDI software. A) Flow chart of the experimental process. B–D) Graphical representation of TBF permeation to skin, using three DDSs: (B) porcine ear skin, (C) porcine abdominal skin, and (D) human abdominal skin. E–G) Skin sections manually divided into artificial layers using the ROI tool in HDI software, with each layer having a thickness of 50 μm: (E) porcine ear skin (scale bar: 2 mm), (F) porcine abdominal skin (scale bar: 1 mm), and (G) human abdominal skin (scale bar: 3 mm). Histological images of the skin sections are shown beneath each corresponding ROI image. All images shown are of the ethosomal DDS series as an example (additional details in S9, Supporting Information). Tissue layer images are oriented with the SC at the top; *epidermis, **upper dermis, and ***lower dermis.
Figure 7
Figure 7
Automated method for calculation of TBF permeation facilitated by the ethosomal DDS in porcine ear skin layers. A) m/z 292.207 distribution image (for data quality evaluation). Scale bar: 2 mm. B) KMeans clustering based on MS data, with k = 15. C) Selected clusters representing tissue. D) Full tissue visualization after cluster selection. E) Final tissue image after cropping outliers. F) Straightened tissue prepared for division into XY layers. G) Tissue divided into 50 XY layers, each ≈1 pixel thick (50 μm). H) Reprojection of each layer onto the original tissue shape. I) Final graph showing the average intensity of TBF (m/z 292.207) in each XY layer, normalized by sum. All images are oriented with the SC at the top.
Figure 8
Figure 8
Comparison of TBF skin permeation across three DDSs and three skin sources using the automated tool. A) Flow chart of the experimental process. B–D) Normalized average intensity of TBF signal plotted against skin depth for different skin sources: (B) porcine ear skin, (C) porcine abdominal skin, and (D) human abdominal skin. E–G) Skin is stratified into artificial layers using the automatic tool: (E) porcine ear skin, (F) porcine abdominal skin and G) human abdominal skin. TBF distribution images (m/z 292.207) from DESI‐MSI (scale bar: 2 mm) are displayed below each layering image. All images shown are of the ethosomal DDS as an example. All images are oriented with the SC at the top; *epidermis, **upper dermis, ***lower dermis, and ****hypodermis.
Figure 9
Figure 9
A) Illustration of kinetic experiment. Comparison between three DDSs in different time points (2, 8, 16, and 24 h): B) ethosome, C) transethosome, and D) microemulsion; *epidermis, **upper dermis, ***lower dermis, and ****hypodermis.

Similar articles

References

    1. Zaid Alkilani A., McCrudden M. T., Donnelly R. F., Pharmaceutics 2015, 7, 438. - PMC - PubMed
    1. Parsi K., Partsch H., Rabe E., Ramelet A. A., Australas. J. Dermatol. 2011, 52, 159. - PubMed
    1. Godin B., Touitou E., Rubinstein E., Athamna A., Athamna M., J. Antimicrob. Chemother. 2005, 55, 989. - PubMed
    1. Walsh T. J., Dixon D. M., Med. Microbiol. 1996, 75, 1.
    1. In Vitro Permeation Test Studies for Topical Drug Products Submitted in ANDAs Guidance for Industry, U.S. department of Health and Human Services Food and Drug Administration and Center for Drug Evaluation and Research (CDER), 2022, Center for Drug Evaluation and Research, Office of Regulatory Policy.

LinkOut - more resources