

Dietary risk factors and cancer mortality burden from 1990 to 2021: a comparative study of China and global regions with varying sociodemographic development levels based on the Global Burden of Disease database
- PMID: 40837434
- PMCID: PMC12360945
- DOI: 10.3389/fnut.2025.1628792
Dietary risk factors and cancer mortality burden from 1990 to 2021: a comparative study of China and global regions with varying sociodemographic development levels based on the Global Burden of Disease database
Abstract
Objective: To analyze temporal trends of diet-attributable cancer mortality in China (1990-2021), compare patterns between China and regions with varying development levels, and explore gender-specific characteristics to inform targeted prevention strategies.
Study design: Cross-sectional and time-series analyses.
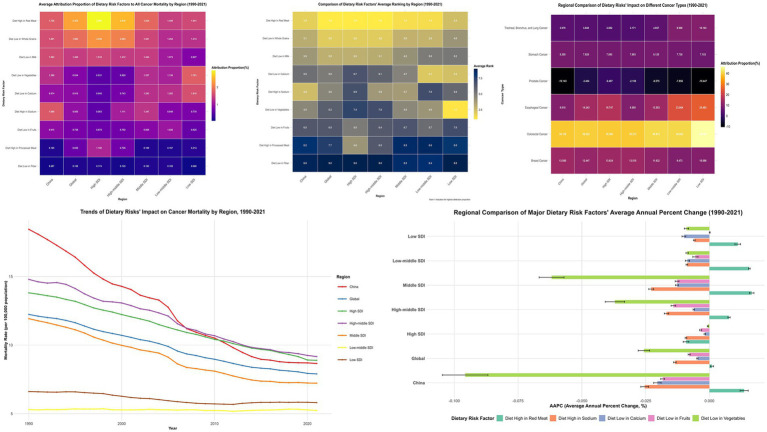
Methods: We conducted cross-sectional and time-series analyses of nine dietary risk factors across China, the global region, and five Socio-demographic Index (SDI) - stratified regions. Joinpoint regression models quantified temporal trends through Annual Percent Change (APC) and Average Annual Percent Change (AAPC).
Results: Diet-attributable cancer deaths in China decreased from 9.9% (95% CI: 2.2-20.5%) to 6.3% (95% CI: 2.1-12.8%) during 1990-2021. China's 2021 attribution (6.3%) was below the global average (6.8%), exceeding high-SDI regions (5.8%) but below middle-SDI regions (7.4%). Low vegetable intake showed the largest decline (3.0 to 0.3%), while high red meat consumption increased (1.6 to 2.0%). Red meat's impact was greater in females, while inadequate plant consumption affected males more significantly. Dietary factors most influenced colorectal cancer in China (39.2%). China's diet-attributable cancer mortality decreased by 53.0% (from 18.4 to 8.7 per 100,000), exceeding global reductions (35.5%).
Conclusion: This study identified distinct regional patterns in diet-attributable cancer mortality. China's profile reflects its transition between development levels-decreasing vegetable-deficiency risks while increasing red meat consumption. Globally, attribution patterns are shifting from plant food inadequacy toward animal product excess, with persistent gender disparities.
Keywords: Global Burden of Disease (GBD); cancer mortality; dietary risk factors; regional comparison; socio-demographic index.
Copyright © 2025 Zhao, Ruan, Xiang, Zhang, Yang and Wang.
Conflict of interest statement
The authors declare that the research was conducted in the absence of any commercial or financial relationships that could be construed as a potential conflict of interest.
Figures


Similar articles
-
Hepatoblastoma regional trends: dynamic SDI & joinpoint regression analysis.BMC Cancer. 2025 Jul 5;25(1):1148. doi: 10.1186/s12885-025-14566-2. BMC Cancer. 2025. PMID: 40618033 Free PMC article.
-
National and subnational burden of brain and central nervous system cancers in China and global from 1990 to 2021: results from the global burden of disease study 2021.Arch Public Health. 2025 Jul 28;83(1):195. doi: 10.1186/s13690-025-01683-4. Arch Public Health. 2025. PMID: 40722045 Free PMC article.
-
Diverging trends in the global burden of ischemic heart disease attributable to non-optimal temperatures: a historical analysis (1990-2021) and 2050 projections.Front Public Health. 2025 Jul 30;13:1593346. doi: 10.3389/fpubh.2025.1593346. eCollection 2025. Front Public Health. 2025. PMID: 40809743 Free PMC article.
-
Analysis and comparison of the trends in burden of low back pain in China and worldwide from 1990 to 2021.J Health Popul Nutr. 2025 Feb 13;44(1):39. doi: 10.1186/s41043-025-00768-8. J Health Popul Nutr. 2025. PMID: 39948668 Free PMC article.
-
Global burden and risk factors of childhood cardiovascular disease (1990-2021).Front Public Health. 2025 Jul 3;13:1543044. doi: 10.3389/fpubh.2025.1543044. eCollection 2025. Front Public Health. 2025. PMID: 40678645 Free PMC article. Review.
References
-
- World Cancer Report . Cancer research for cancer prevention. Lyon (FR): International Agency for Research on Cancer; (2020). - PubMed
-
- Abbasi-Kangevari M, Abd-Allah F, Adekanmbi V, GBD 2019 Risk Factors Collaborators . Global burden of 87 risk factors in 204 countries and territories, 1990–2019: a systematic analysis for the global burden of disease study 2019. Lancet. (2020) 396:1223–49. doi: 10.1016/S0140-6736(20)30752-2 - DOI - PMC - PubMed
LinkOut - more resources
Full Text Sources