. 2025 Aug 5:16:1637209.
doi: 10.3389/fimmu.2025.1637209. eCollection 2025.

Heterogeneity of CD8αα intraepithelial lymphocytes is transcriptionally conserved between TCRαβ and TCRγδ cell lineages

Affiliations

Heterogeneity of CD8αα intraepithelial lymphocytes is transcriptionally conserved between TCRαβ and TCRγδ cell lineages

Kaito A Hioki et al. Front Immunol. .

Abstract

Intestinal intraepithelial lymphocytes (IELs) are a versatile population of immune cells with both effector and regulatory roles in gut immunity. Although this functional diversity is thought to arise from distinct IEL subpopulations, the heterogeneity of TCRαβ+ and TCRγδ+ IELs have not been well characterized. Using scRNAseq, we identified CD8αα+ T cell subsets with memory-like (Tcf7 +) and effector-like (Prdm1 +) profiles in both TCRαβ+ and TCRγδ+ IELs. Using CD160 and CD122 as markers of memory-like and effector-like cells, respectively, we found that while effector-like cells dominated the small intestine, memory-like IELs were more prevalent in the large intestine, suggesting a functional specialization of immune responses along the gut. Further transcriptional analysis revealed shared profiles between TCRαβ+ and TCRγδ+ small intestinal IEL subsets, suggesting conserved functional roles across these populations. Finally, our analysis indicated that TCRαβ+ memory-like IELs arise from Tcf7+ double-negative (DN) precursors, and that effector-like IELs subsequently differentiate from the memory-like population. In contrast, TCRγδ+ IELs appear to originate from two distinct precursor populations, one expressing Tcf7 and the other Zeb2, indicating the presence of parallel developmental pathways within this lineage. Overall, our findings reveal that both TCRαβ+ and TCRγδ+ cells contain memory-like and effector-like subsets, which may contribute to the functional heterogeneity of IELs.

Keywords: BLIMP1/Prdm1; DN IELs; IEL - intraepithelial lymphocyte; TCF1/Tcf7; Vg7; Zeb2 gene; effector; memory.


Conflict of interest statement

The authors declare that the research was conducted in the absence of any commercial or financial relationships that could be construed as a potential conflict of interest. The author(s) declared that they were an editorial board member of Frontiers, at the time of submission. This had no impact on the peer review process and the final decision.

Figures

Figure 1
Figure 1
TCRαβ+ and TCRγδ+ IELs consist of diverse groups of cells. (a, b). UMAP plots of sorted CD45+ TCRαβ+ TCRγδ- IELs (a) or CD45+ TCRαβ- TCRγδ+ IELs (b) after quality control filtering. (c, d). Representative UMAP plots for the expression of Cd3e and coreceptor genes Cd4/Cd8a/Cd8b1 for TCRαβ+ IELs (c) and TCRγδ+ IELs (d). (e, f). Representative UMAP plots for the expression of marker genes descriptive of cluster group phenotypes for TCRαβ+ (e) and TCRγδ+ (f) datasets. (g, h). Annotated UMAP plots of 4,845 TCRαβ+ IELs (g) and 10,418 TCRγδ+ IELs (h).
Figure 2
Figure 2
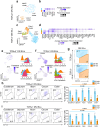
CD8αα+ IEL subsets have distinct transcriptional features and colonization pattern of the intestine. (a) UMAP plot of re-clustered TCRαβ+ CD8αα+ cells. (b) Differentially expressed transcription factors between the (non-Mki67 +) CD8αα+ cluster groups in TCRαβ+ CD8αα+ cells. (c) UMAP plot of re-clustered TCRγδ+ CD8αα+ cells. (d) Differentially expressed transcription factors between the (non-Mki67 +) CD8αα+ cluster groups in TCRγδ+ CD8αα+ cells. (e, f). Expression of differentially expressed surface protein-coding genes represented as UMAP plots and ridge plots for TCRαβ+ CD8αα+ cells (e) and TCRγδ+ CD8αα+ cells (f). (g) Representative flow cytometry plots of CD122 and CD160 expression among TCRαβ+ CD8αα+ cells and TCRγδ+ CD8αα+ cells from the small intestine. (h, i). Representative flow cytometry plots and quantification of CD122 and CD160 expression along five sections of the intestine for TCRαβ+ CD8αα+ cells (h) and TCRγδ+ CD8αα+ cells (i). Data were analyzed by Paired T-test (h, i).
Figure 3
Figure 3
DN IEL subsets have distinct transcriptional features and static colonization pattern of the intestine. (a) UMAP plot of re-clustered TCRαβ+ DN cells. (b) Differentially expressed transcription factors between the (non-Mki67 +) DN cluster groups in TCRαβ+ DN cells. (c) UMAP plot of re-clustered TCRγδ+ DN cells. (d) Differentially expressed transcription factors between the (non-Mki67 +) DN cluster groups in TCRγδ+ DN cells. (e, f). Expression of differentially expressed surface protein-coding genes represented as UMAP plots and ridge plots for TCRαβ+ DN cells (e) and TCRγδ+ DN cells (f). (g) Representative flow cytometry plots of CD122 and CD160 expression among TCRαβ+ DN cells and TCRγδ+ DN cells from the small intestine. (h, i). Representative flow cytometry plots and quantification of CD122 and CD160 expression along five sections of the intestine for TCRαβ+ DN cells (h) and TCRγδ+ DN cells (i). Data were analyzed by one-way ANOVA (h, i).
Figure 4
Figure 4
The transcriptional profiles of TCRαβ+ cells are similar to TCRγδ+ cells. (a) Heatmap of top 10 marker genes for the annotated TCRαβ+ IEL subclusters sorted by statistical significance. (b) Expression of CD8αα+ cluster marker genes in (a) among total TCRγδ+ cells. Signature scores were compared by Mann-Whitney U test. (c) UMAP plot generated after integration of TCRαβ+ and TCRγδ+ datasets with original cluster identities overlaid. (d) Integrated clusters (left) and quantification of cluster composition by individual cluster groups represented as a bar plot (right).
Figure 5
Figure 5
Memory-like and effector-like CD8αα+ IELs may represent separate IEL lineages. (a, b). UMAP plots with the overlay of RNA velocity trajectory predictions among re-clustered TCRαβ+ CD8αα+ and DN cells (a) and re-clustered TCRγδ+ CD8αα+ and DN cells (b). (c) Trajectory models between IEL clusters predicted by RNA velocity analysis.

Update of

Similar articles

References

    1. Chen Y, Chou K, Fuchs E, Havran WL, Boismenu R. Protection of the intestinal mucosa by intraepithelial gamma delta T cells. Proc Natl Acad Sci U.S.A. (2002) 99:14338–43. doi: 10.1073/pnas.212290499, PMID: - DOI - PMC - PubMed
    1. Cheroutre H, Lambolez F, Mucida D. The light and dark sides of intestinal intraepithelial lymphocytes. Nat Rev Immunol. (2011) 11:445–56. doi: 10.1038/nri3007, PMID: - DOI - PMC - PubMed
    1. Han J, Liu N, Jin W, Zanvit P, Zhang D, Xu J, et al. TGF-beta controls development of TCRgammadelta(+)CD8alphaalpha(+) intestinal intraepithelial lymphocytes. Cell Discov. (2023) 9:52. doi: 10.1038/s41421-023-00542-2, PMID: - DOI - PMC - PubMed
    1. Olivares-Villagomez D, Van Kaer L. Intestinal intraepithelial lymphocytes: sentinels of the mucosal barrier. Trends Immunol. (2018) 39:264–75. doi: 10.1016/j.it.2017.11.003, PMID: - DOI - PMC - PubMed
    1. Roberts SJ, Smith AL, West AB, Wen L, Findly RC, Owen MJ, et al. T-cell alpha beta + and gamma delta + deficient mice display abnormal but distinct phenotypes toward a natural, widespread infection of the intestinal epithelium. Proc Natl Acad Sci U.S.A. (1996) 93:11774–9. doi: 10.1073/pnas.93.21.11774, PMID: - DOI - PMC - PubMed

MeSH terms

Substances

LinkOut - more resources