

Advancing amorphous solid dispersions through empirical and hybrid modeling of drug-polymer solubility and miscibility: A case study using Ibuprofen
- PMID: 40838046
- PMCID: PMC12362086
- DOI: 10.1016/j.ijpx.2025.100373
Advancing amorphous solid dispersions through empirical and hybrid modeling of drug-polymer solubility and miscibility: A case study using Ibuprofen
Abstract
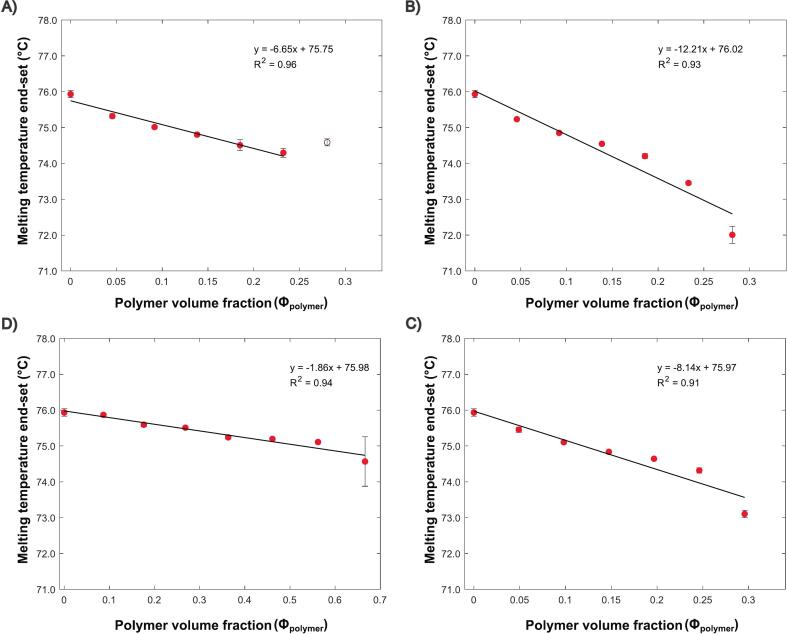
This study investigates the solubility and miscibility of ibuprofen (IBU) with four pharmaceutical polymers, KOLVA64®, KOL17PF®, HPMCAS, and Eudragit® EPO, using a combination of empirical and hybrid modeling approaches, supported by differential scanning calorimetry (DSC) experiments. Traditional group contribution methods based on Hildebrand and Hansen solubility parameters (Fedors, Hoftyzer-van Krevelen, and Just-Breitkreutz) showed variability in solubility predictions but consistently classified all polymer-API blends as miscible (Δδ < 7 MPa½). Bagley plots reinforced these findings, although borderline miscibility was indicated for HPMCAS and EPO depending on the method used. A novel attempt to derive the Flory-Huggins (FH) interaction parameter (χ) from solubility parameters at near-melting temperatures showed poor agreement with experimental data, underscoring the limitations of such extrapolations and the semi-empirical nature of the FH model. Phase diagrams were constructed from DSC-based melting point depression data using three modeling strategies: FH theory, the empirical approach by Kyeremateng (with two fitting methods), and the perturbed-chain statistical associating fluid theory (PC-SAFT) equation of state, both in pure predictions and with fitted binary interaction parameters (kij). The glass transition temperature (Tg) of the mixtures was modeled using the Gordon-Taylor and Kwei equations. All models provided a consistent polymer ranking based on their solubilizing capacity, with KOL17PF as the most compatible and HPMCAS as the least. Demixing zones (liquid-liquid equilibrium - LLE) predicted by FH and PC-SAFT models suggest that for HPMCAS-based ASDs only very low drug loadings (< 5 % w/w) could potentially be stable at room temperature. In contrast, higher drug loadings (> 10 % w/w) fall under a meta-stable zone with the other polymers, making them better candidates for IBU formulation. HPMCAS also exhibited consistently prediction errors across all Tg models, (AARD ∼4.5 %), indicating poorer agreement with experimental data. By integrating empirical and hybrid modeling approaches, this study highlights the strengths and limitations of commonly used solubility prediction methods and advocates for a shift toward a harmonized framework.
Keywords: Amorphous Solid Dispersion (ASD); Glass transition; Melting Point Depression (MPD); Perturbed Chain Statistical Associating Fluid Theory (PC-SAFT); Phase Diagram.
© 2025 The Authors. Published by Elsevier B.V.
Conflict of interest statement
The authors declare no conflict of interest.
Figures


References
-
- Baghel S., Cathcart H., O’Reilly N.J. Polymeric amorphous solid dispersions: a review of amorphization, crystallization, stabilization, solid-state characterization, and aqueous solubilization of biopharmaceutical classification system class II drugs. J. Pharm. Sci. 2016;105(9):2527–2544. doi: 10.1016/j.xphs.2015.10.008. Available at: - DOI - PubMed
LinkOut - more resources
Full Text Sources
Research Materials
Miscellaneous
