. 2025 Sep 3;16(17):3398-3409.
doi: 10.1021/acschemneuro.5c00518. Epub 2025 Aug 21.

Detection of Neuronal Glutamate in Brain Extracellular Space In Vivo Using Microdialysis and Metabolic Labeling with Glutamine

Affiliations

Detection of Neuronal Glutamate in Brain Extracellular Space In Vivo Using Microdialysis and Metabolic Labeling with Glutamine

Neil D Hershey et al. ACS Chem Neurosci. .

Abstract

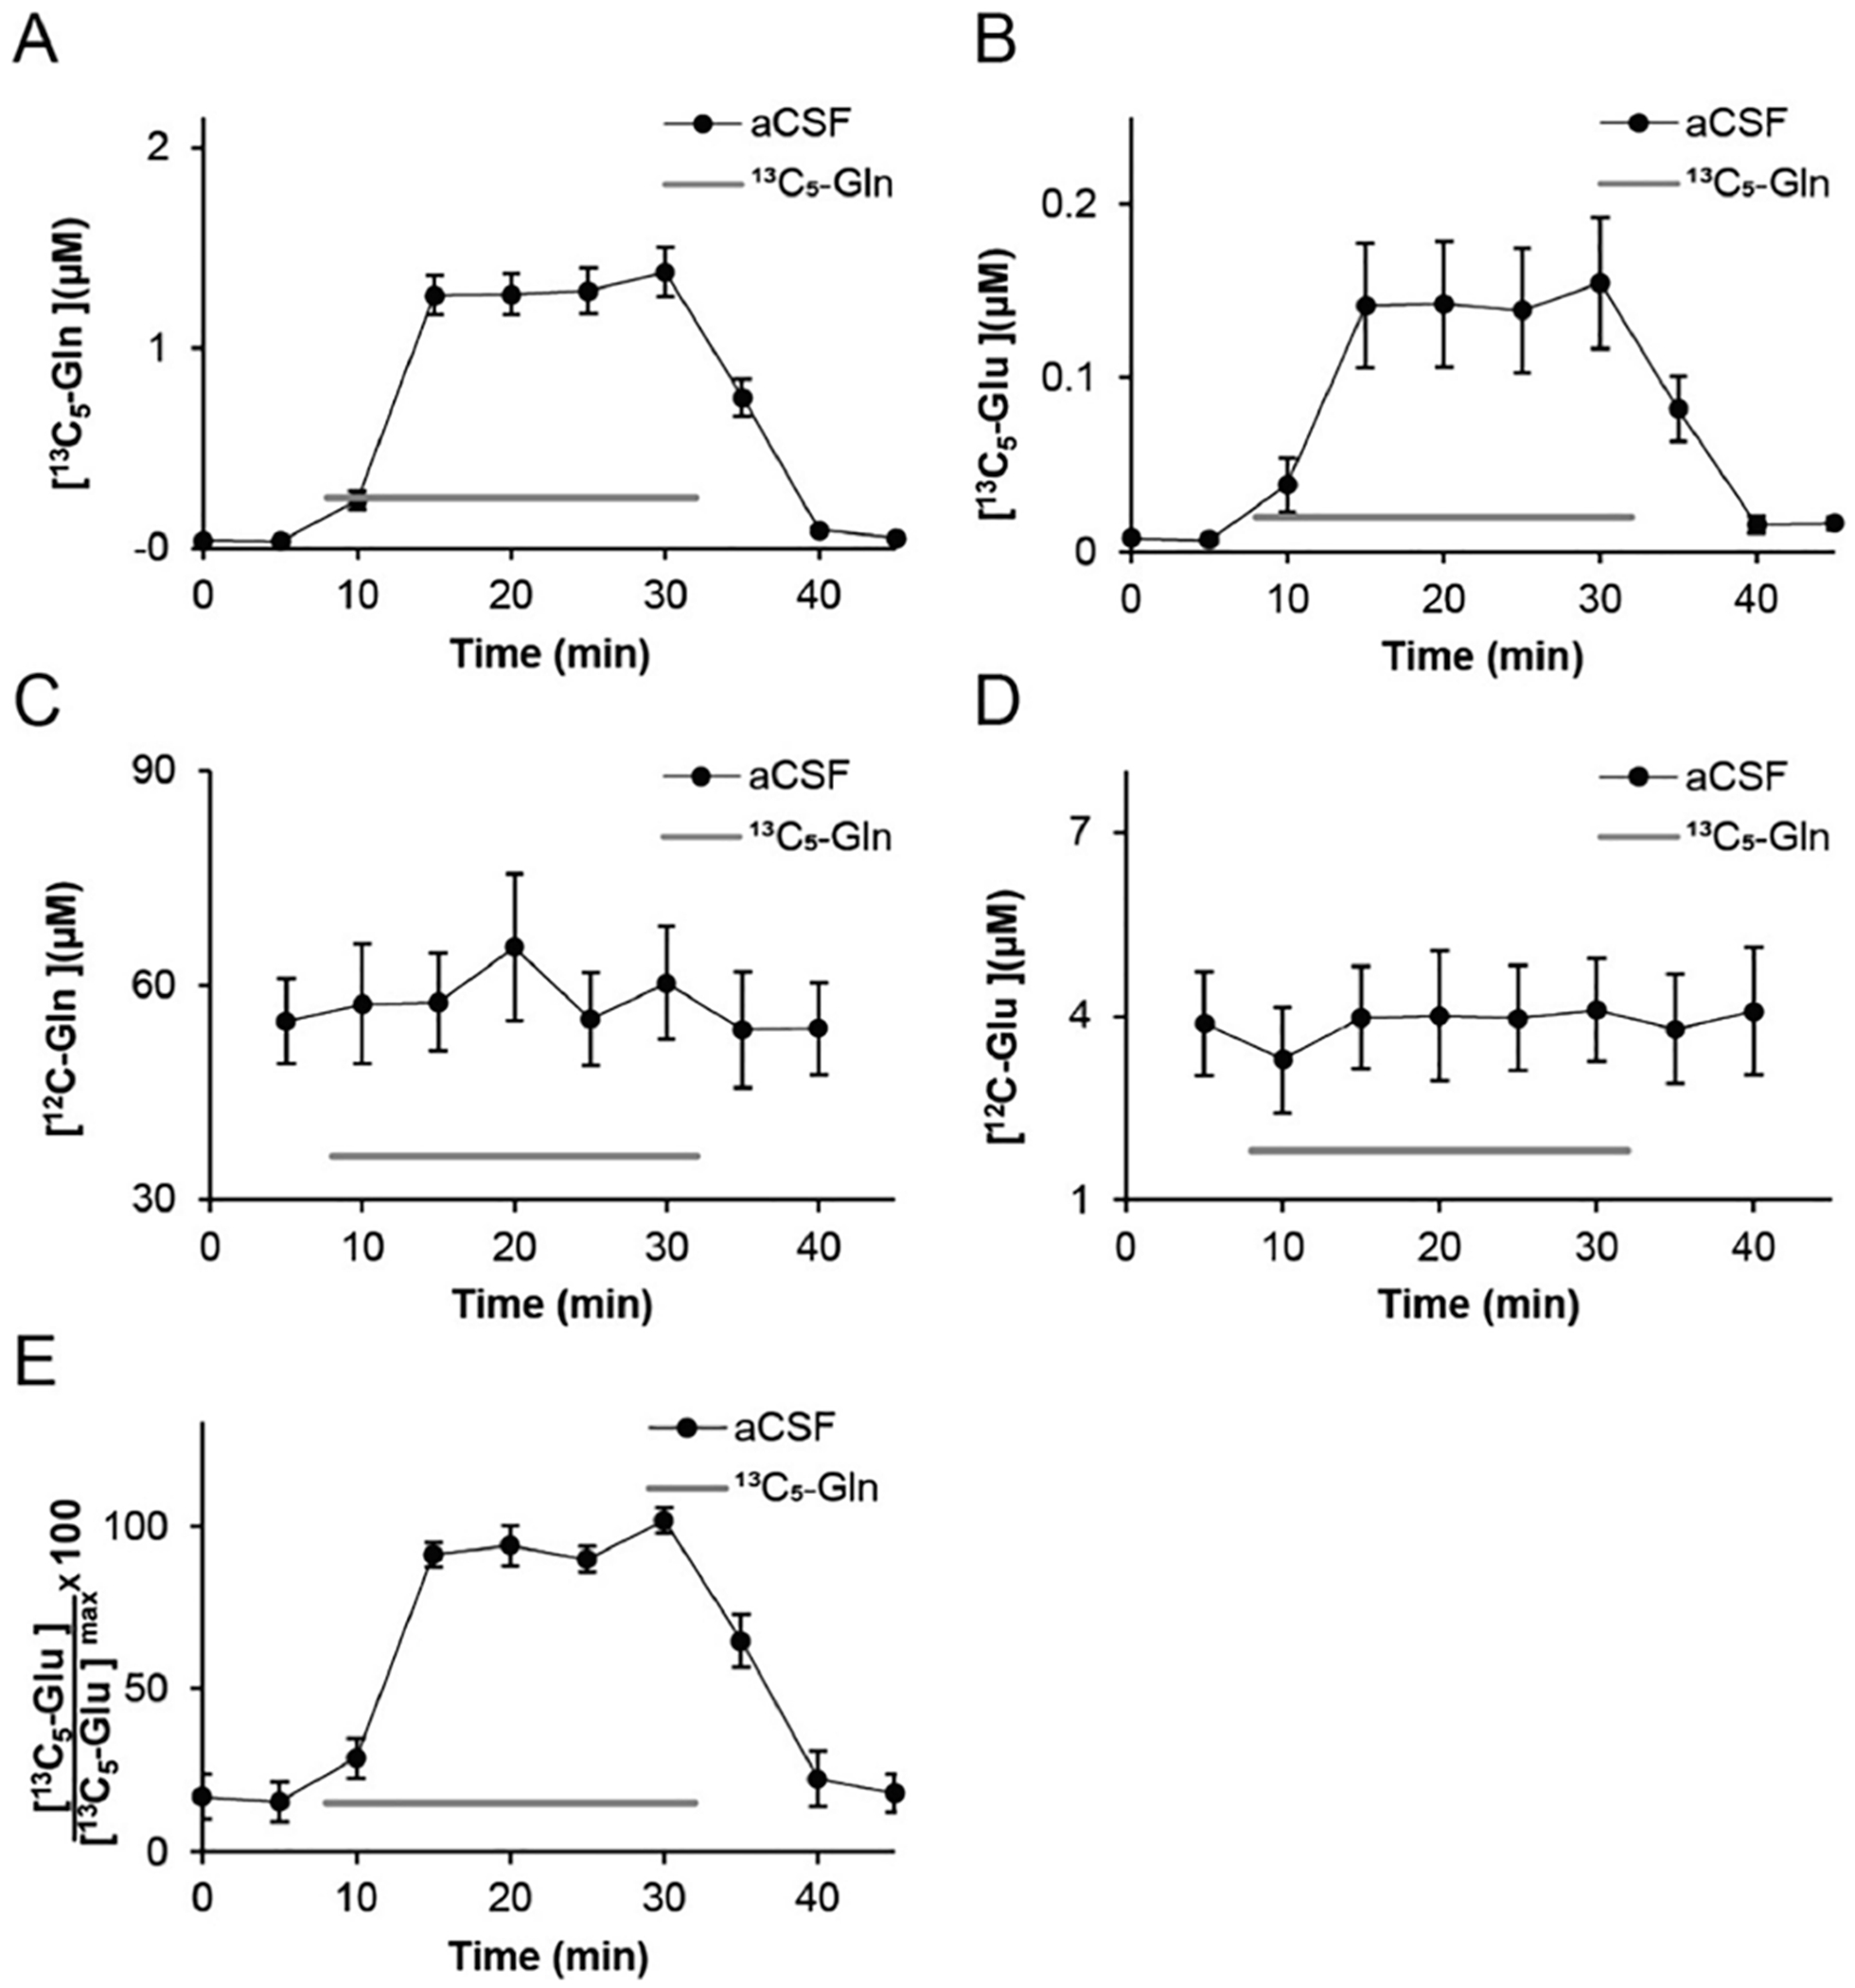
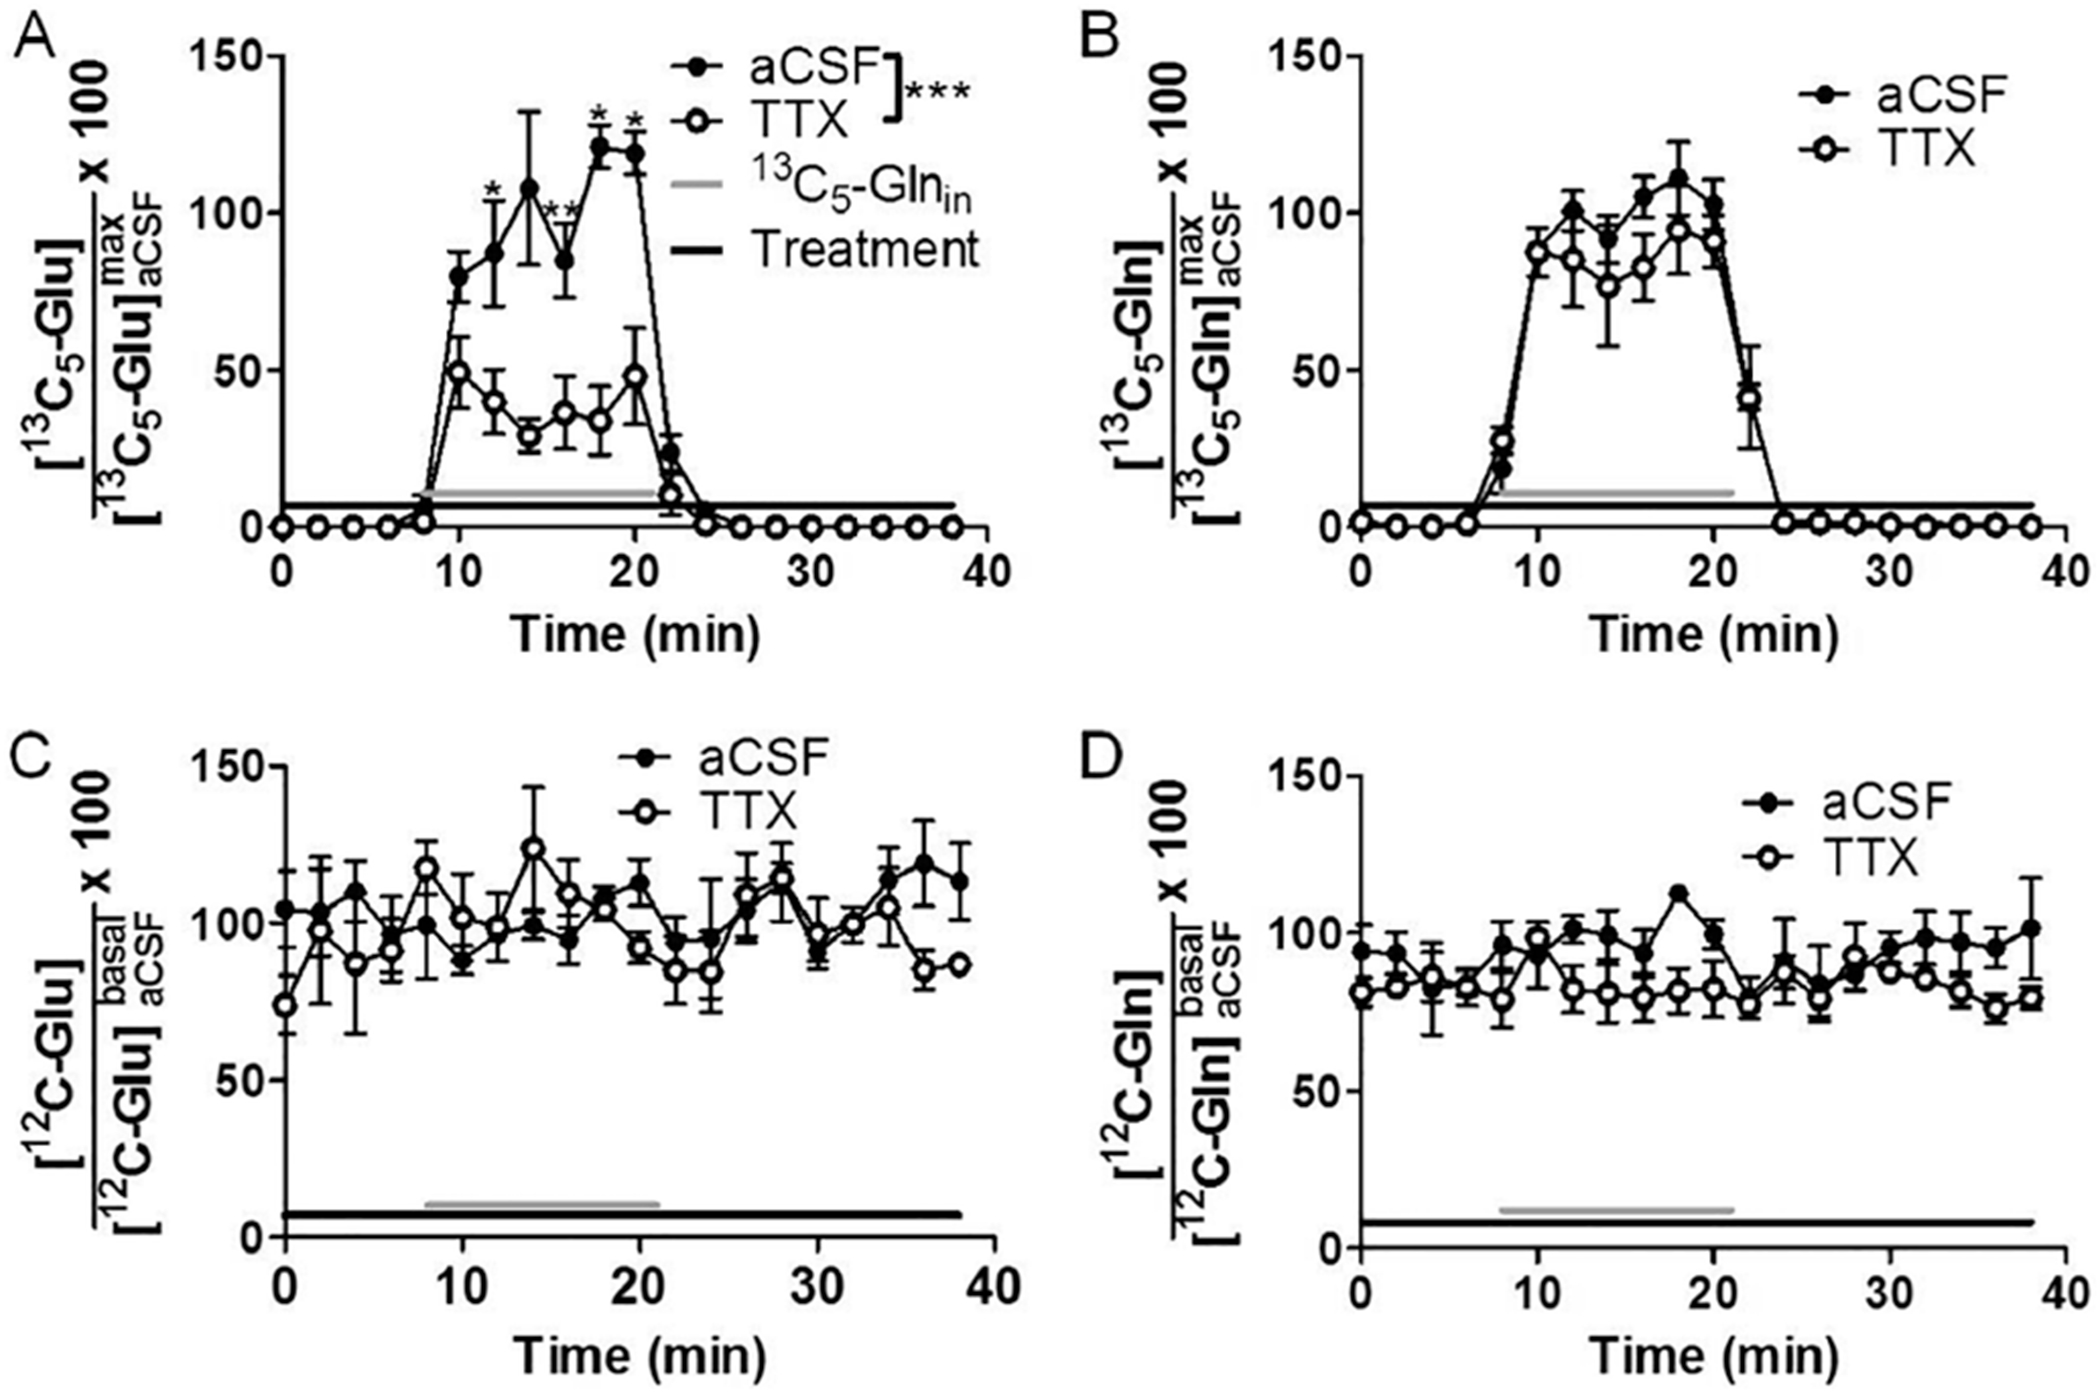
Extracellular glutamate (Glu) concentration measured in the brain using microdialysis sampling is regulated differently from that expected for classical neurotransmitters; e.g., the basal Glu concentration is not affected by blocking action potentials. Additionally, other sources, such as glial cells, contribute to Glu extracellular concentration making it difficult to interpret detected changes. We have found that infusing 2.5 μM 13C5-glutamine (Gln) through a microdialysis probe inserted in the rat cortex results in collection of 144 ± 35 nM (n = 11) 13C5-Glu in dialysate. The recovered 13C5-Glu was reduced by 33% by infusion of 20 mM α-(methylamino)isobutyric acid and 58% by 500 mM riluzole, inhibitors of glutamine transport into neurons. The 13C5-Glu measured was reduced by 62% with tetrodotoxin (TTX), a sodium channel blocker, and 59% with (1S,3R)-1-aminocyclopentane-1,3-dicarboxylic acid (ACPD), a metabotropic glutamate agonist, while endogenous Glu remained unchanged. These results support the hypothesis that the measured 13C5-Glu is derived from neurons via the Gln-Glu shuttle. To further investigate regulation of 13C5-Glu, we applied a stressor (tail pinch), observing a 155% increase in dialysate 13C5-Glu concentration. This effect was blocked by infusion of TTX indicating neuronal release. Local infusion of l-trans-pyrrolidine-2,4-dicarboxylic acid (PDC), a Glu uptake inhibitor, increased both endogenous Glu and 13C5-Glu concentrations, consistent with reverse transport and spread of neuronal release. Taken together, these experiments show that metabolic labeling of Glu via Gln delivered through a microdialysis probe allows differentiation of neuronal and other sources of Glu in the brain. The results support the concept of compartmentalized Glu in the brain.

Keywords: astrocyte; glutamate-glutamine shuttle; mass spectrometry; microdialysis; neuronal glutamate.


Conflict of interest statement

The authors declare no competing financial interest.

Figures

Figure 1.
Figure 1.
Recovered concentrations (μM) of (A) 13C5-Gln, (B) 13C5-Glu, (C) 12C-Gln, and (D) 12C-Glu following infusion of 2.5 μM 13C5-Gln (gray bar) into the microdialysis probe. (E) Normalized 13C5-Glu concentration from individual experiments. Each subject’s 13C5-Glu concentration was normalized to its maximal concentration reached during infusion of 2.5 μM 13C5-Gln, illustrating relative consistency across multiple infusion cycles (n = 11).
Figure 2.
Figure 2.
Effect of Gln transport inhibitors on conversion of 13C-Gln to 13C-Glu. (A) The presence of 20 mM MEAIB in perfusion solution reduced the concentration of 13C5-Glu recovered in dialysate (open circles) compared to the aCSF control (filled circles) during infusion of 2.5 μM 13C5-Gln (blank bar); (B) presence of 500 μM riluzole in perfusion solution reduced the concentration of 13C5-Glu recovered in dialysate (open circles) compared to the aCSF control (filled circles) during infusion of 2.5 μM 13C5-Gln (gray bar). Data are average (n = 11 for A and n = 6 for B) with error bars showing ± SEM. Significantly different time points are indicated with *** for p ≤ 0.001, ** for p ≤ 0.01, and * for p ≤ 0.05.
Figure 3.
Figure 3.
(A) The presence of 2 μM TTX (black bar) in perfusion solution reduced the concentration of 13C5-Glu recovered in dialysate (filled circles) compared to no TTX (open circles) during infusion of 2.5 μM 13C5-Gln (gray bar). For the same experiment, TTX did not affect the dialysate concentration of 13C5-Gln (B), 12C-Glu (C), or 12C-Gln (D). Data are expressed as concentration in dialysate relative to maximal for each panel. The concentrations of 13C5-Glu and 13C5-Gln for each infusion were normalized to the mean concentrations of 13C5-Glu and 13C5-Gln, respectively, of all time points during the first infusion (labeled with subscript “max”), which reached a steady-state maximum. The 12C-Glu and 12C-Gln were normalized to basal levels. Data are average (n = 3 for all panels) with error bars showing ±SEM. Significantly different time points from TTX to without are indicated with *** for p ≤ 0.001, ** for p ≤ 0.01, and * for p ≤ 0.05.
Figure 4.
Figure 4.
(A) The presence of 200 μM ACPD (black bar) in perfusion solution reduced the concentration of 13C5-Glu recovered in dialysate (open circles) compared to without ACPD (filled circles) during infusion of 2.5 μM 13C5-Gln (gray bar). The overall decrease was 59% (p ≤ 0.001, n = 4). (B) For the same experiment, ACPD did not affect the dialysate concentration of 13C5-Gln (n = 4), (C) 12C-Glu (n = 4), or (D) 12C-Gln (n = 4). (E) The effect of ACPD on 13C5-Glu was reversed by addition of 200 μM MCPG to infusion solution (black bar, n = 6). (F) Combined ACPD and MCPG had no effect on 13C5-Gln compared to aCSF (n = 6). (G) During infusion of 2.5 μM 13C5-Gln (gray bar), the presence of 200 μM MCPG (black bar) in perfusion solution had no statistically significant effect on 13C5-Glu (n = 3) or (H) 13C5-Gln (n = 3) recovered in dialysate (open circles) compared to infusion of 13C5-Gln without MCPG (filled circles). The concentrations of 13C5-Glu and 13C5-Gln for each infusion were normalized to the mean concentrations of 13C5-Glu and 13C5-Gln, respectively, of all time points during the first infusion (labeled with subscript “max”), which reached a steady-state maximum. The 12C-Glu and 12C-Gln were normalized to basal levels. Data are average with error bars showing ±SEM. Significantly different time points from the control are indicated with ** for p ≤ 0.01 and * for p ≤ 0.05.
Figure 5.
Figure 5.
(A) Infusion of 1 mM PDC (black bar) increased the dialysate concentration of 13C5-Glu (open black circles) to 173 ± 8% (p < 0.01) relative to aCSF treatment (filled black circles) while infusing 2.5 μM 13C5-Gln (gray bar). (B) PDC had no effect on the loss of 13C5-Gln through the probe membrane. (C) During the same experiment, PDC increased [12C-Glu] by 342 ± 76% (p < 0.001) relative to no PDC perfused through the probe. (D) PDC had no effect on [12C-Gln]. The concentrations of 13C5-Glu and 13C5-Gln for each infusion were normalized to the mean concentrations of 13C5-Glu and 13C5-Gln, respectively, of all time points during the first infusion, which reached a steady-state maximum. Data are average (n = 4 for all panels) with error bars showing ±SEM. Significantly different time points from control are indicated with *** for p ≤ 0.001, ** for p ≤ 0.01, and * for p ≤ 0.05.
Figure 6.
Figure 6.
Infusion of 75 mM K+ aCSF (black bar) had no effect on the dialysate concentration of 13C5-Glu (A) or 13C5-Gln (B) relative to normal aCSF while infusing 2.5 μM 13C5-Gln (gray bar). The high K+ treatment evoked (C) an increase in [12C-Glu] (p < 0.05), (D) a decrease in endogenous [12C-Gln] (p < 0.001), and (E) an increase in endogenous [12C-GABA] (p < 0.01). The concentrations of 13C5-Glu and 13C5-Gln were normalized to the average concentrations of each during the 13C5-Gln infusion with only aCSF, which reached a steady-state maximum. Data are averages (n = 4 for all panels) with error bars showing ±SEM. Significantly different individual time points from the control are indicated with *** for p ≤ 0.001, ** for p ≤ 0.01, and * for p ≤ 0.05.
Figure 7.
Figure 7.
Effect of tail pinch on Glu measurements. (A) Tail pinch (gray solid bar, n = 4) evoked a 155 ± 14% increase (p < 0.05) in dialysate concentration of 13C5-Glu (filled black circles) while infusing 2.5 μM 13C5-Gln (dashed line). This increase was blocked in the presence of TTX (open circles, n = 3). For the same experiment, no overall change in the [13C5-Gln]out (B), [12C-Glu]out, (C) or [12C-Gln]out (D) was observed. The concentrations of 13C5-Glu and 13C5-Gln were normalized to the average concentrations of each prior to the tail pinch. Data are averages (n = 4 for tail pinch, n = 3 for TTX) with error bars showing ±SEM. Significantly different time points from the control are indicated with * for p ≤ 0.05.
Figure 8.
Figure 8.
Illustration of sources of Glu sampled by a microdialysis probe. (A) Endogenous Glu is released by neurons and taken up by astrocytes. Little directly from the neurons reaches the dialysis probe (dashed line). Astrocytes may be a source of larger concentrations of Glu. (B) With 13C5-Gln (red) infused through the probe, it can be taken up and selectively converted to 13C5-Glu (light blue). Once released, it follows the same fate as endogenous Glu; however, the background is low allowing the neuronal fraction to be detected.

References

    1. Araque A; Parpura V; Sanzgiri RP; Haydon PG Tripartite synapses: glia, the unacknowledged partner. Trends in Neurosciences 1999, 22 (5), 208–215. - PubMed
    1. Del Arco A; Segovia G; Fuxe K; Mora F Changes in dialysate concentrations of glutamate and GABA in the brain: an index of volume transmission mediated actions? Journal of Neurochemistry 2003, 85 (1), 23–33. - PubMed
    1. Haydon PG Glia: Listening and talking to the synapse. Nat. Rev. Neurosci 2001, 2 (3), 185–193. - PubMed
    1. Machado-Vieira R; Manji HK; Zarate CA The Role of the Tripartite Glutamatergic Synapse in the Pathophysiology and Therapeutics of Mood Disorders. Neuroscientist 2009, 15 (5), 525–539. - PMC - PubMed
    1. Clements JD; Lester RAJ; Tong G; Jahr CE; Westbrook GL The time course of glutamate in the synaptic cleft. Science 1992, 258 (5087), 1498–1501. - PubMed

LinkOut - more resources