. 2025 Aug 21;10(19):e193495.
doi: 10.1172/jci.insight.193495. eCollection 2025 Oct 8.

Essential role of protein kinase R in the pathogenesis of pulmonary veno-occlusive disease

Affiliations

Essential role of protein kinase R in the pathogenesis of pulmonary veno-occlusive disease

Amit Prabhakar et al. JCI Insight. .

Abstract

Pulmonary veno-occlusive disease (PVOD) is a rare and severe subtype of pulmonary arterial hypertension, characterized by progressive remodeling of small pulmonary arteries and veins with no therapies. Using a mitomycin C-induced (MMC-induced) rat model, we previously demonstrated that protein kinase R-mediated (PKR-mediated) integrated stress response (ISR) drives endothelial dysfunction and vascular remodeling. To determine whether PKR is the primary mediator of ISR and the pathogenesis, we treated control (Ctrl) and PKR-knockout (KO) mice with the same dose of MMC. Consistent with rat data, Ctrl mice displayed ISR activation, vascular remodeling, and pulmonary hypertension after MMC treatment, while KO mice showed none of these phenotypes. Proteomic analysis revealed that MMC-mediated ISR activation attenuated protein synthesis in Ctrl but not in KO mice. These findings underscore the critical role of PKR-dependent ISR activation and subsequent perturbation of proteostasis as central mechanisms driving PVOD pathogenesis and identify PKR as a promising therapeutic target.

Keywords: Cell biology; Cell stress; Vascular biology.


Conflict of interest statement

Conflict of interest: The authors have declared that no conflict of interest exists.

Figures

Figure 1
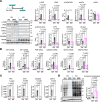
Figure 1. ISR activation upon MMC treatment is abolished in PKR-deficient mice.
(A) Schematic representation of MMC-induced PVOD mouse model (top left) and immunoblot analysis of the indicated proteins in total lung lysates from vehicle (Veh)- or MMC-treated Control (Ctrl) and PKR-KO (KO) mice on day 5 (bottom left). The relative amounts of the indicated proteins, normalized to β-actin, are shown as mean ± SEM (right). n = 4 lung samples from Veh-treated Ctrl or KO mice and 6 lung samples from MMC-treated Ctrl or KO mice. (B) The levels of ATF4 target gene mRNAs, such as ATF3, ATF4, PKR, GADD34, GDF15, and VEGFA, in the lungs of Ctrl and KO mice treated with Veh or MMC on day 5 were analyzed by RT-qPCR. The results were normalized to β-actin levels and are presented as mean ± SEM. n = 9 independent samples. (C) ChIP assay was performed using the lungs harvested from Ctrl and KO mice treated with Veh or MMC employing an anti-ATF4 antibody, followed by PCR amplification corresponding to the genomic region of the PKR, ATF3, GADD34, and GDF15 genes spanning the ATF4 binding sequence. The PCR results are presented as fold enrichment over the input as mean ± SEM. n = 4 independent experiments. (D) In vivo puromycin incorporation assay. Ctrl and KO mice treated with Veh or MMC were administered puromycin on day 5, followed by lung lysate preparation. After normalizing the total protein content, samples were subjected to SDS-PAGE. Puromycin-labeled proteins were visualized by immunoblotting using anti-puromycin and anti–β-actin antibodies (left panel). The levels of puromycin-labeled proteins, normalized to β-actin as a loading control, are shown as mean ± SEM (right panel). n = 4 independent samples per group. Statistical analysis was performed using 2-way ANOVA with Tukey’s multiple-comparison test.
Figure 2
Figure 2. PKR-deficient mice do not develop PVOD phenotypes.
(A) RVSP (mmHg) and RV/LV+S ratio in vehicle- (Veh) or MMC-administered control (Ctrl) and KO mice. Male and female animals are indicated as black circles and blue triangles, respectively. n = 8–9 independent samples per group. (B) RV wall thickness (mm) of Veh- or MMC-treated Ctrl and KO mice was measured and shown as mean ± SEM (left). The wall thickness was measured at 5 locations, and the mean value was calculated per sample. n = 6 independent samples per group. (C) Microfil casting of the lung vasculature in Ctrl and KO mice treated with either Veh or MMC on day 5 (d5). Holistic images of the entire lung are displayed (left). Scale bars: 0.5 cm. The number of junctions and branches per cm² of distal pulmonary vessels was quantified, with the data presented as mean ± SEM (right). n = 4 independent samples per group. (D) H&E staining of pulmonary vessels (PA and PV; arrows) in Ctrl and KO mice administered Veh or MMC (left). The third column is a magnified image of the black rectangle area in the second column (left). The fraction (%) of moderately (25%–40% occlusion) and severely (>40% occlusion) occluded vessels were counted and shown as mean ± SEM (right). Scale bars: 10 μm. n = 5 independent samples. (E) MSB staining visualizing collagens (blue) and smooth muscle cells (pink) in the lungs of Ctrl (on d5) and KO mice (on d5 and d10) following Veh or MMC administration. Scale bars: 10 μm. (F) PAs and PVs from Ctrl and KO mice on d5 or d10 after vehicle or MMC administration were stained with an anti-αSMA (red) and anti–VE-Cad (green) antibody for smooth muscle cells and endothelial cells, respectively. The merged images of αSMA and VE-Cad staining are shown. An asterisk indicates the location of the vessel (top). Scale bars: 50 μm. The signal intensities of αSMA and VE-Cad are quantified and are presented as mean ± SEM (bottom). (G) The permeability of pulmonary vasculature was assessed by injecting EB dye in Ctrl and KO mice administered with vehicle or MMC. The lung was harvested on d5 or d10, and the image was taken when the lung became translucent (left). Representative images of the whole lung and the largest lobe are presented. Scale bar: 0.5 cm. The relative intensities of EB staining were quantified and are presented as mean ± SEM (right). Statistical analysis was performed using 1-way ANOVA with Tukey’s multiple-comparison test (A) or 2-way ANOVA with Tukey’s multiple-comparison test (BD, F, and G).
Figure 3
Figure 3. MMC treatment does not impair pulmonary vascular endothelium in PKR-deficient mice following MMC treatment.
(A) PVECs were isolated from the lungs of Ctrl and KO mice administered with vehicle or MMC and subjected to IF staining with anti–VE-Cad antibody (green) and DAPI (blue) for nuclei. Scale bars: 10 μm. (B) PVECs isolated from the mice administered vehicle or MMC were subjected to IF staining for p-PKR (green, left), ATF4 (red, right), and with DAPI (blue) for nuclei. Scale bars: 10 μm. (C) The plasma isolated from Veh- or MMC-treated Ctrl and KO mice on day 5 were subjected to IP with an anti-Rad51 antibody or nonspecific IgG (control), followed by immunoblot analysis with an anti–VE-Cad (for VRC) and anti-Rad51 antibody to detect the interaction between these proteins. Immunoblot with an anti-transferrin antibody (TF) is shown as loading control. n = 2 plasma samples from Veh-treated Ctrl or KO mice and 3 plasma samples from MMC-treated Ctrl or KO mice (left). The relative amounts of the indicated proteins normalized to TF are demonstrated as mean ± SEM (right). n = 4 plasma samples from Veh-treated Ctrl or KO mice and 6 plasma samples from MMC-treated Ctrl or KO mice (left). Statistical analysis was performed using 2-way ANOVA with Tukey’s multiple-comparison test.
Figure 4
Figure 4. Effects of MMC on the lung proteomic landscape in Ctrl and KO mice.
(A) Lungs harvested on day 5 from Veh- or MMC-treated Ctrl and KO mice were subjected to MS analysis. The principal component analysis of the MS data for lungs from Veh- or MMC-treated Ctrl and KO mice, conducted in triplicate, is shown. (B) A hierarchically clustered heatmap of differentially expressed proteins (DEPs) that are statistically significant (P < 0.05 by 2-tailed Student’s t test) in the lungs of Veh- or MMC-treated Ctrl and KO mice. n = 3 per group. (C) Volcano plots compare the proteome of MMC-treated versus Veh-treated Ctrl and KO mouse lungs (top). A larger circle size represents a lower P value, while the color gradient from blue to red corresponds to increasing log2(FC) values, with blue indicating lower values and magenta indicating higher values. Pie charts demonstrate the fraction (%) of DEPs upregulated (magenta) or downregulated (blue), with a threshold of log2(FC) greater than 0.8 or less than –0.8 in Ctrl and KO mice (bottom). The gray part represents the fraction of DEPs with –0.8 ≤ log2(FC) ≤ 0.8. n = 3 per group. (D) Top 15 pathways most enriched in upregulated (magenta) and downregulated (blue) DEPs in the lungs of Ctrl (top) and KO mice (bottom) following MMC treatment. The green, red, and orange asterisks indicate pathways related to protein synthesis/modifications, RNA metabolism, and mitochondrial ATP synthesis, respectively. (E) The bar graphs indicate the fold change in ribosomal proteins (left panel) and components of the mitochondrial electron transport chain (ETC) (right panel) between vehicle and MMC treatment in Ctrl and KO mice. Magenta and blue colors indicate upregulated and downregulated proteins, respectively. Darker colored bars represent P < 0.05. Differential expression of proteins was assessed using Welch’s t test.

References

    1. Lechartier B, et al. Pulmonary veno-occlusive disease: illustrative cases and literature review. Eur Respir Rev. 2024;33(171):230156. doi: 10.1183/16000617.0156-2023. - DOI - PMC - PubMed
    1. Montani D, et al. Pulmonary veno-occlusive disease: clinical, functional, radiologic, and hemodynamic characteristics and outcome of 24 cases confirmed by histology. Medicine (Baltimore) 2008;87(4):220–233. doi: 10.1097/MD.0b013e31818193bb. - DOI - PubMed
    1. Montani D, et al. Pulmonary veno-occlusive disease. Eur Respir J. 2016;47(5):1518–1534. doi: 10.1183/13993003.00026-2016. - DOI - PubMed
    1. Boucly A, et al. Outcomes and risk assessment in pulmonary veno-occlusive disease. ERJ Open Res. 2024;10(1):00612-2023. doi: 10.1183/23120541.00612-2023. - DOI - PMC - PubMed
    1. Reinders S, et al. Survival, morbidity, and quality of life in pulmonary arterial hypertension patients: a systematic review of outcomes reported by population-based observational studies. Respir Res. 2024;25(1):373. doi: 10.1186/s12931-024-02994-w. - DOI - PMC - PubMed