. 2025 Aug 21;135(17):e185602.
doi: 10.1172/JCI185602. eCollection 2025 Sep 2.

Ppp2r1a haploinsufficiency increases excitatory synaptic transmission and decreases spatial learning by impairing endocannabinoid signaling

Affiliations

Ppp2r1a haploinsufficiency increases excitatory synaptic transmission and decreases spatial learning by impairing endocannabinoid signaling

Yirong Wang et al. J Clin Invest. .

Abstract

Protein phosphatase 2A (PP2A) is a serine/threonine phosphatase in the brain. Mutations in PPP2R1A, encoding the scaffolding subunit, are linked to intellectual disability, although the underlying mechanisms remain unclear. This study examined mice with heterozygous deletion of Ppp2r1a in forebrain excitatory neurons (NEX-het-conditional knockout [NEX-het-cKO]). These mice exhibited impaired spatial learning and memory, resembling Ppp2r1a-associated intellectual disability. Ppp2r1a haploinsufficiency also led to increased excitatory synaptic strength and reduced inhibitory synapse numbers on pyramidal neurons. The increased excitatory synaptic transmission was attributed to increased presynaptic release probability, likely due to reduced levels of 2-arachidonoyl glycerol (2-AG). This reduction in 2-AG was associated with increased transcription of monoacylglycerol lipase (MAGL), driven by destabilization of enhancer of zeste homolog 2 (EZH2) in NEX-het-cKO mice. Importantly, the MAGL inhibitor JZL184 effectively restored both synaptic and learning deficits. Our findings uncover an unexpected role of PPP2R1A in regulating endocannabinoid signaling, providing fresh molecular and synaptic insights into the mechanisms underlying intellectual disability.

Keywords: Development; Intellectual disability; Neurodevelopment; Neuroscience; Synapses.


Figures

Figure 1
Figure 1. Ppp2r1a haploinsufficiency in forebrain excitatory neurons impairs spatial learning and memory.
(A) Schematic representation of forebrain excitatory neuron–specific Ppp2r1a cKO in mice. (B) Genotype analysis of the offspring showing that homozygous Ppp2r1a deletion is lethal (observed, n = 81 mice; expected, n = 108 mice). (C) NEX-Cre; Ppp2r1afl/fl (NEX-hom-cKO) pups displaying dysplasia at E18. Scale bar: 5 mm. (D) Schematic illustrating that littermate control and NEX-het-cKO mice are used in all experiments. (E) Body weights are normal in NEX-het-cKO mice (Control, n = 13; NEX-het-cKO, n = 15). (F and G) NEX-het-cKO mice exhibited impaired performance in the T-maze (Control, n = 13; NEX-het-cKO, n = 12). (HJ) NEX-het-cKO mice exhibited impaired performance in the EAM (Control, n = 17; NEX-het-cKO, n = 20). (H) Schematic of the EAM. (I) Number of errors. (J) Time spent seeking out all pellets. (KO) NEX-het-cKO mice demonstrated impaired performance in the BM (Control, n = 14; NEX-het-cKO, n = 16). (K) Schematic of the BM. (L) Number of primary errors. (M) Primary latency. (N) Primary path length. (O) Percentage of strategy used. Statistical comparisons were performed using 2-tailed unpaired Student’s t test (G and O), Chi-square test (B), and 2-way ANOVA followed by Bonferroni’s post hoc test (E, I, J, and L–N). All data are presented as mean ± SEM. *P < 0.05, **P < 0.01, ***P < 0.001.
Figure 2
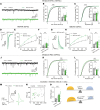
Figure 2. Ppp2r1a haploinsufficiency increases excitatory synaptic transmission, decreases inhibitory synaptic transmission, and alters excitation-inhibition balance.
(A–C) Ppp2r1a haploinsufficiency increased mEPSC frequency (Control, n = 25 neurons; NEX-het-cKO, n = 20 neurons). (A) Representative mEPSC traces in mPFC L5 pyramidal neurons. (B) Cumulative distribution of interevent interval and summary of mEPSC frequency (inset). (C) Cumulative distribution and summary of mEPSC amplitude (inset). (D–F) Ppp2r1a haploinsufficiency increased AMPAR-mediated synaptic responses (Control, n = 20 neurons; NEX-het-cKO, n = 18 neurons). (D) Representative traces of evoked AMPAR-EPSCs. (E) Input/output plot of EPSC amplitude versus stimulation intensity. (F) Slope of input/output relationship. (GI) Ppp2r1a haploinsufficiency increased NMDAR-mediated synaptic responses (Control, n = 22 neurons; NEX-het-cKO, n = 19 neurons). (G) Representative traces of evoked NMDAR-EPSCs. (H) Input/output plot of EPSC amplitude versus stimulation intensity. (I) Slope of input/output relationship. (JL) Ppp2r1a haploinsufficiency decreased both the frequency and amplitude of mIPSCs (Control, n = 19 neurons; NEX-het-cKO, n = 15 neurons). (J) Representative mIPSC traces recorded in L5 pyramidal neurons. (K) Cumulative distribution of interevent interval and summary of mIPSC frequency (inset). (L) Cumulative distribution of mIPSC amplitude and summary graphs of mIPSC amplitude (inset). (MP) Ppp2r1a haploinsufficiency increased E/I ratio (Control, n = 15 neurons; NEX-het-cKO, n = 16 neurons). (M) Representative traces of EPSCs and IPSCs. (N) Scatterplots depicting amplitudes of EPSCs and IPSCs recorded from both genotypes. (O) Increased E/I ratio in NEX-het-cKO mice. (P) Model illustrating that Ppp2r1a haploinsufficiency alters E/I balance. Statistical comparisons were performed using 2-tailed unpaired Student’s t test (C, K, and L), 2-tailed unpaired Student’s t test with Welch’s correction (I and O), 2-tailed Mann-Whitney test (B and F), 2-way ANOVA followed by Bonferroni’s post hoc test (E and H), and 2-tailed Kolmogorov-Smirnov test (cumulative distribution) (B, C, K, and L). All data are presented as mean ± SEM. *P < 0.05, **P < 0.01, ***P < 0.001.
Figure 3
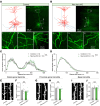
Figure 3. Ppp2r1a haploinsufficiency does not alter neuronal morphology.
(A–D) Normal neuronal morphology in NEX-het-cKO mice (Control, n = 13 neurons; NEX-het-cKO, n = 10 neurons). (A and B) Morphological reconstructions of L5 pyramidal neurons from control (A) and NEX-het-cKO (B) mice. Left, representative reconstruction of biocytin-labeled neurons (red, soma and dendrites; blue, axons). Right, maximum intensity projections of biocytin-labeled neurons. Bottom, magnified area showing dendritic structures (1 and 4, distant apical dendrites; 2 and 5, proximal apical dendrites; 3 and 6, basal dendrites). Scale bars: 100 μm (top), 20 μm (bottom). (C and D) Group data for Sholl analysis showing normal apical (C) and basal (D) dendrites in NEX-het-cKO mice. (EJ) Normal spine density in NEX-het-cKO mice. Scale bar: 2 μm. Representative images (E) and summary graph (F) illustrating normal spine density in NEX-het-cKO mice (Control, n = 9 neurons from 6 mice; NEX-het-cKO, n = 12 neurons from 8 mice). (G and H) Same as E and F but for proximal apical dendrites (Control, n = 7 neurons from 6 mice; NEX-het-cKO, n = 8 neurons from 6 mice). (I and J) Same as E and F but for basal dendrites (Control, n = 13 neurons from 7 mice; NEX-het-cKO, n = 10 neurons from 8 mice). To assess spine density along distal apical, proximal apical, and basal dendrites, 3 dendritic segments were analyzed per neuron, and the average spine density was used for subsequent analyses. Statistical comparisons were performed using 2-tailed unpaired Student’s t test (F, H, and J) and 2-way ANOVA with Geisser-Greenhouse correction (C and D). All data are presented as mean ± SEM.
Figure 4
Figure 4. Ppp2r1a haploinsufficiency increases presynaptic Pr in excitatory synapses.
(A and B) Ppp2r1a haploinsufficiency increased presynaptic Pr (Control, n = 20 neurons; NEX-het-cKO, n = 20 neurons). (A) Representative traces of the PPR of EPSCs. (B) Summary graph showing decreased PPR in NEX-het-cKO mice. (C) Representative traces of NMDAR-EPSCs recorded before and after perfusion with 40 μM MK801 (at 15 and 25 min). (D) Summary showing accelerated blockade of NMDAR-EPSCs in NEX-het-cKO mice. (E) Decreased decay time constant of MK801 blockade in NEX-het-cKO mice (Control, n = 8 neurons; NEX-het-cKO, n = 8 neurons). (FM) Ppp2r1a haploinsufficiency increased the amplitude of presynaptic Ca2+ transients (Control, n = 6 mice; NEX-het-cKO, n = 5 mice). (F) Left, schematic of AAV-CAG-DIO-GCaMP6m injection in the ventral CA1(vCA1) of NEX-Cre (Control) or NEX-hetcKO mice and optical fiber recordings in mPFC slices. Right, representative coronal section showing GCaMP6m-expressing pyramidal neurons in the vCA1. Scale bars: 500 μm (left), 100 μm (right). DG: dentate gyrus. (G) Schematic of fiber photometry recordings in mPFC slices. Right, representative coronal section showing GCaMP6m-expressing axon terminals in mPFC. Scale bars: 200 μm (left), 100 μm (right). DAQ, data acquisition; PMT, photomultiplier tube. (H and I) Train stimulation with an increasing number of pulses (5, 10, 20, and 50) evoked GCaMP signals in control mice. (H) Heatmap of aligned GCaMP signals from individual mice, with number of pulses indicated by color. (I) Average traces of GCaMP signals across all animals from the control group. (J and K) Same as H and I but for NEX-het-cKO mice. (L) Input/output plot of GCaMP signals versus number of pulses. (M) Slope of input/output relationship. Statistical comparisons were performed using 2-tailed unpaired Student’s t test (M), 2-tailed unpaired Student’s t test with Welch’s correction (E), and 2-way ANOVA followed by Bonferroni’s post hoc test (B and L). All data are presented as mean ± SEM. *P < 0.05, ***P < 0.001.
Figure 5
Figure 5. Ppp2r1a haploinsufficiency alters the transcription of eCB enzymes.
(A) Workflow of sorted RNA-Seq experiments. (B) Volcano plot showing transcriptomic changes in NEX+ neurons of NEX-het-cKO mice. Pink dots represent upregulated DEGs with log2 (fold change) > 1 and P.adj < 0.05, and blue dots represent downregulated DEGs with log2 (fold change) < –1 and P.adj < 0.05 (green, eCB-associated enzymes; yellow, synaptic molecules). (C) Schematic of key enzymes involved in biosynthesis and degradation of 2-AG and AEA. VGCC, voltage-gated calcium channel; DAG, diacylglycerol, PGH2-G, prostaglandin H2-glycerol ester; PGH2-EA, Prostaglandin H2-ethanolamide; AA, arachidonic acid; EA, ethanolamine; NAT, N-acetyltransferase. (D) Bar graph showing mRNA expression levels (transcripts per million) of enzymes involved in eCB synthesis and degradation, alongside CB1R, based on sorted RNA-Seq of NEX+ neurons from control (n = 3) and NEX-het-cKO (n = 4) mice. Abhd6: α/β hydrolase domain containing 6; Cnr1, cannabinoid receptor 1. Statistical comparisons were performed using the negative binomial distribution model of DESeq2 (B) (also see Supplemental Table 1) and 2-tailed unpaired Student’s t test (D). All data are presented as mean ± SEM. *P < 0.05.
Figure 6
Figure 6. Ppp2r1a haploinsufficiency increases MAGL expression.
(A and B) Western blot analysis showing increased MAGL protein level in het-KO mice. β-Tubulin was used as the loading control for MAGL protein quantification, and β-actin was used for all other proteins. (C and D) Western blot analysis showing increased MAGL protein level in N2a cells treated with 10 nM OA. (E) Reverse transcription qPCR analysis showing increased Magl mRNA level in OA-treated N2a cells. (F and G) Western blot analysis showing that overexpression of PP2Ac in N2a cells reduced MAGL, but not FAAH protein levels. Numbers of mice (B) or N2a experiments (D, E, and G) for both genotypes are indicated in the graphs. Statistical comparisons were performed using 2-tailed unpaired Student’s t test (B, D, E, and G). All data are presented as mean ± SEM. *P < 0.05, **P < 0.01, ***P < 0.001.
Figure 7
Figure 7. PPP2R1A regulates Magl transcription in an EZH2-dependent manner.
(A) The distribution of AUC through motif enrichment analyses using sorted RNA-Seq data. Vertical line denoting the AUC threshold (AUC > mean + 2 × SD). (B) The recovery curve of motif enrichment analyses. The red line is the averaged recovery curve of all motifs, the green line represents mean + 2 × SD, and the blue line is the recovery curve of cisbp_M6539. The maximum enrichment level between cisbp_M6539 and the green curve is indicated by dotted line. (C) Possible sequence of the enriched motif cisbp_M6539. (D) Intersectional analyses identified EZH2 as the candidate TRF that both interacts with PPP2R1A and regulates Magl transcription. Pink circle, PPP2R1A-interacting proteins from BioGRID database; blue circle, predicted TRFs that regulate the DEGs; green circle, TRFs likely to regulate Magl transcription. (E) ChIP-Seq analyses showed EZH2 binding to the MAGL/Magl promoter, as identified by IDR (irreproducible discovery rate) < 0.05. (F) EPZ011989 (250 nM) treatment increased Magl mRNA levels. (G) Immunoblots revealing that EPZ011989 treatment increased MAGL protein levels. (HJ) Immunoblots revealing that PPP2R1A bidirectionally regulated the EZH2 expression. (H) EZH2 expression was reduced in het-KO mice. (I) OA (10 nM) treatment decreased EZH2 expression in N2a cells. (J) PP2Ac overexpression enhanced EZH2 expression in N2a cells. (K and L) PPP2R1A deficiency impaired EZH2 stability. (K) Cycloheximide (CHX; 300 μg/mL) chase assay showed accelerated EZH2 degradation in het-KO mice. (L) Same as K but for N2a cells treated with OA. Numbers of mice (H and K) or N2a experiments (F, G, I, J, and L) for both genotypes are indicated in the graphs. Statistical comparisons were performed using 2-tailed unpaired Student’s t test (GJ) and 2-way ANOVA followed by 2-tailed Bonferroni’s t test (F, K, and L). All data are presented as mean ± SEM. *P < 0.05, **P < 0.01, ***P < 0.001.
Figure 8
Figure 8. Ppp2r1a haploinsufficiency impairs eCB-dependent synaptic plasticity at excitatory synapses.
(A–E) Ppp2r1a haploinsufficiency impaired the strength of DSE (Control, n = 20 neurons; NEX-het-cKO, n = 23 neurons). (A) Schematic of DSE experiments. Top, whole-cell recordings from L5 pyramidal neurons during induction of DSE; bottom, DSE induction pathway in response to depolarization. (B) Representative EPSC traces before and after DSE induction. The black line represents depolarization (0 mV, 5 s). (C) Representative DSE experiment performed in control neurons. (D) Time-course summary of normalized EPSC amplitude during the DSE experiment. (E) DSE amplitude was decreased in NEX-het-cKO mice. (FJ) Ppp2r1a haploinsufficiency impaired eCB-LTD (Control, n = 15 neurons; NEX-het-cKO, n = 12 neurons; Control + AM251, n = 7 neurons). (F) Schematic of the eCB-LTD experiment. (G) Representative EPSC traces before and after S-DHPG (50 μM) application. (H) Normalized time-course summary of S-DHPG–mediated eCB-LTD in both genotypes. Note that the CB1R antagonist AM251 (10 μM) blocked this eCB-LTD. (I) Summary graph showing that eCB-LTD was impaired in NEX-het-cKO mice and blocked by AM251. (J) Summary graph showing that EPSC PPRs were increased in both control and NEX-het-cKO mice, suggesting that eCB-LTD was mediated by a reduced presynaptic Pr. Statistical comparisons were performed using 2-tailed unpaired Student’s t test (E and J), 2-tailed paired Student’s t test (J), 1-way ANOVA followed by 2-tailed Bonferroni’s t test (I), 2-tailed Wilcoxon’s test (J), and 2-tailed Mann-Whitney test (J). All data are presented as mean ± SEM. *P < 0.05, **P < 0.01, ***P < 0.001.
Figure 9
Figure 9. Ppp2r1a haploinsufficiency decreases eCB signaling in excitatory synapses.
(AF) CB1R activation exerted identical effects in both genotypes (Control, n = 12 neurons; NEX-het-cKO, n = 12 neurons). (A) Schematic of the WIN experiment. (B) Representative EPSCs before and after WIN (2 μM) application. (C) Normalized time-course summary of EPSC amplitude. (D) Unchanged WIN-mediated inhibition of EPSC amplitude. (E) WIN increased EPSC PPRs equally across both genotypes. (F) Normalized PPRs in both genotypes. (GL) Ppp2r1a haploinsufficiency impaired eCB signaling (Control, n = 13 neurons; NEX-het-cKO, n = 12 neurons). (G) Schematic of AM251 experiment. (H) Representative EPSCs before and after AM251 (5 μM) application. (I) Normalized time-course summary of EPSC amplitude. (J) Effect of AM251 on EPSC amplitude was reduced in NEX-het-cKO mice. (K) AM251-mediated reduction in PPR was blocked in NEX-het-cKO mice. (L) Normalized PPRs in both genotypes. (MT) GRABeCB2.0 signals were significantly reduced in NEX-het-cKO mice (Control, n = 7 mice; NEX-het-cKO, n = 6 mice). (M) Schematic of GRABeCB2.0 activation. (N) Schematic of viral injection and fiber photometry recordings of GRABeCB2.0 signals in the mPFC. Scale bar: 200 μm. (O and P) Electrical stimulation evoked transient increases in GRABeCB2.0 signals in controls. (O) Heatmap of aligned GRABeCB2.0 signals from individual mice, with stimulation intensities indicated by colors. (P) Average traces of GRABeCB2.0 signals across all controls. (Q and R) Same as O and P but for NEX-het-cKO mice. (S) Input/output plot of GRABeCB2.0 signals versus stimulation intensity. (T) Slope of input/output relationship. Statistical comparisons were performed using 2-tailed unpaired Student’s t test (D, E, K, L, and T), 2-tailed unpaired Student’s t test with Welch’s correction (F), 2-tailed Mann-Whitney test (E, J, and K), 2-tailed paired Student’s t test (E and K), 2-tailed Wilcoxon’s test (E and K), and 2-way ANOVA followed by Bonferroni’s post hoc test (S). All data are presented as mean ± SEM. *P < 0.05, **P < 0.01, ***P < 0.001.
Figure 10
Figure 10. Reduced 2-AG release mediates increased presynaptic Pr and learning deficits in NEX-het-cKO mice.
(A) Diagram showing synthesis and degradation pathways of 2-AG and AEA, together with related inhibitors. (BD) The 2-AG was the principal eCB evoked by electrical stimulation. Representative traces (B and C) and summary (D) showing that DO34 (1 μM) abolished GRABeCB2.0 signals (n = 5 mice). (EL) The 2-AG release was significantly reduced in NEX-het-cKO mice (Control, n = 5 mice; NEX-het-cKO, n = 6 mice). (E) Schematic of GRAB2-AG1.2 activation by 2-AG but not by AEA. (F) Schematic of AAV-Syn-DIO-2-AG1.2 injection in the mPFC of NEX-Cre (Control) or NEX-het-cKO mice. Heatmap (G) and average traces (H) of GRAB2-AG1.2 signals evoked by increasing stimulation intensities in control. (I and J) Same as in G and H but for NEX-het-cKO mice. (K) Input/output plot of GRAB2-AG1.2 signals versus stimulation intensity. (L) Slope of input/output relationship. (M and N) MAGL inhibitor JZL184 rescued the reduced EPSC PPRs in NEX-het-cKO mice (Control, n = 18 neurons; NEX-het-cKO, n = 21 neurons). (O and P) FAAH inhibitor URB597 did not affect the reduced EPSC PPRs in NEX-het-cKO mice (Control, n = 17 neurons; NEX-het-cKO, n = 19 neurons). (QT) JZL184 ameliorated spatial learning and memory deficits in NEX-het-cKO mice (Control, n = 13 mice; NEX-het-cKO, n = 10 mice; NEX-het-cKO + JZL184, n = 10 mice). Green asterisks, control versus NEX-het-cKO; red asterisks, NEX-het-cKO versus NEX-het-cKO + JZL184. (Q) Number of primary errors. (R) Primary latency. (S) Primary path length. (T) Percentage of strategy used. Statistical comparisons were performed using 2-tailed unpaired Student’s t test (L), 2-tailed paired Student’s t test (D), 1-way ANOVA followed by 2-tailed Bonferroni’s t test (Serial and Mixed; T), Kruskal-Wallis test followed by Dunn’s test (Direct; T), and 2-way ANOVA followed by Bonferroni’s post hoc test (K, N, P, and QS). Data are presented as mean ± SEM. *P < 0.05, **P < 0.01, ***P < 0.001.

Comment in

  • Unraveling endocannabinoid signaling disruption in a preclinical model of neurodevelopmental disorders doi: 10.1172/JCI196707

References

    1. Parenti I, et al. Neurodevelopmental disorders: from genetics to functional pathways. Trends Neurosci. 2020;43(8):608–621. doi: 10.1016/j.tins.2020.05.004. - DOI - PubMed
    1. Ismail FY, Shapiro BK. What are neurodevelopmental disorders? Curr Opin Neurol. 2019;32(4):611–616. doi: 10.1097/WCO.0000000000000710. - DOI - PubMed
    1. Delorme R, et al. Progress toward treatments for synaptic defects in autism. Nat Med. 2013;19(6):685–694. doi: 10.1038/nm.3193. - DOI - PubMed
    1. Clark AR, Ohlmeyer M. Protein phosphatase 2A as a therapeutic target in inflammation and neurodegeneration. Pharmacol Ther. 2019;201:181–201. doi: 10.1016/j.pharmthera.2019.05.016. - DOI - PMC - PubMed
    1. Houge G, et al. B56δ-related protein phosphatase 2A dysfunction identified in patients with intellectual disability. J Clin Invest. 2015;125(8):3051–3062. doi: 10.1172/JCI79860. - DOI - PMC - PubMed

MeSH terms