. 2025 Sep 8;26(9):5614-5632.
doi: 10.1021/acs.biomac.5c00290. Epub 2025 Aug 21.

Davanat-Mimetic Galactomannan and Its Sulfated Derivative: Structure and Antitumor Effects against Melanoma

Affiliations

Davanat-Mimetic Galactomannan and Its Sulfated Derivative: Structure and Antitumor Effects against Melanoma

Odair Braz Júnior et al. Biomacromolecules. .

Abstract

Melanoma is the most aggressive skin cancer, with a high metastatic potential and limited treatment options in advanced stages. Polysaccharides are promising antitumor agents, and therefore, this study investigated a galactomannan from guar gum hydrolysis (GGH) and its sulfated derivative (GGHS) for their antimelanoma and immunostimulatory effects. GGH shares structural similarity with DAVANAT, a galectin-1 ligand with anticolorectal cancer activity, while GGHS has anticoagulant properties, like heparin used in cancer patients. In vitro, 100 μg/mL GGH or GGHS inhibited melanoma cell invasion, increased adhesion, and reduced colony size, while GGHS also reduced proliferation. Both compounds bind galectin-3 and -1, but only GGH suppressed tumor progression in mice. Both treatments stimulated macrophage proinflammatory responses, including reactive oxygen species production and cytokine secretion. Although in vitro lymphocyte proliferation was not observed, CD3+ cells increased in the metastatic lungs. These results suggest GGH and GGHS as immunostimulatory agents, with GGH as potential melanoma adjuvant therapy.


Figures

1
1
GGH and GGHS characterization. (A) 1H NMR spectrum anomeric region of GGH with integration of area of each anomeric. (B) HPSEC-RI elution profile with estimated molar masses of each GGH and GGHS based on a dextran standard curve. (C, D) 1H/13C signals from 2D-NMR HSQC-Ed spectra of the polysaccharides GGH (C) and GGHS (D). Experiments were performed at 50 °C using a Bruker Avance 400 MHz instrument. The red signals mean inverted ones that correspond to −CH2 groups. The monosaccharide drawing structures were GGH and GGHS components, and the circles highlighted some nuclei that are being discussed in the text.
2
2
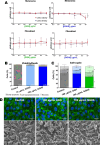
Influence of GGH and GGHS in vitro treatment on cells viability, death, cycle, and morphology. (A) B16–F10 melanoma cells and BALBc/3T3 fibroblasts,72 h treated with different concentrations of GGH or GGHS were assay for cell viability (neutral red uptake – red lines) and cell density (crystal violet staining – purple lines). Dashed line represents control. Each dot represents the mean of technical triplicate ± SD of four independent experiments. Data within each assay was analyzed by ordinary one-way ANOVA with Dunnett’s multiple comparison test (*p < 0.05). Data from GGH and GGHS groups are presented separately to enhance clarity and facilitate visualization. (B) Melanoma cells (B16–F10) treated for 72 h with 10 or 100 μg/mL GGHS were analyzed by flow cytometry using Annexin V and PI staining. Stacked bars represent mean with standard deviation, from four independent experiments. Ordinary one-way ANOVA with Dunnett’s multiple comparisons test was performed (p < 0.05). (C) Cell cycle determination of melanoma cells (B16–F10) treated for 72 h with 10 or 100 μg/mL GGHS by DNA staining (PI) and analyzed by flow cytometry. Stacked bars represent mean with standard deviation, from four independent experiments. Two-way ANOVA with Dunnett’s multiple comparisons test was performed (*p < 0.05). (D) Representative images of each group. Melanoma cells (B16–F10) were cultured on coverslips, exposed to 100 μg/mL GGH or GGHS for 72 h, fixed with 2% PFA, stained with DAPI (for the nuclei; blue color) and ActinGreen (for actin filaments; green color), and observed by confocal microscopy (upper row) or fixed with 2.5% glutaraldehyde, 1% osmium tetroxide, processed, and imaged by scanning electron microscopy (bottom row). Scale bar: 20 μm.
3
3
In vitro analysis of melanoma metastatic parameters. Melanoma cells (B16–F10) were treated with 100 μg/mL GGH or GGHS for 72 h. (A, B) Invasion assay on Matrigel-coated inserts was performed after B16–F10 cells pretreatment. (A) Nuclei number analyses per mm2 of the whole insert, normalized and relative to control group. Data are presented as box with min and max from three independent experiments. Group comparisons were performed using Ordinary one-way ANOVA with Dunnett’s multiple comparison test (*p < 0.05; **p < 0.01). (B) Representative images of each group. Nuclei were stained with DAPI (blue) and actin filaments stained with ActinGreen (green). Scale bar, 100 μm. (C) Analyses of cells adhesion to plastic or Matrigel. Each dot represents the mean of technical triplicates, of six independent experiments. Group comparisons were performed using Welch’s t test (*p < 0.05; **p < 0.01). (D) Representative images of each group. Melanoma cells (B16–F10) were cultured on Matrigel -coated coverslips, exposed to 100 μg/mL GGH or GGHS for 72 h, fixed with 2.5% glutaraldehyde, 1% osmium tetroxide, and processed and imaged by scanning electron microscopy. Scale bar - 100 μm. (E, F) Colony formation was analyzed after B16–F10 cells plating at low confluence (400 cells/well) and 96 h of treatment in the presence of 100 μg/mL GGH or GGHS, or without treatment (control). Data are presented as box with min and max from three independent experiments. (E) Colony numbers and (F) colony sizes were compared between groups using ordinary one-way ANOVA with Dunnett’s multiple comparison test (**p < 0.01). (A, C, and E) Dashed line represents normalized data from each respective control group.
4
4
Galectin-3 binding assay by QCM-D (quartz crystal microbalance with dissipation monitoring) analysis. GGH and GGHS (1000 μg/mL) were subjected to binding assays to galectin-3 that was bound to the balance sensor. Lactose (10 mg/mL) was used as a positive binding control. Graph displaying three measured adsorption time points (200, 600, and 1000 s).
5
5
Solid tumor progression and lung metastasis model analyses. (A) Tumor volume (mm3) over time (Control-PBS n = 15; 5 mg/kg GGH n = 11; 5 mg/kg GGHS n = 16, male mice). Two-way ANOVA with Dunnett’s multiple comparisons test was performed (**p < 0.01). Data are presented as mean with standard error of the mean. (B) Macroscopic images representative of tumor size from each group (scale bars - 5 mm). Representative histological sections from each group (scale bars -100 μm). White arrows indicate necrotic areas. (C) Percentage of metastatic foci summed from both lungs views (ventral and dorsal) (Control PBS n = 15; GGH 5 mg/kg n = 11; GGHS 5 mg/kg n = 16, male mice). Bars represent mean with standard deviation. Ordinary one-way ANOVA with Dunnett’s multiple comparisons test was performed (p < 0.05). (D) Representative images from lung ventral (first row) and dorsal (second row) views from each group (scale bars - 1 cm).
6
6
GGH and GGHS effects on lymphocytes and macrophages. (A) T-cell replication index (number of divided cells per number of cells that entered division). Histograms of 100 μg/mL GGH (green), 100 μg/mL GGHS (blue), and 5 μM Mitomycin (pink) treated cells compared to the control (RPMI 1640 medium–gray). (B, C) Ex vivo Reactive Oxygen Species (ROS) detection in peritoneal macrophages from tumor-bearing mice. (B) Percentage of cells in the population with a larger and more granular profile in each group. (C) Median fluorescence intensity (MFI) of the analyzed population was obtained using the DCF probe. (D) Quantification of cytokines released by peritoneal-derived macrophages. Statistical analyses were performed using ordinary one-way ANOVA with Dunnett’s multiple comparisons test (*p < 0.05; **p < 0.01; ***p < 0.001; ****p < 0.0001).
7
7
Tissue cytokine analysis and T-cell immunophenotyping of in vivo tumor-bearing treated mice. (A) Cytokines and (B) percentage of labeled T-lymphocytes within the tumor based on antibody profiling. (C) Cytokines and (D) percentage of labeled lymphocytes in lungs based on antibody profiling. (A–D) Data are presented as individual values with mean (n = 4). Statistical analysis was performed using the one-way ANOVA with Dunnett’s multiple comparisons test (*p < 0.05).

References

    1. Bray F., Laversanne M., Sung H., Ferlay J., Siegel R. L., Soerjomataram I., Jemal A.. Global Cancer Statistics 2022: GLOBOCAN Estimates of Incidence and Mortality Worldwide for 36 Cancers in 185 Countries. CA. Cancer J. Clin. 2024;74(3):229–263. doi: 10.3322/caac.21834. - DOI - PubMed
    1. Chen Y., Sumardika I. W., Tomonobu N., Winarsa Ruma I. M., Kinoshita R., Kondo E., Inoue Y., Sato H., Yamauchi A., Murata H., Yamamoto K., Tomida S., Shien K., Yamamoto H., Soh J., Liu M., Futami J., Sasai K., Katayama H., Kubo M., Putranto E. W., Hibino T., Sun B., Nishibori M., Toyooka S., Sakaguchi M.. Melanoma Cell Adhesion Molecule Is the Driving Force behind the Dissemination of Melanoma upon S100A8/A9 Binding in the Original Skin Lesion. Cancer Lett. 2019;452:178–190. doi: 10.1016/j.canlet.2019.03.023. - DOI - PubMed
    1. Krishnan V., Bane S. M., Kawle P. D., Naresh K. N., Kalraiya R. D.. Altered Melanoma Cell Surface Glycosylation Mediates Organ Specific Adhesion and Metastasis via Lectin Receptors on the Lung Vascular Endothelium. Clin. Exp. Metastasis. 2005;22(1):11–24. doi: 10.1007/s10585-005-2036-2. - DOI - PubMed
    1. Braeuer R. R., Watson I. R., Wu C., Mobley A. K., Kamiya T., Shoshan E., Bar-Eli M.. Why Is Melanoma so Metastatic? Pigment Cell Melanoma Res. 2014;27(1):19–36. doi: 10.1111/pcmr.12172. - DOI - PubMed
    1. Banh A., Zhang J., Cao H., Bouley D. M., Kwok S., Kong C., Giaccia A. J., Koong A. C., Le Q.-T.. Tumor Galectin-1 Mediates Tumor Growth and Metastasis through Regulation of T-Cell Apoptosis. Cancer Res. 2011;71(13):4423–4431. doi: 10.1158/0008-5472.CAN-10-4157. - DOI - PMC - PubMed