Comparative Study
. 2025 Aug 21;16(1):633.
doi: 10.1038/s41419-025-07940-2.

Comparative analysis of S100A10 and S100A11 in MASLD and hepatic cancer development revealed a tumor suppressive role for S100A10

Affiliations
Comparative Study

Comparative analysis of S100A10 and S100A11 in MASLD and hepatic cancer development revealed a tumor suppressive role for S100A10

Etienne Delangre et al. Cell Death Dis. .

Abstract

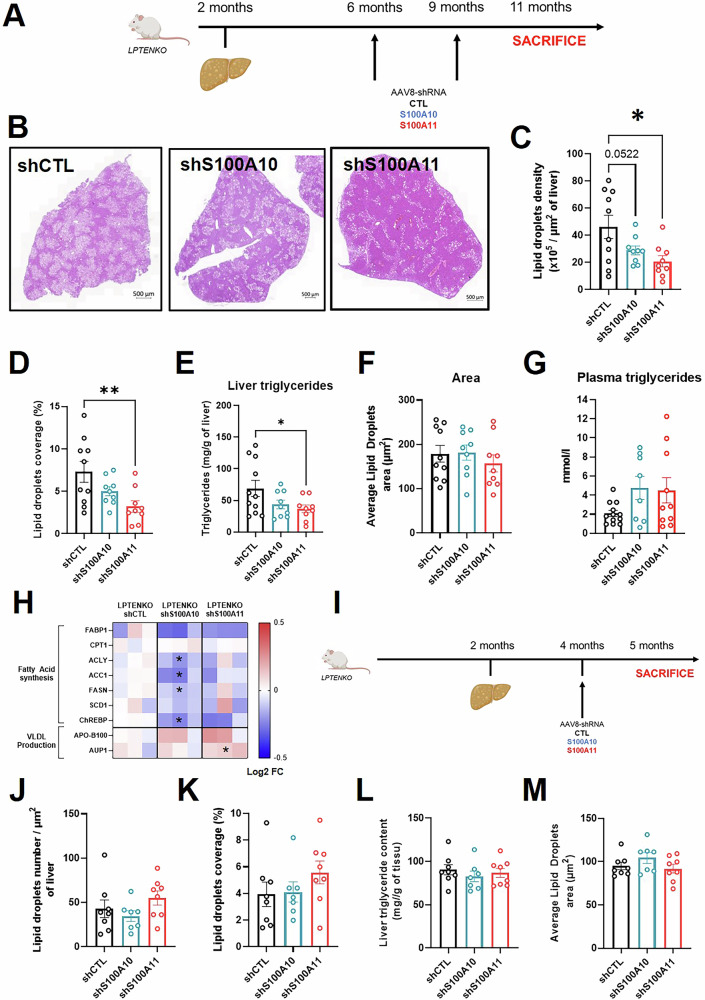
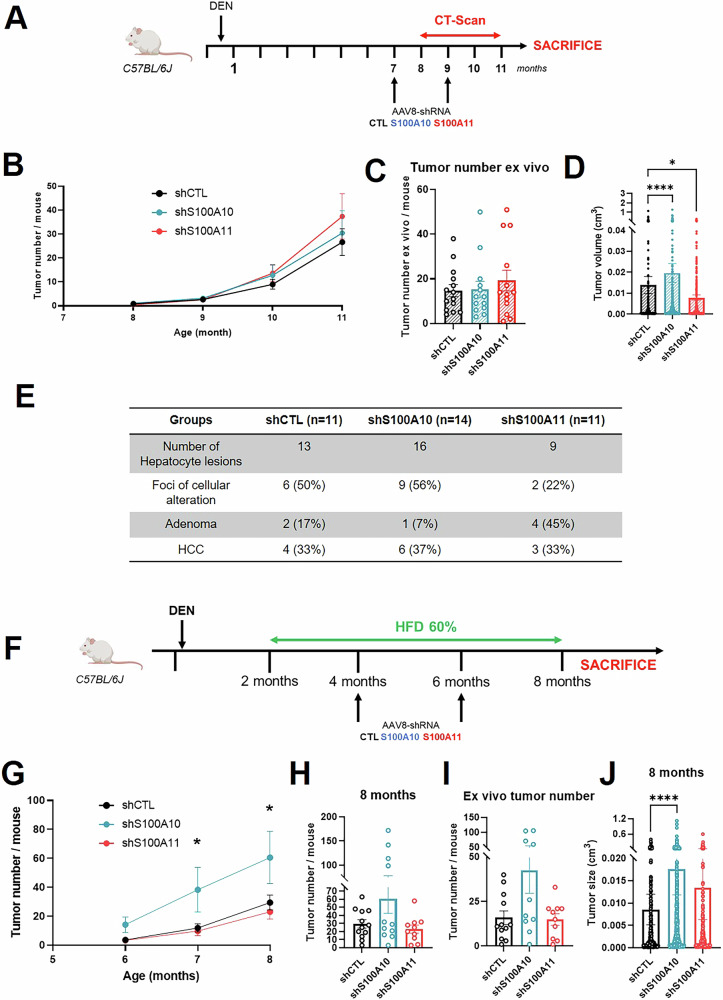
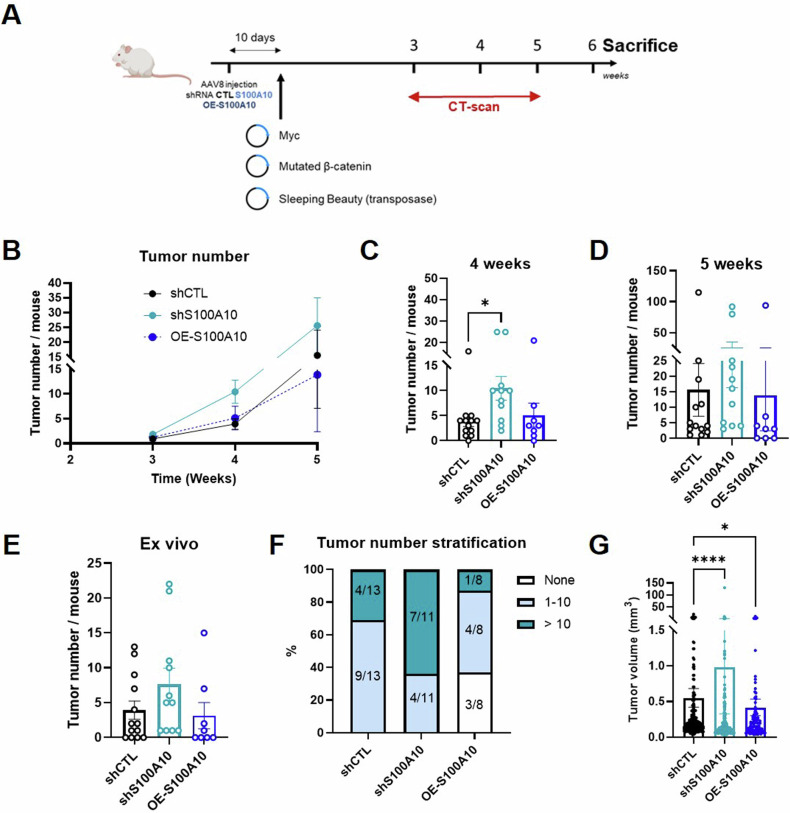
S100 proteins are significantly deregulated in hepatocellular carcinoma (HCC) and metabolic dysfunction-associated steatotic liver disease (MASLD). Here, we investigated the impact of hepatocyte downregulation of two closely-related members of the S100 family, S100A10 and S100A11, in complementary mouse models of MASLD and liver cancer. Hepatotropic AAV8 encoding shRNAs targeting S100A10 or S100A11 were used to downregulate these proteins specifically in the liver of mice fed a diet inducing hepatic steatosis, inflammation, and fibrosis and in a genetic mouse model of MASLD bearing hepatocyte-specific deletion of PTEN (LPTENKO). The impact of S100A10 or S100A11 downregulation on liver tumor development was further investigated in aged LPTENKO mice spontaneously developing MASLD-driven HCC and in diethylnitrosamine (DEN)-injected mice fed or not with high fat diet. Finally, the upregulation and downregulations of S100A10 were performed in mice harbouring the over-expression of Myc and constitutively activated β-catenin, two main events occurring in a sub-type of human HCC. Downregulation of S100A10 promoted hepatocarcinogenesis in a fatty liver setting, while reducing steatosis and fibrosis development. S100A11 knock-down consistently reduced MASLD and tumoral growth. However, in vivo S100A11 downregulation triggered concomitant partial loss of endogenous protective S100A10. Overexpression of S100A10 reduced the volume of tumors and might represent a therapeutic option. The results show that both S100A10 and S100A11 play active roles in the development of MASLD. However, these two closely associated proteins present opposite contributions to hepatic cancer, S100A10 being protective and S100A11 deleterious.


Conflict of interest statement

Competing interests: The authors declare no competing interests. Ethics approval and consent to participate: This study was approved by the Geneva Health Head Office (authorization number GE78) and was in accordance with the Swiss guidelines for animal experimentation.

Figures

Fig. 1
Fig. 1. Downregulation of S100A10 and S100A11 reduces MASH development induced by a Fructose Palmitate Cholesterol-enriched diet.
A Experimental design of the fructose/palmitate/cholesterol-enriched diet (FPC) protocol, including feeding period and AAV8 injections. B Liver triglyceride content measured by colorimetric method following Folch’s extraction of total lipids. C57BL/6J mice were injected with AAV8-shCTL (n = 10), AAV8-shS100A10 (n = 10), or AAV8-shS100A11 (n = 12) and fed during 10 weeks with FPC. C Automatic detection of lipid droplets numbers in the livers of C57BL/6J mice injected with AAV8-shCTL (n = 11), AAV8-shS100A10 (n = 11), or AAV8-shS100A11 (n = 12) and fed for 10 weeks with FPC. Results are normalized to total tissue area. D Automatic detection of individual lipid droplets size in the livers of C57BL/6J mice injected with AAV8-shCTL (n = 11), AAV8-shS100A10 (n = 11), or AAV8-shS100A11 (n = 12) and fed for 10 weeks with FPC. Results are expressed as the average lipid droplet size per mouse. E Representative images of Masson’s Trichrome coloration in the liver of C57BL/6J mice injected with AAV8-shCTL, AAV8-shS100A10, or AAV8-shS100A11 and fed for 24 weeks with FPC. Scale bar: 200 µm. F Automatic detection of collagen deposition extent based on Masson’s coloration in the liver of C57BL/6J mice injected with AAV8-shCTL (n = 9), AAV8-shS100A10 (n = 9), or AAV8-shS100A11 (n = 10) and fed for 24 weeks with FPC. Results are expressed as the percentage of Masson’s Trichrome positive area on the total area of the tissue. G Quantification of macrophages density measured by Iba1 immunohistochemistry in the liver of C57BL/6J mice injected with AAV8-shCTL (n = 9), AAV8-shS100A10 (n = 11), or AAV8-shS100A11 (n = 9) and fed during 10 weeks with FPC. Results are expressed as the percentage of Iba1+ area over the total tissue area. H Liver TNFα content measured by ELISA in C57BL/6J mice injected with AAV8-shCTL (n = 6), AAV8-shS100A10 (n = 6), or AAV8-shS100A11 (n = 7) and fed for 10 weeks with FPC. Results are presented as means +/− S.E.M. “n” represents the number of animals. * = p < 0.05; ** = p < 0.01; **** = p < 0.0001 determined by One-Way ANOVA followed by Dunnett’s post-hoc analysis.
Fig. 2
Fig. 2. Prolonged S100A10/A11 silencing shows a therapeutic benefit on steatosis in a genetic model of MASLD-driven liver cancer.
A Experimental design of the long-term LPTENKO protocol, including the spontaneous appearance of steatosis, AAV8 injections, and sacrifice. B Representative images of hematoxylin-eosin coloration in the livers of LPTENKO mice injected with AAV8-shCTL, AAV8-shS100A10, or AAV8-shS100A11 at 11 months of age. Scale bar: 500 µm. C Automatic detection of lipid droplets number in the liver of LPTENKO mice injected with AAV8-shCTL (n = 10), AAV8-shS100A10 (n = 9), or AAV8-shS100A11 (n = 9) at 11 months of age. Results are normalized to total tissue area. D Automatic detection of lipid droplets coverage in the liver of LPTENKO mice injected with AAV8-shCTL (n = 10), AAV8-shS100A10 (n = 9), or AAV8-shS100A11 (n = 9) at 11 months of age. Results are normalized to total tissue area. E Liver triglycerides content measured by colorimetric method following Folch’s extraction of total lipids. LPTENKO mice were injected with AAV8-shCTL (n = 11), AAV8-shS100A10 (n = 9), or AAV8-shS100A11 (n = 9) at 11 months old. F Automatic detection of lipid droplets size in the liver of LPTENKO mice injected with AAV8-shCTL (n = 10), AAV8-shS100A10 (n = 9), or AAV8-shS100A11 (n = 9) at 11 months of age. Results are expressed as the average of lipid droplets size per mouse. G Plasma triglycerides levels measured in LPTENKO mice injected with AAV8-shCTL (n = 12), AAV8-shS100A10 (n = 8), and AAV8-shS100A11 (n = 10) at 11 months-old. H Heatmap representation of proteomic analysis performed in the liver of LPTENKO injected with shCTL (n = 3), shS100A10 (n = 3), or shS100A11 (n = 3) for protein involved in fatty acid synthesis or VLDL production/export at 11 months of age. I Experimental design of the short-term LPTENKO protocol, including the spontaneous appearance of steatosis, AAV8 injection, and sacrifice. J Automatic detection of lipid droplet numbers in the liver of LPTENKO mice injected with AAV8-shCTL (n = 8), AAV8-shS100A10 (n = 7), or AAV8-shS100A11 (n = 8) at 5 months of age. Results are normalized to the total tissue area. K Automatic detection of lipid droplets coverage in the liver of LPTENKO mice injected with AAV8-shCTL (n = 8), AAV8-shS100A10 (n = 7), or AAV8-shS100A11 (n = 8) at 5 months of age. Results are normalized to total tissue area. L Liver triglycerides content measured by colorimetric method following Folch’s extraction of total lipids. LPTENKO mice were injected with AAV8-shCTL (n = 8), AAV8-shS100A10 (n = 7), or AAV8-shS100A11 (n = 8) at 5 months of age. M Automatic detection of lipid droplets size in the liver of LPTENKO injected with AAV8-shCTL (n = 8), AAV8-shS100A10 (n = 7), or AAV8-shS100A11 (n = 8), at 5 months of age. Results are expressed as the average lipid droplets size per mouse. Results are presented as means +/− S.E.M. “n” represents the number of animals. * = p < 0.05; ** = p < 0.01 determined by One-Way ANOVA followed by Dunnett’s post-hoc analysis (CG, JM) or by t-test (H).
Fig. 3
Fig. 3. Downregulation of S100A10 versus S100A11 trigger divergent outcomes on hepatocarcinogenesis in a MASLD-driven hepatic cancer model.
A MRI analysis of the tumor number per mouse in LPTENKO injected with AAV8-shCTL (n = 12–14), AAV8-shS100A10 (n = 9–13), or AAV8-shS100A11 (n = 11–13) at 8, 9, 10, and 11 months of age. B Representative 3D reconstruction of tumors in the liver of LPTENKO mice injected with AAV8-shCTL, AAV8-shS100A10, or AAV8-shS100A11 at 11 months of age. C Tumor count in the liver ex vivo, following dissection of the liver from LPTENKO mice injected with AAV8-shCTL (n = 11), AAV8-shS100A10 (n = 10), or AAV8-shS100A11 (n = 10) at 11 months of age. D Tumor volume measured by MRI analysis in LPTENKO mice injected with AAV8-shCTL (n = 149), AAV8-shS100A10 (n = 231), or AAV8-shS100A11 (n = 70) at 11 months of age. E CancerMine Classification of deregulated proteins shared between shS100A10 and shS100A11 group or exclusive to each group. ONC/D oncogenes/drivers, TS tumor suppressors, ▲ upregulated, ▼ downregulated. F Heatmap representation of proteomic analysis performed in the liver of 11 months-old LPTENKO injected with shCTL (n = 3), shS100A10 (n = 3), or shS100A11 (n = 3) for proteins involved in genome stability, cell cycle, cell death, hepatocyte differentiation, and the NF-kB pathway. Black crosses in white boxes represent non-detectable proteins in the sample. G Qualitative histopathological characterization of hepatocyte lesions (foci of cellular alteration, Adenoma or HCC) and biliary duct lesions (bile duct hyperplasia and cholangiocarcinoma) in 11 months LPTENKO-shCTL (n = 11), LPTENKO-shS100A10 (n = 9) or LPTENKO-shS100A11 (n = 9). Results are presented as means +/− S.E.M. “n” represents the number of animals or the number of tumors (D). * = p < 0.05; ** = p < 0.01; *** = p < 0.001; **** = p < 0.0001 determined by Two-Way ANOVA followed by Dunnett’s post-hoc analysis (A), by One-Way ANOVA followed by Dunnett’s post-hoc analysis (C), by Kruskall–Wallis test followed by Dunnett’s post-hoc analysis (D) or by t-test (F).
Fig. 4
Fig. 4. Downregulation of S100A10 versus S100A11 differently impact on tumoral initiation and growth, depending on the fatty liver context.
A Experimental design of the diethylnitrosamine (DEN) protocol, including AAV8 injections, CT-scan measurements, and sacrifice. B CT-scan analysis of the tumor number per mouse in DEN mice injected with AAV8-shCTL (n = 12), AAV8-shS100A10 (n = 14), or AAV8-shS100A11 (n = 13) at 8, 9, 10, and 11 months of age. C Tumor counting in the liver ex vivo, following dissection of the liver from DEN mice injected with AAV8-shCTL (n = 14), AAV8-shS100A10 (n = 13), or AAV8-shS100A11 (n = 13) at 11 months of age. D Tumor volume measured using CT-scan analysis in DEN mice injected with AAV8-shCTL (n = 346), AAV8-shS100A10 (n = 425), or AAV8-shS100A11 (n = 486) at 11 months of age. E Qualitative histopathological characterization of hepatocyte lesions (foci of cellular alteration, Adenoma or HCC) in DEN mice injected with AAV8-shCTL (n = 11), AAV8-shS100A10 (n = 14) or AAV8-shS100A11 (n = 11). F Experimental design of the HFD-DEN protocol, including AAV8 injections, feeding period with High Fat Diet and euthanasia. G MRI analysis of the tumor number per mouse in HFD-DEN mice injected with AAV8-shCTL (n = 12), AAV8-shS100A10 (n = 11–12), or AAV8-shS100A11 (n = 10–13) at 6, 7, and 8 months of age. H Tumor number per mouse at 8 months-old assessed by MRI analysis in HFD-DEN mice injected with AAV8-shCTL (n = 12), AAV8-shS100A10 (n = 11), or AAV8-shS100A11 (n = 10). I Tumor counting in the liver ex vivo, following dissection of liver from HFD-DEN mice injected with AAV8-shCTL (n = 12), AAV8-shS100A10 (n = 10), or AAV8-shS100A11 (n = 10), at 8 months of age. J Tumor volume measured using CT-scan analysis in DEN mice injected with AAV8-shCTL (n = 353), AAV8-shS100A10 (n = 664), or AAV8-shS100A11 (n = 230), at 11 months of age. Results are presented as means +/− S.E.M. “n” represents the number of animals or the number of tumors (D and J). * = p < 0.05; **** = p < 0.0001 determined by Two-Way ANOVA followed by Dunnett’s post-hoc analysis (B and G), by One-Way ANOVA followed by Dunnett’s post-hoc analysis (H, I), or by Kruskall–Wallis test followed by Dunnett’s post-hoc analysis (C, D, and J) or by t-test (Fig. 4G).
Fig. 5
Fig. 5. S100A10 upregulation in the liver reduces tumoral burden in the mouse model mimicking human β-catenin mutated subtype of HCC.
A Experimental design, including AAV8 injections, hydrodynamic injections of plasmids encoding human form of Myc, human constitutively active β-catenin and SB transposase, CT-scan measurements and the sacrifice. B CT-scan analysis of tumor number per mouse in Myc/mutated β-catenin overexpression mouse model injected with AAV8-shCTL (n = 13), AAV8-shS100A10 (n = 11), or AAV8-OE-S100A10 (n = 8) at 3, 4, and 5 weeks post-hydrodynamic injection. C CT-scan analysis of tumor number per mice in Myc/mutated β-catenin overexpression mouse model injected with AAV8-shCTL (n = 13), AAV8-shS100A10 (n = 11), or AAV8-OE-S100A10 (n = 8) 4 weeks after hydrodynamic injection. D CT-scan analysis of tumor number per mouse in Myc/mutated β-catenin overexpression mouse model injected with AAV8-shCTL (n = 13), AAV8-shS100A10 (n = 11), or AAV8-OE-S100A10 (n = 8) 5 weeks after hydrodynamic injection. E Tumor counting in the liver ex vivo, following dissection of Myc/mutated β-catenin overexpression mouse model injected with AAV8-shCTL (n = 13), AAV8-shS100A10 (n = 11) or AAV8-OE-S100A10 (n = 8) 6 weeks after hydrodynamic injection. F Tumor number stratification in Myc / mutated β-catenin overexpression mouse model injected with AAV8-shCTL (n = 13), AAV8-shS100A10 (n = 11) or AAV8-OE-S100A10 (n = 8), analyzed 5 weeks after hydrodynamic injection. G Tumor volume measured by CT-scan analysis in Myc/mutated β-catenin overexpression mouse model injected with AAV8-shCTL (n = 200), AAV8-shS100A10 (n = 201), or AAV8-OE-S100A10 (n = 111) 5 weeks after hydrodynamic injection. Results are presented as means +/− S.E.M. “n” represents the number of animals or the number of tumors (F). * = p < 0.05; **** = p < 0.0001 determined by Two-Way ANOVA followed by Dunnett’s post-hoc analysis (B), by One-Way ANOVA followed by Dunnett’s post-hoc analysis (D and E), or by Kruskall–Wallis test followed by Dunnett’s post-hoc analysis (C and G).
Fig. 6
Fig. 6. Long-term S100A10 protein stability in the liver depends on the presence of S100A11 in vivo.
A Relative protein level of S100A10 measured by western-blot in the liver of 5 months-old LPTENKO injected at 4 months with AAV8-shCTL (n = 8), AAV8-shS100A10 (n = 7), or AAV8-shS100A11 (n = 7). Tubulin was used as housekeeping protein. Results are expressed as fold change versus the shCTL group. B Relative mRNA level of S100A10 measured by qPCR in the liver of 5 months-old LPTENKO injected at 4 months with AAV8-shCTL (n = 8), AAV8-shS100A10 (n = 7), or AAV8-shS100A11 (n = 7). Cyclophilin A was used as housekeeping gene. Results are expressed as fold-change versus the shCTL group. C Scoring of S100A10 immunohistochemistry performed on liver TMA from HCC patients comparing HCC (n = 92, two per patient) and adjacent non-tumoral tissue (n = 46, one per patient). Results are expressed as the percentage of low, medium, or high intensity of the staining. D Scoring of S100A10 immunohistochemistry performed on liver TMA from HCC patients comparing the staining intensity in the tumoral compartment versus the non-tumoral part for every patient. Results are expressed as the percentage of decreased (red), unchanged (white), or increased (green) staining intensity in the tumor in comparison to the non-tumoral liver. E Representative images of S100A10 staining (brown) in adjacent non-tumoral liver (left) and in HCC (right). Nuclei are counterstained with hematoxylin. Scale bar: 50 µm. F Scoring of S100A11 immunohistochemistry performed on liver TMA from HCC patients comparing HCC (n = 92, two per patient) and adjacent non-tumoral tissue (n = 46, one per patient). Results are expressed as the percentage of low, medium, or high intensity of the staining. G Scoring of S100A11 immunohistochemistry performed on liver TMA from HCC patients comparing the staining intensity in the tumoral compartment versus the non-tumoral part for every patient. Results are expressed as the percentage of decreased (red), unchanged (white), or increased (green) staining intensity in the tumor in comparison to the non-tumoral liver. H Representative images of S100A11 staining (brown) in adjacent non-tumoral liver (left) and in HCC (right). Nuclei are counterstained with hemalum. Scale bar: 50 µm. I Western blot analysis of S100A10 and S100A11 following FLAG immunoprecipitation of the cell lysates from Huh7 cells transfected with S100A10-FLAG (upper panel) or S100A11-FLAG (lower panel). Results are presented as means +/− S.E.M. “n” represents the number of animals (A, B, and J), the number of human liver biopsies (C, D, F, and G). * = p < 0.05; ** = p < 0.01; *** = p < 0.001 determined by One-Way ANOVA followed by Dunnett’s post-hoc analysis (A, B).

References

    1. EASL-EASD-EASO. Clinical practice guidelines on the management of metabolic dysfunction-associated steatotic liver disease (MASLD). J Hepatol. 2024;81:492–542. - PubMed
    1. Younossi ZM. Non-alcoholic fatty liver disease - A global public health perspective. J Hepatol. 2019;70:531–44. - PubMed
    1. Sung H, Ferlay J, Siegel RL, Laversanne M, Soerjomataram I, Jemal A, et al. Global cancer statistics 2020: GLOBOCAN estimates of incidence and mortality worldwide for 36 cancers in 185 countries. CA Cancer J Clin. 2021;71:209–49. - PubMed
    1. Donato R, Cannon BR, Sorci G, Riuzzi F, Hsu K, Weber DJ, et al. Functions of S100 proteins. Curr Mol Med. 2013;13:24–57. - PMC - PubMed
    1. Bresnick AR, Weber DJ, Zimmer DB. S100 proteins in cancer. Nat Rev Cancer. 2015;15:96–109. - PMC - PubMed

Publication types

MeSH terms

Grants and funding