. 2025 Aug 21;10(1):269.
doi: 10.1038/s41392-025-02350-4.

Piezo1-mediated mechanotransduction regulates the translational activity, function and lung pathogenicity of group 2 innate lymphoid cells

Affiliations

Piezo1-mediated mechanotransduction regulates the translational activity, function and lung pathogenicity of group 2 innate lymphoid cells

MinYeong Lim et al. Signal Transduct Target Ther. .

Abstract

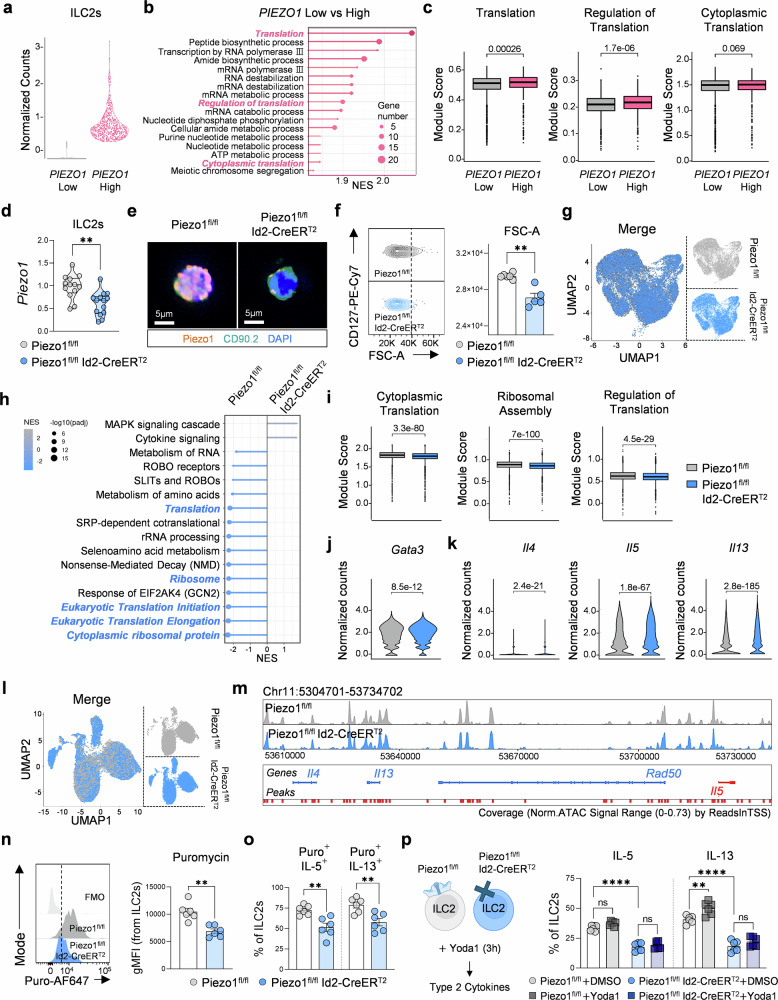
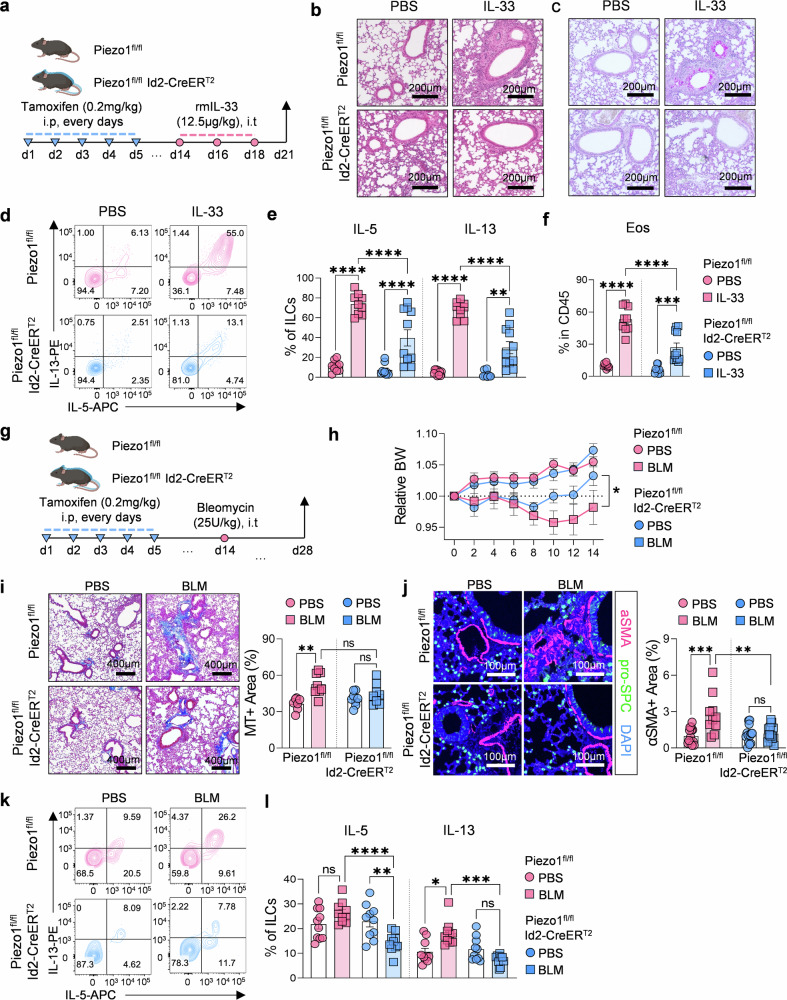
Group 2 innate lymphoid cells (ILC2s) are central effectors of type 2 immune responses in the lung; however, how mechanical cues regulate their function remains unclear. Here, we identified the mechanosensitive ion channel Piezo1 as a key regulator of ILC2 effector function through translational control. Piezo1 is highly expressed in murine and human ILC2s, and its activation by mechanical stress or the Piezo1 agonist, Yoda1 induces calcium influx, triggering mTOR signaling and selectively enhancing IL-13 protein production. Conditional deletion of Piezo1 in ILC2s reduced mTOR activation and puromycin incorporation, leading to impaired protein synthesis and attenuated lung inflammation and fibrosis in the IL-33, Alternaria alternata, and bleomycin models. scRNA-seq and scATAC-seq confirmed that Piezo1-deficient ILC2s retained Il13 transcription and chromatin accessibility but presented translational suppression, as evidenced by protein‒mRNA interactions. Pharmacologic mTOR inhibition phenocopied Piezo1 loss, supporting the functional relevance of the Piezo1-mTOR axis. These findings demonstrate that Piezo1 functions as a mechanosensor that integrates biomechanical cues to regulate cytokine output via mTOR-mediated translation. Targeting Piezo1 signaling or its downstream effectors may provide therapeutic benefits in type 2 inflammation-associated lung diseases.


Conflict of interest statement

Competing interests: The authors declare no competing interests.

Figures

Fig. 1
Fig. 1
Expression and functional characterization of the mechanosensitive ion channel Piezo1 in ILC2s. a Gene expression of mechanosensitive ion channels across ILC subsets from the ImmGen database. b Expression of Piezo1 in tissue-resident ILC2s from published bulk RNA-seq datasets (Roberto et al.). c Piezo1 mRNA expression in ILC2s stimulated with IL-25, IL-33, or TSLP (n = 9). d Representative immunofluorescence images showing Piezo1 localization in alarmin-stimulated ILC2s (Piezo1: magenta, CD90.2: green, and Hoechst; scale bars = 5 µm). e Representative traces and quantification of Yoda1-induced membrane currents in ILC2s at –80 mV; currents were abolished in NMDG-Cl bath solution (n = 26). f Live-cell calcium imaging before and after Yoda1 stimulation (±BAPTA) via CAL-520 AM (n = 68–98) (scale bars = 50 µm). g Schematic of the cyclic air pressure (CAP) chamber and flow cytometry analysis of type 2 cytokine production in ILC2s under static vs. CAP conditions (n = 7). h Schematic of ILC2 culture on PDMS hydrogels (2 kPa and 50 kPa) or plastic plates and flow cytometry analysis of type 2 cytokine production in PDMS- or plastic-cultured ILC2s (n = 8). i Intracellular IL-5 and IL-13 levels in ILC2s stimulated with Yoda1 and/or the Piezo1 inhibitor GsMTx4 (n = 7). j Validation of Piezo1 mRNA knockdown by siRNA in ILC2s (n = 10-14). k Representative immunofluorescence images of Piezo1 expression following siRNA transfection. (Piezo1: magenta, CD90.2: green, and Hoechst, Scale bars = 5 µm). l Intracellular IL-5 and IL-13 levels in siRNA-treated ILC2s stimulated with ± Yoda1 (n = 8). PIEZO1 expression across immune cell subsets from public human fetal lung scRNA-seq datasets by He. (m) and Barnes et al. (n). o Representative images of Piezo1 immunofluorescence in human peripheral blood–derived ILC2s. (Piezo1: orange, CD161: green, ST2: white, and DAPI, Scale bars = 10 µm). p Representative flow cytometry plots showing IL-5⁺ and IL-13⁺ human ILC2s with or without Yoda1 stimulation. q Quantification of IL-5⁺ and IL-13⁺ in human ILC2s (n = 12). Statistical significance was determined via the Mann–Whitney U test, one-way ANOVA, two-way ANOVA, or paired t test, as appropriate. The data are representative of or pooled from at least two or three independent experiments and are presented as the means ± SEMs. **P < 0.01, ***P < 0.001, ****P < 0.0001; ns, not significant
Fig. 2
Fig. 2
Piezo1 promotes IL-13 translation in ILC2s. a Principal component analysis (PCA) of bulk RNA-seq data comparing the transcriptomes of Yoda1- and DMSO-treated ILC2s (n = 4). b Differential expression of type 2 cytokine-associated genes in Yoda1-treated ILC2s. c Gene set enrichment analysis (GSEA) identifying pathways related to translation and mRNA stability enriched in Yoda1-treated ILC2s. d Schematic of type 2 cytokine gene loci and their transcriptional regulation by Gata3 and role of actinomycin D (ActD) and cycloheximide (CHX). e qPCR analysis of Il4, Il5, Il13, Gata3, and Rad50 in ILC2s treated with DMSO (control), Yoda1 or PMA+ionomycin (P.I.) (n = 6–15). f mRNA decay curves following ActD treatment with or without Yoda1, showing increased Il13 mRNA stability (n = 11); half-lives were calculated via a one-phase decay model. g Representative IL-13 and IL-5 protein levels in ILC2s treated with DMSO or Yoda1 ± ActD or CHX determined via ELISA (n = 4). h Schematic of the puromycin incorporation assay used to measure active translation. i Representative plots and quantification of puromycin+ ILC2s ± Yoda1 measured via flow cytometry (n = 9). j Schematic of cytokine transcription and translation phenotyping, with mRNA (x-axis, qPCR) and protein (y-axis, ELISA) ratios used to compare Yoda1 to DMSO. k Representative transcription and translation profiles of IL-4, IL-5, and IL-13 in ILC2s stimulated with DMSO or Yoda1 (n = 3). Statistical significance was determined via the Mann–Whitney U test, two-way ANOVA, or one-phase decay test for calculating the mRNA half-life, as appropriate. The data are representative of or pooled from at least two or three independent experiments and are presented as the mean ± SEM. **P < 0.01, ***P < 0.001, ****P < 0.0001
Fig. 3
Fig. 3
Piezo1 signaling drives translational reprogramming via mTOR in ILC2s. a Western blot analysis of YAP/TAZ and CaMKII (α, β, γ) expression in the small intestine (S), heart (H), muscle (M), lung (L), and lung-derived ILC2s. b Bulk RNA-seq data showing normalized expression (log₂) of mechanotransduction-related genes (Camk2a, Camk2b, Camk2g, Yap1, Taz, and Gata3) in DMSO- and Yoda1- treated ILC2s. c Phosphorylation levels of AKT, ERK1/2, and p65 and protein expression of NFAT in DMSO- or Yoda1-treated ILC2s (n = 6). d Schematic overview of Piezo1-mediated activation of mTOR signaling. e Western blot analysis of phosphorylated mTOR (Ser2448), P70S6K (Thr389), and 4E-BP1 (Thr37/46) after Yoda1 stimulation (n = 8–10). f Flow cytometry plots and quantification of phosphorylated S6 (p-S6) in DMSO- or Yoda1-treated ILC2s (n = 8). g Western blot and quantification of p-mTOR and p-P70S6K in DMSO-, Yoda1-, or Yoda1 + BAPTA-treated ILC2s (n = 6–8). h Flow cytometry analysis of puromycin incorporation in ILC2s under the same treatment conditions (n = 5). i, j Representative PrimeFlow™ cytometry analysis showing the mRNA and protein expression of IL-5 (top) and IL-13 (bottom) in DMSO-, Yoda1-, or Yoda1 + BAPTA-treated ILC2s (n = 4). k Immunofluorescence images of intracellular IL-13 and IL-5 expression in ILC2s (IL-5: magenta, IL-13: green, ER: white, and Hoechst; scale bars = 5 µm). l Flow cytometric analysis of p-mTOR and p-S6 in control (siCtrl) and Piezo1-knockdown (siPiezo1) ILC2s after DMSO or Yoda1 treatment (n = 8). m Frequencies of puromycin⁺ ILC2s and IL-5⁺ or IL-13⁺ puromycin⁺ ILC2s in control and Piezo1-knockdown ILC2s (n = 7). Statistical significance was determined via the Mann–Whitney U test, one-way ANOVA, or two-way ANOVA, as appropriate. The data are presented as the means ± SEMs and are pooled from two to three independent experiments or are representative of similar results. *P < 0.05, **P < 0.01, ***P < 0.001, ****P < 0.0001; ns, not significant
Fig. 4
Fig. 4
Piezo1 deletion impairs ILC2 functionality and translation activity. (ac) scRNA-seq analysis of human lung ILC2s stratified by PIEZO1 expression. a Violin plot showing the distribution of PIEZO1 expression. b GSEA identifying enrichment of translation-related pathways in PIEZO1high vs. PIEZO1low ILC2s. c Module scores for translation-associated gene sets. d qPCR analysis of Piezo1 mRNA levels in lung ILC2s from Piezo1fl/fl and Piezo1fl/fl Id2-CreERT2 mice (n = 13–14). e Representative immunofluorescence images showing Piezo1 and CD90.2 expression in lung ILC2s. (Piezo1: orange, CD90.2: green, and DAPI, scale bars = 5 µm), f Representative flow cytometry plots and quantification of the forward scatter area (FSC-A) in ILC2s (n = 5). g UMAP projection of scRNA-seq profiles comparing Piezo1fl/fl (gray) and Piezo1fl/fl Id2-CreERT2 (blue) ILC2s. GSEA (h) and module score analysis (i) revealing reduced translation and ribosomal biogenesis in Piezo1-deficient ILC2s. j, k Violin plots showing normalized gene expression of Gata3, Il4, Il5, and Il13 in Piezo1fl/fl and Piezo1fl/fl Id2-CreERT2 ILC2s from scRNA-seq. l UMAP projection of scATAC-seq profiles from Piezo1fl/fl and Piezo1fl/fl Id2-CreERT2 ILC2s. m Chromatin accessibility tracks at the Il4, Il5, Il13, and Rad50 loci in Piezo1fl/fl (gray) and Piezo1fl/fl Id2-CreERT2 (blue) ILC2s. n, o Flow cytometry analysis showing the frequencies of puromycin⁺ ILC2s (n) and IL-5⁺- and IL-13⁺- ILC2s (o) in Piezo1fl/fl and Piezo1fl/fl Id2-CreERT2 mice (n = 6). p Schematic and flow cytometry plots showing IL-5⁺ and IL-13⁺ ILC2s in Piezo1fl/fl and Piezo1fl/fl Id2-CreERT2 mice following Yoda1 or DMSO vehicle treatment (n = 6). Statistical significance was determined via the Mann–Whitney U test, one-way ANOVA, or two-way ANOVA. The data are presented as the means ± SEMs and are representative of or pooled from two or more independent experiments. **P < 0.01, ****P < 0.0001; ns, not significant
Fig. 5
Fig. 5
Conditional deletion of Piezo1 in ILC2s reduces acute airway inflammation and chronic lung fibrosis. a Schematic of the tamoxifen-inducible Piezo1fl/fl and Piezo1fl/fl Id2-CreERT2 (cKO) mouse model and the IL-33–induced acute lung inflammation protocol. Representative H&E (b) and PAS (c) images of lung sections from Piezo1fl/fl and cKO mice following IL-33 treatment. (scale bars = 200 µm), d Representative flow cytometry plots of IL-5⁺ and IL-13⁺ lung ILC2s. e Quantification of IL-5⁺ and IL-13⁺ ILC2s (n = 9–11). f Frequencies of lung eosinophils after IL-33 administration (n = 9–11). g Schematic of the bleomycin (BLM)-induced lung fibrosis model in Piezo1fl/fl and cKO mice. h Body weight changes over the course of fibrosis (n = 9–12). i Representative Masson’s trichrome (MT) staining and quantification of the fibrotic area in lung tissue (n = 7–8) (scale bars = 400 µm). j Representative image of α-SMA immunofluorescence staining (magenta) costained with pro-SPC (green) and DAPI (blue) (scale bars = 100 µm) and quantification of the α-SMA⁺ area (n = 10–14). Representative flow cytometry plots (k) and quantification (l) of IL-5⁺ and IL-13⁺ ILC2s in lung tissue from Piezo1fl/fl and cKO mice following BLM exposure (n = 11–13). Statistical significance was determined via one-way ANOVA or two-way ANOVA, as appropriate. The data are presented as the means ± SEMs and were pooled from at least two independent experiments. *P < 0.05, **P < 0.01, ***P < 0.001, ****P < 0.0001; ns, not significant
Fig. 6
Fig. 6
mTOR inhibition by rapamycin suppresses ILC2 translation and attenuates lung inflammation and fibrosis. a Schematic of the IL-33–induced airway inflammation model with intraperitoneal rapamycin administration (0.2 mg/kg, every 2 days). b Representative H&E and PAS staining of lung tissues from PBS-, IL-33–, and IL-33 + rapamycin (Rapa)-treated mice. (scale bars = 100 µm). c Frequencies of eosinophils among CD45⁺ lung cells (n = 7–8). d Representative histograms and quantification of puromycin⁺ (translating) ILC2s (n = 7–8). e Frequencies of IL-5⁺ and IL-13⁺ puromycin⁺ ILC2s (n = 7–8). f Concentrations of IL-5 and IL-13 in lung homogenates measured by ELISA (n = 8). g Schematic of the bleomycin (BLM)-induced lung fibrosis model with rapamycin treatment. h Representative H&E- and Masson’s trichrome-stained lung sections showing fibrotic areas. (scale bars = 200 µm). i Representative α-SMA immunofluorescence staining (magenta) costained with pro-SPC (green) and DAPI (blue) (scale bars = 100 µm). j Time course of relative body weight changes following BLM and rapamycin treatment (n = 8). k Representative histograms and quantification of puromycin⁺ ILC2s in fibrotic lungs (n = 8). l Frequencies of IL-5⁺ and IL-13⁺ puromycin⁺ ILC2s (n = 7–8). m Concentrations of IL-5 and IL-13 in lung homogenates from BLM-treated mice (n = 7). Public mouse lung scRNA-seq datasets showing that Piezo1high ILC2s exhibit elevated translation-associated gene expression (n) and higher module scores for translation-related pathways (o) than docompared to Piezo1low ILC2s. Statistical significance was determined via one-way ANOVA or two-way ANOVA, as appropriate. The data are presented as the means ± SEMs and were pooled from at least two independent experiments. *P < 0.05, **P < 0.01, ***P < 0.001, ****P < 0.0001; ns, not significant

References

    1. Whitsett, J. A. & Alenghat, T. Respiratory epithelial cells orchestrate pulmonary innate immunity. Nat. Immunol.16, 27–35 (2015). - PMC - PubMed
    1. Combs, M. P. & Dickson, R. P. Turning the Lungs Inside Out: The Intersecting Microbiomes of the Lungs and the Built Environment. Am. J. Respir. Crit. Care Med.202, 1618–1620 (2020). - PMC - PubMed
    1. Di, X. et al. Cellular mechanotransduction in health and diseases: from molecular mechanism to therapeutic targets. Signal Transduct. Target Ther.8, 282 (2023). - PMC - PubMed
    1. Ingber, D. E. Cellular mechanotransduction: putting all the pieces together again. FASEB J.20, 811–827 (2006). - PubMed
    1. Gudipaty, S. A. et al. Mechanical stretch triggers rapid epithelial cell division through Piezo1. Nature543, 118–121 (2017). - PMC - PubMed

MeSH terms

LinkOut - more resources