

doi: 10.1038/s41593-025-02037-7.
Epub 2025 Aug 21.
Stable cortical body maps before and after arm amputation
Affiliations
- PMID: 40841477
- PMCID: PMC12477700
- DOI: 10.1038/s41593-025-02037-7
Item in Clipboard
Stable cortical body maps before and after arm amputation
Nat Neurosci.
2025 Oct.
Abstract
The adult brain's capacity for cortical reorganization remains debated. Using longitudinal neuroimaging in three adults, followed before and up to 5 years after arm amputation, we compared cortical activity elicited by movement of the hand (before amputation) versus phantom hand (after amputation) and lips (before and after amputation). We observed stable cortical representations of both hand and lips in primary sensorimotor regions. By directly quantifying activity changes across amputation, we demonstrate that amputation does not trigger large-scale cortical reorganization.
© 2025. The Author(s).
Conflict of interest statement
Competing interests: The authors declare no competing interests.
Figures

a, Experimental timeline. Scans before and after amputation were conducted across 4–5 time points: twice before, and at 3 months, 6 months and 1.5 (P1)/5 years (P2) after amputation. b, Illustration depicting the three participants 6 months after amputation, including their subjective description of their phantom limb position. c, Phantom movements are not imaginary. Univariate activity (z-scored) contrast map displaying a participant’s attempts to open and close the phantom hand versus imagining movement, 6 months after amputation. d, Participant’s hand (red) and lip (blue) cortical activation maps (contrasted against feet movements) in the affected hand hemisphere across 4–5 sessions. All maps were minimally thresholded at 33% the maximum z-statistic and used a common color scale (the participant’s maximum z-statistic > 4.5). Participants agreed to have their image reproduced. Brain illustrations in a were created in BioRender .

a, Longitudinal hand and individual finger activity (versus rest) projected across the S1 (BA3b) region of interest (ROI) segmented into 49 segments of similar height. The affected hand’s activity over five sessions (indicated in the legend) for each of the case study participants who underwent an amputation is shown; the bottom row shows the finger COG shifts before and after amputation. The black lines reflect the activity before amputation, the yellow, orange and red lines after amputation. The COG shifts of the case study participants (red) for the hand and individual fingers fell within the distribution of Ctrls (gray; six comparisons per participant; two-tailed Crawford t-test: P1 (6 months): 0.14 ≤ Puncorr ≤ 0.58; P2 (6 months): 0.06 ≤ Puncorr ≤ 0.81; P3 (6 months): 0.10 ≤ Puncorr ≤ 0.91). Positive values indicate medial shifts (toward the feet); negative values indicate lateral shifts (toward the lips) in S1. Ctrl 95% percentile interval data are shown as gray violin plots. P1 data are shown as a red triangle. P2 data are shown as a red square. P3 data are shown as a red star. For simplicity, the Ctrl values are all for the left (nondominant) hand. b, Before and after amputation single-finger multivoxel correlations: for each finger of the case study participants, voxelwise activity correlations before and at the final scan after amputation are shown. All other correlations are comprehensively reported in Extended Data Fig. 5. The before to after amputation correlations for all participants were statistically significant (five two-tailed Pearson correlations per participant; P1 (6 months): 0.68 ≤ r ≤ 0.90, Puncorr < 0.001; P2 (6 months): 0.80 ≤ r ≤ 0.85, Puncorr < 0.001; P3 (6 months): 0.88 ≤ r ≤ 0.91, Puncorr < 0.001). c, Finger selectivity maps before and after amputation. Each contrast map reflects the selective activity for each finger (versus all others), masked to the hand ROI. Each mask was minimally thresholded at 33% the maximum z-statistic and binarized. Color codes are indicated on the right. To visualize the multi-finger activity at a single voxel, a 70% opacity filter was applied to all finger maps. d, Left, Graphic illustration of multivoxel analyses using a linear SVM decoder. Right, Longitudinal classifier performance. The line colors denote training-testing cross-validation session pairs, respectively, as indicated in the legend. The gray-shaded area reflects the data of able-bodied Ctrls before and after (6 months) (95% percentile interval). Training the classifier on the pre-amputation data and testing it on the post-amputation data (and vice versa) revealed significantly above chance classification accuracies for all case study participants at all post-amputation sessions (two-tailed, one-sample t-test: P1: before 1.5 years: 89%; P < 0.001; P2: before 5 years: 67%; P < 0.001; P3: before 6 months: 88%; P < 0.001). All other annotations are depicted in Fig. 1.
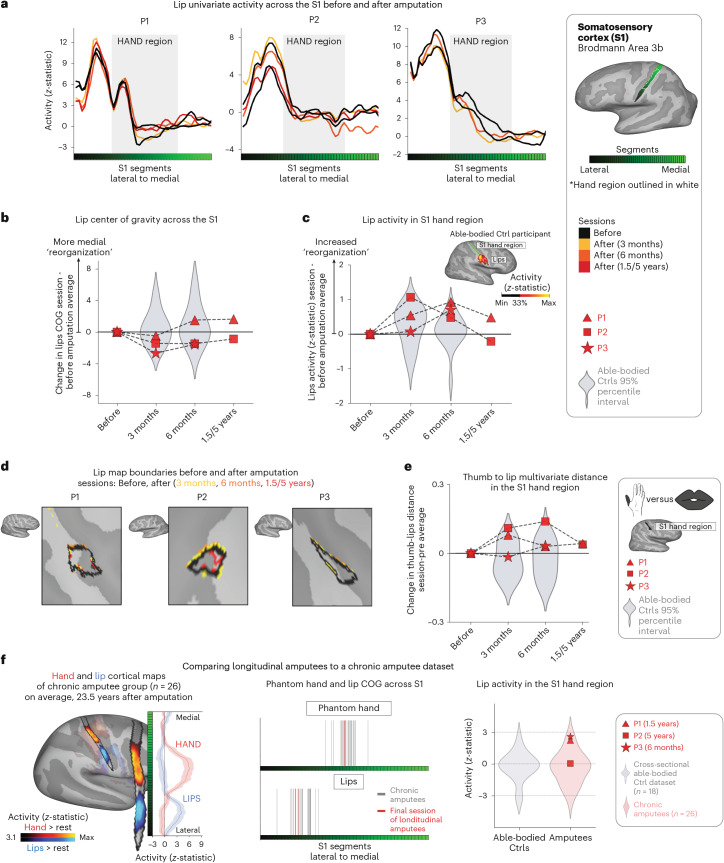
a, The lip activity (versus rest) of each case study participant for their sessions projected across the S1 ROI. The black lines reflect pre-amputation activity, with the yellow (3 months), orange (6 months) and red (1.5/5 years) lines reflecting activity after amputation. The gray region depicts the approximated coverage of the hand portion in the S1. b, All case study participants showed typical longitudinal variability at their 6-month scan, relative to Ctrls, for the lip COG. Positive values reflect medial shifts (toward the hand). c, All case study participants showed typical lip activity in the S1 hand region at the final scan. The right corner depicts representative Ctrl participant activity for the lips (versus the feet) minimally thresholded at 33% the maximum z-statistic. d, All case study participants exhibited no expansion of the lip map boundaries toward the hand region. Maps were masked to the S1 ROI and were minimally thresholded (z > 4.5). e, All case study participants showed stable thumb-to-lip multivariate Mahalanobis distances cross-validated at their final scan, relative to Ctrls. f, Comparing the case study participants to a chronic amputee dataset (n = 26). Left, Chronic amputee’s group-level cortical activation maps of the phantom hand and lips (versus rest) projected onto a single hemisphere (minimally thresholded at z > 3.1). Opacity was applied to activity outside the S1 ROI. Group univariate activity was plotted as a line (group mean ± s.e.) for the phantom hand (red) and lips (blue) across the S1 ROI. Middle, All case study participants, relative to chronic amputees, showed a typical COG for both the phantom hand (top) and lips (bottom). Right, All case study participants exhibited typical lip activity in the S1 hand region during their final session, which is consistent with chronic amputees. The magnitude of lip activity (95% percentile interval) in the S1 hand region for a secondary able-bodied Ctrl group (n = 18) is shown in gray. Chronic amputees are shown in light red and the last session data for the case study participants are shown in dark red. All other annotations are the same as described in Fig. 2.

(a) Affected hand sensations before and after amputation. Finger vividness and motor control for the phantom fingers, relative to the pre-amputated fingers. Kinesthetic vividness rated on a scale from 0 (no sensation) to 100 (as vivid as the unaffected hand) with color intensity indicating level. Movement difficulty rated from 100 (as easy as the unimpaired hand) to 0 (extremely difficult). Finger colors: red=D1, yellow=D2, green=D3, blue=D4, purple=D5 (palm excluded). (b) Before and after amputation, participants reported intensity values for each pain descriptive word, broadly categorized into sensations that are mechanical, temperature-related and other. For each word, participants were asked to describe the intensity between 0 (non-existing) to 100 (excruciating pain) as it relates to that particular word. A value of 100 (Max) is the largest radii on the polar plot. 3 M=3months post-amputation; 6 M=6months post-amputation. 1.5/5 yrs=1.5 or 5 years post-amputation.

Across all panels, we only report statistics when significant. Case-study participants showed similar responses to able-bodied controls in the baseline (pre-amputation) S1 center of gravity for the (a) hand and (b) lips. (c) All case-study participants had similar average intra-finger correlations between the two pre-sessions as controls. For baseline average inter-finger (d) classification accuracy and (e) distances. One case-study participant exhibited lower values for their affected hand only, relative to controls [Crawford t-test: decoding and distances: P2: p < 0.001] (f) All case-study participants had similar hand typicality between the two pre-sessions as controls. All other annotations the same as described in Figs. 2 and 3.

(a) Hand and finger univariate activity across M1 before and after amputation. When testing the stability of the whole hand condition across sessions, all case-studies fell within the distribution of controls at all timepoints. (b) When correlating voxel wise finger activity across sessions, all case-studies exhibiting similar correlation coefficients as controls, for all fingers. Please refer to the Extended Data Fig. 5 caption for a more detailed understanding of the correlation analysis. (c) Inter-finger representational structure across sessions, measured using cross-nobis distances (left) and decoding accuracies (right). First, when assessing for atypicality in our case-studies pre-amputation compared to controls, only case-study P2 exhibited reduced average finger selectivity pre-amputation based on the RSA (Crawford t-test: t(15) = -3.15, p = 0.007) and decoding (t(15) = −3.9, p = 0.001; similar to what was observed in S1). Next, when testing for reductions in average finger selectivity at the 6-month timepoint, relative to baseline, only case-study P1 exhibited a significant reduction compared to controls [cross-nobis distances: 3 comparisons; t(15) = 2.33; puncorr=0.02); decoding: 3 comparisons; t(15) = 2.32; puncorr=0.03]. However, it returned to the typical range when later assessed at the 1.5 year timepoint (for both measures). We also noted that case-study P3 showed a significant reduction at the 6-month timepoint, relative to controls, in the decoding (3 comparisons; t(15) = 2.18, puncorr=0.046), but not the cross-nobis. (d) Lips univariate activity plotted across M1 before and after amputation. (e) All case studies showed typical session to session variability as controls in (left side) the lips center of gravity across M1 and (right side) lips activity in the M1 hand region. All annotations are the same as described in the captions of the Figs. 2–3 and Extended Data Fig. 5. Across all panels, we only report statistics when significant.

(a) Intact hand and finger univariate activity across S1 before and after amputation. When testing the stability of the whole hand condition across sessions, all case-studies fell within the distribution of controls at all timepoints. (b) Unaffected (intact) hand between-session differences in inter-finger values. Difference values are depicted for the (left) cross-validated distances and (right) decoding accuracies. Classification/distance differences before and after amputation are visualized for each finger pair [Pre1-Pre2] minus [Pre Avg. – Post1 (3 m)] minus, [Pre1-Pre2] minus [Pre Avg. – Post2 (6 m)] and [Pre1-Pre2] minus [Pre Avg. – Post3 (1.55/y)]. Each violin plot reflects an individual finger pair (same order of finger-pairs as detailed in Fig. 2d). For consistency, the control values are all for the left-hand. When computing the session-to-session differences relative to controls, all case-study participants showed typical session-to-session variability in finger selectivity at the 6-month timepoint, relative to controls. (c) Longitudinal lips univariate in the unaffected hemisphere (contralateral to intact hand) across S1 before and after amputation. (d) All case study participants showed typical changes in the lips center of gravity (CoG) in the unaffected S1 hemisphere across scans, relative to controls. (e) When testing for changes in lip activity (in the unaffected hand region), one case-study, P1, exhibited a significant atypical increase in lip activity relative to controls at the 6-month timepoint (Crawford t-test: t(15) = 2.75, puncorr=0.01). However, the activity returned into the distribution of controls when tested at the 1.5 year timepoint (t(15) = 0, puncorr=0.99). All other annotations are the same as described in Figs. 2 and 3. We only report statistics when significant.

(a) Visualization depicting the inter-session Pearson correlations of individual fingers within the BA3b hand region. (b) Inter-session correlations for the left (top row) and right hands (bottom) in the contralateral hand ROI. Line colors indicate session pairings (indicated in the legend). For case-study participants, dashed line denotes the affected hand; solid line unaffected hand. Violin plots reflect able-bodied control’s Pre – Post (6 m) values. (c) Between-session differences in finger correlation coefficients. Difference values are depicted for the (left) missing or non-dominant hand of controls and (right) intact or dominant hand of controls. The difference values are ordered to reflect the increasing gap between sessions: [Pre1-Pre2] minus [Pre Avg. – Post1 (3 m)] minus, [Pre1-Pre2] minus [Pre Avg. – Post2 (6 m)] and [Pre1-Pre2] minus [Pre Avg. – Post3 (1.55/y)]. Each violin plot reflects an individual finger. When testing whether the case-study participants showed a unique reduction in the average correlation, across fingers, relative to controls, for the missing hand, only P3, at the 3-month timepoint, for the missing hand (not intact), showed a significant pre-post reduction in the average correlation coefficient, relative to controls (t(15) = −2.59, puncorr=0.02). However, this difference returned to the typical range of controls when later tested at the 6-month timepoint (t(15) = −1.23, puncorr=0.23). All other annotations are as in Fig. 2. We only report statistics when significant.

(a) Graphic illustration of multivoxel pattern analyses. (b) Inter-finger multivariate analysis using cross-validated Mahalanobis (cross-nobis) distances. Line colors denote train-test/cross validation session pairs, respectively as indicated in the legend. The gray shaded area reflects able-bodied control’s Pre – Post (6 m) data (95% percentile interval). (c) Classification/distance differences before and after amputation are visualized for each finger pair [Pre1-Pre2] minus [Pre Avg. – Post1 (3 m)] minus, [Pre1-Pre2] minus [Pre Avg. – Post2 (6 m)] and [Pre1-Pre2] minus [Pre Avg. – Post3 (1.55/y)]. Each violin plot reflects an individual finger pair (same order of finger-pairs as detailed in b). When comparing differences relative to controls, we observed some temporary, idiosyncratic reductions in average finger selectivity, relative to controls. First for the cross-nobis results, P1 showed a temporary reduction in average finger selectivity at 6 months (3 comparisons; t(15) = −2.79, puncorr=0.01), though later offset to the typical range at their follow-up 1.5-year scan. P2 only exhibited reduced selectivity only at the 5-year timepoint, though reduction seen in the intact hand as well (Extended Data Fig. 4). Finally, P3 exhibited reduced selectivity at 6 months relative to controls (2 comparisons; t(15) = −2.36, puncorr=0.03). For the decoding results, P2 seemed to show significantly reduced selectivity at the 5-year timepoint, though also reduced for the intact hand (Extended Data Fig. 4). (d) The representational typicality of the hand structure was estimated by correlating each session’s cross-validated Mahalanobis distances for each participant to a canonical inter-finger structure (controls average). All case-study participant’s typicality values fell within the distribution of controls. All other annotations are as in Fig. 2. We only report statistics when significant.

(a) Multivariate distances between the thumb, lip and feet cross-validated across sessions depicted for the right (top row) and left hemisphere (bottom) of the case-study participants that underwent an amputation and controls, contralateral to the thumb side being moved. Distances appear in the following order: (1) thumb-lips, (2) thumb-feet, (3) lips-feet. Line colors indicate session pairings (indicated in the legend). For case-study participants, dashed line denotes the affected hemisphere; solid line unaffected hemisphere. Grey shaded area reflect able-bodied control’s Pre – Post (6 m) values. For the affected hemisphere of the case-study participants, all distances fell within the typical range of the able-bodied controls. (b) We also tested whether changes occurred in the multivariate hand-lip distance when performed within each of the 49 S1 segments/ All case-study participants showed similar distances across sessions, before and after amputation. All other annotations are the same as described in Fig. 2.

Participant hand and lip cortical maps – registered to a standard cortical surface – are visualized for the chronic amputee participants (top row; n = 26) and secondary able-bodied control participants who underwent the same procedures as the chronic amputees (n = 18; bottom row). Hand maps for the amputees reflect moving their phantom hand, while for controls reflect moving their non-dominant hand (in the contralateral hemisphere). All maps are contrasted against rest, minimally thresholded at 50% the maximum z-statistic and masked to Brodmann regions: 1, 2, 3a, 3b, and 4. Amputee maps are ranked by the numbers of years since amputation at the time of the scan and control maps are ranked by the participants age at the time of the scan.

Using the data from the last session of each participant, each voxel was awarded to the body-part with the highest response. Left column – we show the winner-takes-all analysis when performed on 3 body-parts: hand (red), lips (blue) and feet (green) versus (Right column) when excluding the physically absent hand. This comparison reveals supposed large-scale expansions of the lips or feet into the deprived hand region (black outline) post-amputation. We’ve also depicted the center of gravity (CoG) of the winner-takes-all lip cluster (white circles) to further demonstrate this. When excluding the hand activity, the CoG of the lips ‘shifts’ towards the hand area. Thus, ignoring the primary body part – depending on your analysis choices – can substantially bias the results,. Combined with the use of cross-sectional designs, this analysis approach has led to the impression of cortical remapping and even large-scale reorganization of the lip representation following amputation. Crucially, the newly assigned winner in the hand area [left panel] has rarely been directly compared against the persistent representation of the missing hand, and indeed, indicative evidence show that this recorded activity in the hand area is weak (we extensively discuss this in our recent review ref. ).
Update of
-
Stable Cortical Body Maps Before and After Arm Amputation.bioRxiv [Preprint]. 2025 Feb 4:2023.12.13.571314. doi: 10.1101/2023.12.13.571314. bioRxiv. 2025. Update in: Nat Neurosci. 2025 Oct;28(10):2015-2021. doi: 10.1038/s41593-025-02037-7. PMID: 38168448 Free PMC article. Updated. Preprint.
References
MeSH terms
Grants and funding
- F32MH139145/U.S. Department of Health & Human Services | National Institutes of Health (NIH)
- MC_UU_00030/10/RCUK | Medical Research Council (MRC)
- F32 MH139145/MH/NIMH NIH HHS/United States
- ZIAMH 002893/U.S. Department of Health & Human Services | NIH | National Institute of Mental Health (NIMH)
- WT_/Wellcome Trust/United Kingdom
LinkOut - more resources
Full Text Sources
