. 2025 Oct;31(10):3451-3463.
doi: 10.1038/s41591-025-03884-4. Epub 2025 Aug 21.

Perioperative IDH inhibition in treatment-naive IDH-mutant glioma: a pilot trial

Affiliations

Perioperative IDH inhibition in treatment-naive IDH-mutant glioma: a pilot trial

Katharine J Drummond et al. Nat Med. 2025 Oct.

Abstract

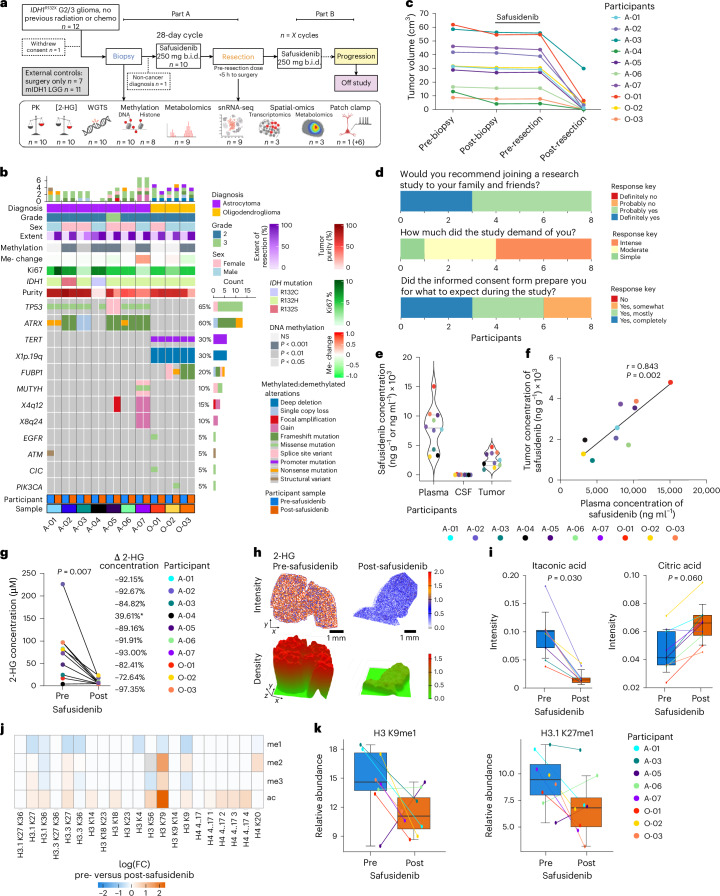
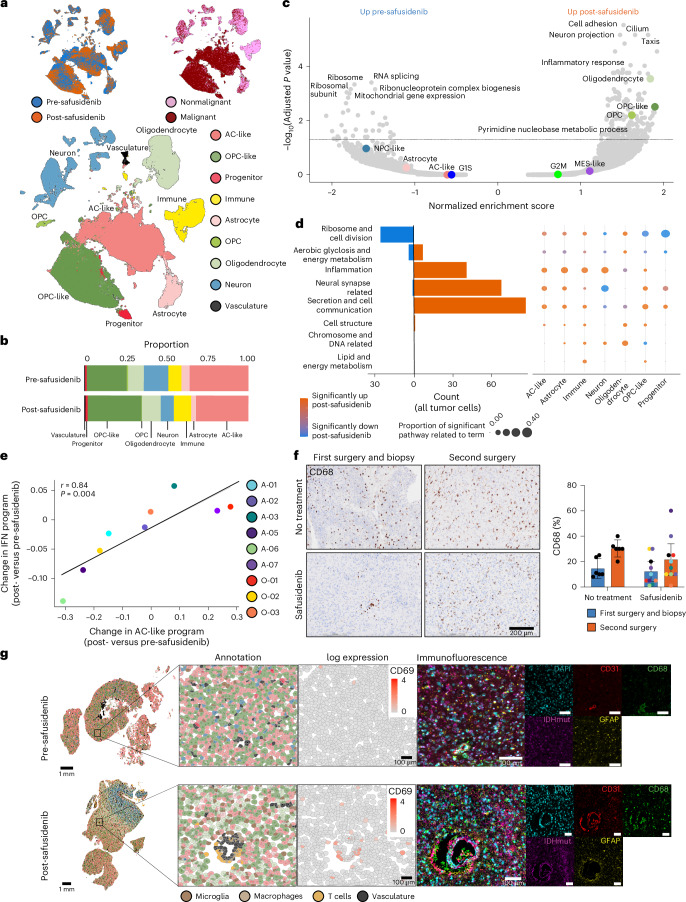
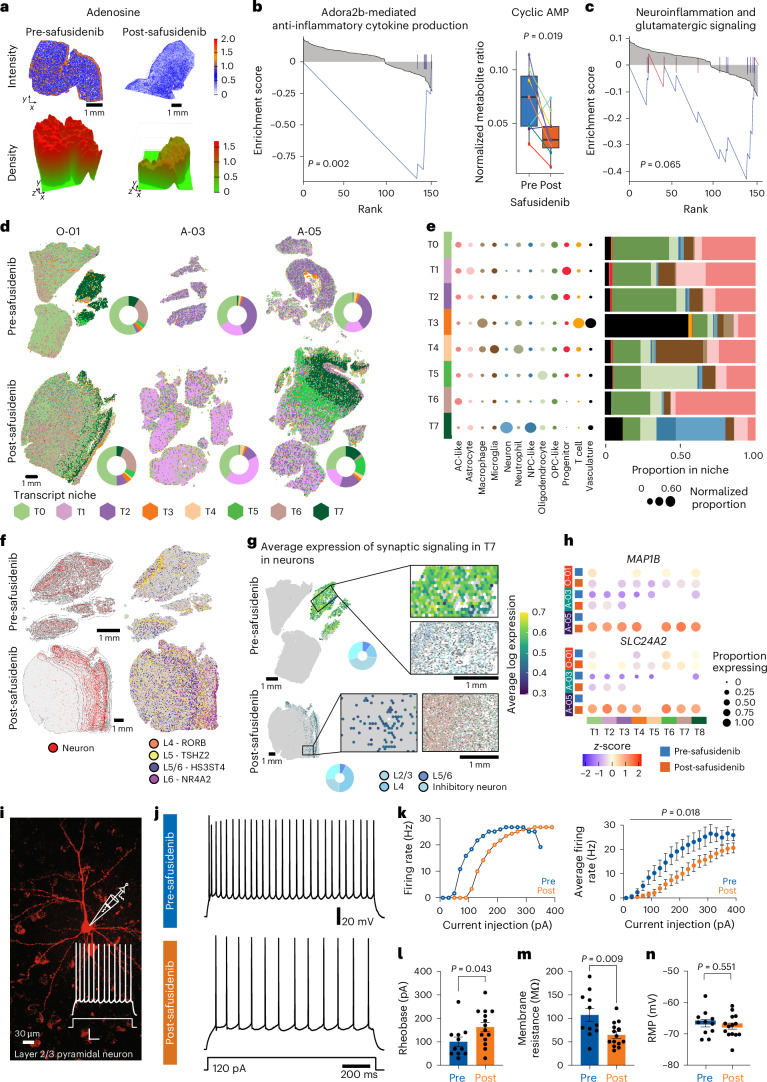
Mutant isocitrate dehydrogenase (mIDH) inhibition significantly improves progression-free survival in patients with mIDH WHO grade 2 glioma; however, a large proportion of patients will progress, and mechanisms of adaptation to mIDH inhibition remain poorly understood. Perioperative studies with evaluation of paired pre- and post-treatment samples enable detailed understanding of drug response, facilitating biomarker development, but are rare in glioma owing to safety and cost concerns. Here we conducted a single-arm, open-label feasibility perioperative trial in patients with mIDH1 low-grade glioma, treatment naive to radiation and chemotherapy, with safusidenib (AB-218/DS-1001b), an orally available small-molecule inhibitor of mIDH1. As of 8 November 2024, 10 patients were enrolled and have completed the perioperative component, with a median follow-up of 14 months. Patients continue postoperative safusidenib with ongoing follow-up for safety and efficacy. The primary endpoint showed the feasibility and acceptability of conducting a two-stage perioperative trial. One patient experienced a serious surgery-related adverse event, and ten reported safusidenib-related adverse events; most were grade 1, and one experienced grade 3 elevation of transaminases. Tumor 2-hydroxyglutarate quantification revealed on-target activity, associated with alterations in differentiation programs and neural excitability, functionally validated in post hoc analysis by patch-clamp electrophysiology. Taken together, these results provide a detailed investigation of observations associated with mIDH inhibition in glioma. The study shows the safety and feasibility of this perioperative approach, which can be applied broadly in clinical trial design, serving as proof of concept for advancing drug development in glioma. ClinicalTrials.gov registration: NCT05577416 .


Conflict of interest statement

Competing interests: K.J.D. reports research funding from AnHeart Therapeutics to the institute (Royal Melbourne Hospital). J.R.W. reports research funding from AnHeart Therapeutics to the institute (WEHI), receiving consulting fees from AnHeart Therapeutics and Servier, being on advisory boards for Roche and Merck, and being a data safety monitoring member for Telix Pharmaceuticals. The other authors declare no competing interests.

Figures

Fig. 1
Fig. 1. Perioperative study safely delivers safusidenib to inhibit mIDH1.
a, Clinical trial schema. WGTS, Whole Genome Transcription Sequencing. In part A, previously untreated participants with WHO grade 2 or 3 (G2/3) mIDH1 glioma (n = 10) underwent biopsy then 28 days of safusidenib treatment followed by resection surgery (within 5 h pre-resection safusidenib dose). Materials taken for translational research are depicted below. b, Oncoprint detailing the histopathology, whole-genome sequencing and methylation (n = 7 astrocytoma, A-01 to A-07; n = 3 oligodendroglioma, O-01 to O-03). A-04 translational tissue samples had low tumor purity (0%) and were excluded from downstream translational exploratory endpoints. NS, not significant. c, Volumetric analysis of tumor volume (cm3) for T2/FLAIR sequences in each participant over time. d, Research Participant Perception Survey (RPPS) results from n = 8 participants who completed the survey. Response keys are depicted for each question. e, Safusidenib concentration in plasma (ng ml−1), CSF (ng ml−1) and tumor tissue (ng g−1) at the post-safusidenib resection timepoint (n = 10). f, Comparison of safusidenib in tumor tissue (ng g−1) and in plasma (ng ml−1) within each participant at the post-safusidenib resection timepoint (n = 10, t-test). g, Quantification of tissue 2-HG in pre- and post-safusidenib tumor, paired per participant (n = 10). Change in 2-HG concentration depicted post-safusidenib. The asterisk indicates that A-04 (low tumor purity) was sampled from non-tumor tissue (paired t-test). h, Spatial metabolomics detecting endogenous 2-HG (m/z: 209.10; adducts: M + IsoProp + H) intensity (top) at 10 µm pixel resolution in pre- and post-safusidenib samples of participant O-01. Below is a kernel density plot visualizing the intensity. i, LC–MS untargeted analysis of itaconic acid (n = 9 participants, paired t-test) and citric acid (n = 9 participants, paired t-test). Each box indicates the interquartile range (IQR), the center line is the median and the whiskers extend to the furthest points within 1.5 × IQR. Participant legend as in c. j, LC–MS/MS analysis of H3 canonical histone methylation and acetylation pre- versus post-safusidenib treatment (n = 7 G2 participants). k, Quantification of H3K9 and H3K27 monomethylation marks in pre- and post-safusidenib tumor, paired per participant (n = 8). Each box indicates the IQR, the center line is the median and whiskers extend to the furthest points within 1.5 × IQR. Panel a created with BioRender.com. Source data
Fig. 2
Fig. 2. Altered gene programs following safusidenib treatment.
a, UMAP plot depicting 158,487 nuclei identified in n = 9 matched samples using snRNA-seq from participants pre- and post-safusidenib. Top left: pre- and post-safusidenib conditions; top right: nonmalignant and malignant cells determined by Numbat; bottom: annotated UMAP clusters of glial tumor and normal cell states. b, Fraction of each cell state in pre- and post-safusidenib samples (n = 9 participants). Cell type legend as in a. c, Comparison of all tumor cells in matched pre- and post-safusidenib samples using GSEA. Each dot represents a gene set and the color indicates whether the gene set belongs to a glioma program; top enriched pathways are annotated. The x-axis shows the GSEA normalized enrichment score, and the y-axis shows the adjusted P value. The line depicts the significance threshold (adjusted P = 0.05). d, Dot plot depicting key semantic terms summarizing significant gene sets for each cell type population from GSEA. Each dot represents the proportion of significant pathways related to that term and is color coded to indicate the direction of enrichment—pre- or post-safusidenib. The accompanying bar plot illustrates the counts and enrichment direction of significant gene sets per semantic term for the tumor compartment. e, log(FC) in the AC-like program compared with log(FC) in the IFN program in AC-like tumor cells pre-safusidenib relative to post-safusidenib treatment (n = 9 participants, t-test). f, Representative immunohistochemistry staining of CD68 in the first surgery and biopsy, and the second surgery, from untreated patients (no treatment, surgery only) compared with participant O-01 pre- and post-safusidenib tissue. Quantification percentage CD68+ cells (no treatment, n = 6 matched samples; safusidenib, n = 10 matched samples). Mean ± s.e.m. (no treatment: 14.6 ± 3.1% at first surgery and biopsy, 30.3 ± 2.6% at surgery; safusidenib: 12.3 ± 3.5% at first surgery and biopsy, 21.6 ± 5.5% at surgery). Individual dots represent matched patient samples. Participant legend as in e. g, Example of vasculature in participant A-05 pre-safusidenib and post-safusidenib (n = 3 per condition). Single-cell spatial maps (Voronoi) of the expression of the CD69 transcript, cell state annotation and protein expression by immunofluorescence (CD31, CD68, mIDH and GFAP), with location in tissue (scale bars, 1 mm; annotation legend in a). Inset scale bars, 100 µm. Source data
Fig. 3
Fig. 3. Safusidenib alters transcriptional patterns in progenitor cells.
a, UMAP plot of snRNA-seq tumor populations only, colored by differentiation potential potency scores calculated using CytoTRACE2 (left). The accompanying density plots illustrate the distribution of potency scores within the progenitor population under pre-safusidenib and post-safusidenib conditions. b, Two-dimensional butterfly plot visualization, with each quadrant corresponding to a tumor cell state: mesenchymal-like (MES-like), neural-progenitor-like (NPC-like), astrocyte-like (AC-like) and oligodendrocyte-progenitor-like (OPC-like) as defined by Neftel et al.. SC1 and SC2 represent single-cell gene signature scores 1 and 2 also defined by Neftel et al.. The position of each progenitor nucleus reflects its relative signature scores in the pre-safusidenib and post-safusidenib samples. Cell density is indicated by contour lines. c, Progenitor cell transcriptional program alignment with tumor cell states in responder (positive values) compared with nonresponder (negative values) Spitzer et al. samples. d, Ternary plots comparing transcriptional metabolic programs; Krebs (K), lactate (L) and glycolysis (G), in AC-like and OPC-like tumor cells from 11 untreated LGG tumors. e, Quantification of metabolite (α-KG (m/z: 254.08; adducts: M + ACN + Na) and glucose (m/z: 203.05; adducts: M + Na)) intensity score in 100 × 100 µm regions of spatial metabolomics, assigned to AC-like/OPC-like tumor cell ratios calculated by serial spatial transcriptomics sections on samples A–E (example ratio regions annotated, below). Scale bars, 10 μm. Example tumor region with annotated cell type (right, above) and glucose spatial intensity (right, below). Scale bar, 100 μm. f, Quantification of α-KG and glucose in AC-like compared with OPC-like tumor cell states calculated based on spatial transcriptomics annotation relative to spatial metabolomics (Welch t-test). Mean ± s.e.m. Cell type legend as in e. g, Barcode plot of pathways ‘Krebs cycle disorders’ and ‘glutaminolysis and cancer’. Significance calculated via GSEA (n = 9 participants, permutation-based testing). h, Simplified schema of the citric acid cycle and nucleotide synthesis. Blue, increased abundance pre-safusidenib; orange, increased abundance post-safusidenib. UMP, uridine monophosphate; CIT, citrate; OAA, oxaloacetate; MAL, malate; FUM, fumarate; SUC, succinate; ICIT, isocitrate; cis-ACO, cis-aconitate; ND, not detected. Data from LC–MS untargeted analysis (n = 9 participants). i, Ternary plot comparing transcriptional metabolic programs in progenitor cells of K, L and G in responder and nonresponder Spitzer et al. samples pre-mIDH inhibitor compared with post-mIDH inhibitor. Inh, inhibitor.
Fig. 4
Fig. 4. Altered neuron signaling following safusidenib treatment.
a, Spatial metabolomics detecting adenosine intensity (top) in participant O-01 pre- and post-safusidenib. Bottom: kernel density plot of smoothed intensity. b, Barcode plot of the ‘Adora2b-mediated anti-inflammatory cytokine production’ pathway in LC–MS metabolomics data (GSEA permutation-based testing, n = 9 participants) and normalized metabolite ratio of cyclic AMP pre- and post-safusidenib (n = 9 participants, paired t-test). Each box indicates the IQR, the center line is the median and the whiskers extend to the furthest points within 1.5 × IQR. c, Barcode plot of the ‘Neuroinflammation and glutamatergic signaling’ pathway in LC–MS metabolomics data (GSEA permutation-based testing, n = 9 participants). d, Spatial map of transcript niches of three participants pre- and post-safusidenib computed using GraphSAGE. e, Cell assignments to transcript-based niches are represented as normalized proportions. Bar plot of the proportion of cells in each niche. f, Spatial maps of neurons (red) in pre- and post-safusidenib samples of participant O-01 with associated density contour plot (left) and key neuronal layer markers (right). g, Average log expression of the ‘synaptic signaling’ pathway for neurons in the T7 niche pre- and post-safusidenib from participant O-01, inferred through CytoSPACE integration. Insets: cell-type annotations, with donut plots of neuron subtype proportions within the region. h, Dot plots of the proportion of neurons per transcript niche expressing synaptic signaling genes in matched pre- and post-safusidenib samples. The dot colors represent scaled average log expression. i, Example layer 2/3 pyramidal neuron filled with 5-(and-6)-tetramethylrhodamine biocytin. Inset: whole-cell patch-clamp voltage response to current step injection (130 pA, representative of n = 25 for n = 7 participants). Scale, 20 mV, 200 ms. j, Example whole-cell patch-clamp recordings (120 pA steps) from pyramidal neurons obtained from a single patient pre- and post-safusidenib. k, Firing rate (20 pA steps, 1,200 ms) from (left) the neurons and patient shown in j and (right) average of all neurons (pre-safusidenib (n = 11 neurons; 4 participants) and post-safusidenib (n = 14 neurons; 3 participants), ANOVA). Mean ± s.e.m. ln, Rheobase (t-test) (l), membrane resistance (t-test) (m) and resting membrane potential (RMP) (t-test) in neurons (n) from tissue analyzed pre- and post-safusidenib. Panels l and m show mean ± s.e.m.
Extended Data Fig. 1
Extended Data Fig. 1. Part A outcome data.
a. Immunohistochemistry staining of participant O-01 pre- and post-safusidenib treatment (mIDH-R132H, ATRX, GFAP, P53, Ki67) and Hematoxylin and Eosin (H&E) stain. Scale, 50 µm. Representative of immunohistochemistry staining across n = 10 participants. b. LGG RANO values from participants through Part A of the study. c. Percent change in tumor size pre- and post-safusidenib treatment according to LGG-RANO or volumetric assessment. d. Volumetric analysis of tumor volume (cm3) for T2/FLAIR sequences in each participant over time in Part B of the study. e. LGG RANO values from participants through Part B of study. f. Swimmer plot depicting response assessment by LGG-RANO in months post biopsy. Triangles indicate surgical procedures and circles indicate study status. PD refers to progressive disease and SD refers to stable disease. Safusidenib treatment periods are depicted by solid colored lines, and arrowheads indicate ongoing treatment. Note that breaks in the x-axis indicate non-continuous intervals. g. Research Participant Perception Survey (RPPS) results from n = 8 participants who completed the survey. Source data
Extended Data Fig. 2
Extended Data Fig. 2. Metabolic and histone changes following safusidenib treatment.
a. Longitudinal concentration (ng/mL) of safusidenib in the plasma over the four post-safusidenib study timepoints: days 1, 8, post 15, 28, and day of surgery (± 2 days) (n = 10 matched longitudinal samples). b. Correlation of percent change in 2-HG with participant tumor safusidenib concentration (n = 10 participants). c. 2-hydroxyglutarate (2-HG) quantification (µM) by LC-MS in tissue, CSF and plasma at the pre- and post-safusidenib timepoints (n = 10 matched samples). d. 2-HG quantification (µM) by GC-MS in tissue, CSF and plasma at the pre- and post-safusidenib timepoints (n = 10 participants). e. Spatial metabolomics examining 2-HG (m/z: 209.10 adducts: M+IsoProp+H) in participant A-05. Detected intensity score, above, 3D density map extrapolated from intensity, below. Scale, 1 mm. f. Heatmap of the top altered metabolites in each sample. g. Specific histone marks altered pre- and post-safusidenib (n = 8 participants). Box indicates IQR, centre line is median; whiskers extend to the furthest points within 1.5 × IQR. Source data
Extended Data Fig. 3
Extended Data Fig. 3. Safusidenib impact on tumor microenvironment composition.
a. UMAP overlaid with participant origin for each nucleus. b. UMAP colored by UMI count (log10 transformed). c. UMAP colored by number of detected genes (log10 transformed). d. UMAP of snRNA-seq data colored by closest cell annotation match in Spitzer et al. predicted using SingleR. e. Confusion matrix of proposed cell annotation versus predicted Spitzer at al. cell annotation. f. Heatmap of z-score of average expression of well-established markers in different cell types. g. Bar plot of proportion of cell types pre- and post-safusidenib for each participant from snRNA-seq data. h. Difference in proportion of all major cell types between snRNA-seq samples pre- and post-safusidenib. i. Difference in proportion of tumor cell types between snRNA-seq samples pre- and post-safusidenib. j. Difference in proportion of immune cell types between snRNA-seq samples pre- and post-safusidenib.
Extended Data Fig. 4
Extended Data Fig. 4. Gene program changes in response to safusidenib treatment.
a. Comparison of all tumor cells in matched pre- and post-safusidenib samples using GSEA following the methodology described by Spitzer et al. Each dot represents a gene-set. X axis shows the GSEA normalized enrichment score (NES), Y axis shows the Adjusted p-value. b. RRHO2 plot comparing GSEA results for all cells to GSEA analysis performed by Spitzer et al. Negative log10 p-values represent the correlation strength, and low p-values in the upper right and lower left quadrants represent concordant up and down regulation, respectively. c. Comparison of AC-like tumor cells in matched pre- and post-safusidenib samples using GSEA via ranked lists according to DEG results. Each dot represents a gene-set and color indicates whether the gene-set belongs to a glioma program and top enriched pathways are annotated. X axis shows the GSEA normalized enrichment score (NES), Y axis shows the adjusted p-value. Line indicates significance threshold (Adjusted p-value 0.05). d. As in (c) for OPC-like tumor cells. e. As in (c) for Progenitor tumor cells. f. Enrichment of the ranked list used for GSEA via ranked lists according to DEG results for AC-like (left), OPC-like (middle) and progenitor cells (right). Dots represent the percentage of genes, in a sliding window of 30 genes at fixed intervals of 0.10 (by -log10 p-value accounting for the direction of logFC), that overlap four main glioma programs. Trend line was computed using LOESS regression. g. Log-fold change in the IFN program compared to log-fold change in STING and HIF-1-alpha programs in AC-like tumor cells pre- relative to post-safusidenib treatment (n = 9 participants, t-test). Participant legend as in (h). h. Log-fold change in the IFN program in AC-like tumor cells compared to proportional change in immune cells pre- relative to post-safusidenib treatment (n = 9 participants, t-test). i. Spatial maps of the average log expression of genes in “Inflammation Response” pathway (left) and cells annotated as immune cells (right) with cell density indicated by contour plots for participant O-01. Pathway inferred by CytoSPACE integration of spatial transcriptomics and snRNA-seq and summarized as hex bins. Scale, 1 mm.
Extended Data Fig. 5
Extended Data Fig. 5. Spatial distribution of cell states in the tumor microenvironment.
a. Spatial map of cell type annotations for participants O-01, A-03 and A-05 matched pre- and post-safusidenib Xenium samples. Scale, 1 mm. b. Co-localization plots for Xenium post-safusidenib samples from infiltrating immune cell types to vasculature in the spatial context of all immune populations. Kontextual relative score evaluated over radii of 10 µm to 250 µm, at intervals of 20 µm. c. Heatmap of z-score of average expression of well-established immune markers across immune cell types from snRNA-seq data.
Extended Data Fig. 6
Extended Data Fig. 6. Macrophage distribution changes as a result of surgery.
Immunofluorescence conducted for DAPI (cyan), CD68 (green) and CD31 (red). Top panels, trial participant samples O-01, A-03 and A-05 biopsy (pre-safusidenib, n = 3 participants) and surgery (post-safusidenib, n = 3 participants). Bottom panels, surgery-only (no intervening treatment) samples 4, 5, 6, at first surgery and second surgery (n = 6 patients per condition). Scale bar, 50 µm.
Extended Data Fig. 7
Extended Data Fig. 7. Differentiation features of response.
a. UMAP colored by TOP2A log expression (left) and inferred cell cycle phase inferred by Seurat (right). b. Donut plot of proportion of cell cycle phases in Progenitor cells pre- and post-safusidenib. c. Average log expression per tumor cell population for each participant pre- and post-safusidenib for BMPER (left) and MYRF (right). Significant comparisons are indicated (n = 9 participants, DEG testing with limma). Box indicates IQR, centre line is median; whiskers extend to the furthest points within 1.5 × IQR. d. Box plot of differentiation potency scores for each tumor cell population pre- and post-safusidenib. Significant comparisons are indicated (n = 9 participants, pairwise t-test and one-sided t-test). Box indicates IQR, centre line is median; whiskers extend to the furthest points within 1.5 × IQR. Participant sample legend as in (c). e. UMAP of Responder and Non-responder with matched pre- and post- mIDH inhibitor samples from Spitzer et al colored by cell annotation. f. Violin plot of MYRF and BMPER gene expression in progenitor population pre- and post-mIDH inhibitor for responder (left) and non-responder (right). g. UMAP of LGG reference cohort of 11 patients colored by donor (left) and cell annotation (right). h. Box plot of glycolysis average log expression per sample in different cell populations in LGG reference cohort (n = 11 patients). Box indicates IQR, centre line is median; whiskers extend to the furthest points within 1.5 × IQR.
Extended Data Fig. 8
Extended Data Fig. 8. Multiparametric analysis of tumor metabolism.
a. H&E (left), spatial map indicating location of all AC-like and OPC-like tumor cells, with insets indicating the individual spatial distribution of each cell type separately (middle) and spatial metabolomics of average glucose abundance (m/z: 203.05 Adducts: M+Na) visualized in grids (right). The orange box indicates example tumor region depicted in Fig. 2e. b. Waterfall plot of the log-fold change in top 25 altered metabolites in pre- compared to post-safusidenib samples. Each participant sample is depicted by a colored point (n = 9 participants). Mean values ± SEM. c. Ternary plots comparing transcriptional metabolic programs in progenitor cells for Krebs, Lactate and Glycolysis in pre- compared to post-safusidenib. d. Log-fold change in the OPC-like program versus log-fold change in AC-like program in progenitor tumor cells pre- relative to post-safusidenib treatment (n = 9 participants, t-test).
Extended Data Fig. 9
Extended Data Fig. 9. Neuronal localization and distribution across transcriptomic niches.
a. Spatial metabolomics examining adenosine (m/z: 268.09 adducts: M + H) in participant A-05 tumor. Detected intensity score, above, 3D density map extrapolated from intensity, below. Scale, 1 mm. b. Enrichment heat map of each cell type identified co-localized within the transcriptional niches. c. Overlayed immunofluorescence, cell types and transcript niches in participant O-01 pre- and post-safusidenib (n = 3 per condition). Scales depicted in relevant immunofluorescence inset (left), 1000 µm, 100 µm and 10 µm. Immunofluorescence: DAPI, blue; GFAP, green; Phalloidin, magenta. Cell type annotations with immunofluorescence overlay (bottom right panel) and Niche subsets with immunofluorescence overlay (bottom right panel). d. Spatial maps of participant A-05 post-safusidenib sample indicating presence of neurons (red) with associated density contour plot (left) and showing cells expressing key neuronal layer markers (right) profiled with Xenium. Scale 1 mm. e. UMAP of neurons colored by neuron cell annotation (left). Box plot of synaptic signaling average log expression for each participant in different neuron populations pre- and post-safusidenib. Box indicates IQR, centre line is median; whiskers extend to the furthest points within 1.5 × IQR.
Extended Data Fig. 10
Extended Data Fig. 10. Electrophysiology of neurons in response to safusidenib treatment.
Example whole-cell patch clamp recordings from each pyramidal neuron recorded within tissue samples obtained from patients pre- (top; n = 11 neurons) and post- (bottom; n = 14 neurons) treatment with the mIDH inhibitor. All voltage responses are in response to a 230 pA current step injection. Scale bar, 20 mV, 200 ms.

References

    1. de la Fuente, M. I. et al. Olutasidenib (FT-2102) in patients with relapsed or refractory IDH1-mutant glioma: a multicenter, open-label, phase Ib/II trial. Neuro. Oncol.25, 146–156 (2023). - PMC - PubMed
    1. Mellinghoff, I. K. et al. Vorasidenib and ivosidenib in IDH1-mutant low-grade glioma: a randomized, perioperative phase 1 trial. Nat. Med.29, 615–622 (2023). - PMC - PubMed
    1. Mellinghoff, I. K. et al. Vorasidenib in IDH1- or IDH2-mutant low-grade glioma. N. Engl. J. Med.389, 589–601 (2023). - PMC - PubMed
    1. Natsume, A. et al. The first-in-human phase I study of a brain-penetrant mutant IDH1 inhibitor DS-1001 in patients with recurrent or progressive IDH1-mutant gliomas. Neuro. Oncol.25, 326–336 (2023). - PMC - PubMed
    1. Dang, L. et al. Cancer-associated IDH1 mutations produce 2-hydroxyglutarate. Nature462, 739–744 (2009). - PMC - PubMed

Substances

Associated data