. 2025 Aug 21;16(1):7582.
doi: 10.1038/s41467-025-62615-y.

Genome-wide in vivo CRISPR screens identify GATOR1 complex as a tumor suppressor in Myc-driven lymphoma

Affiliations

Genome-wide in vivo CRISPR screens identify GATOR1 complex as a tumor suppressor in Myc-driven lymphoma

Margaret A Potts et al. Nat Commun. .

Abstract

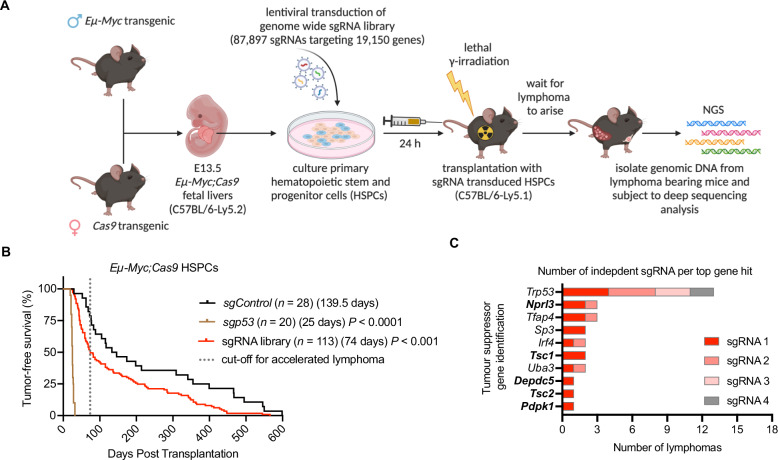
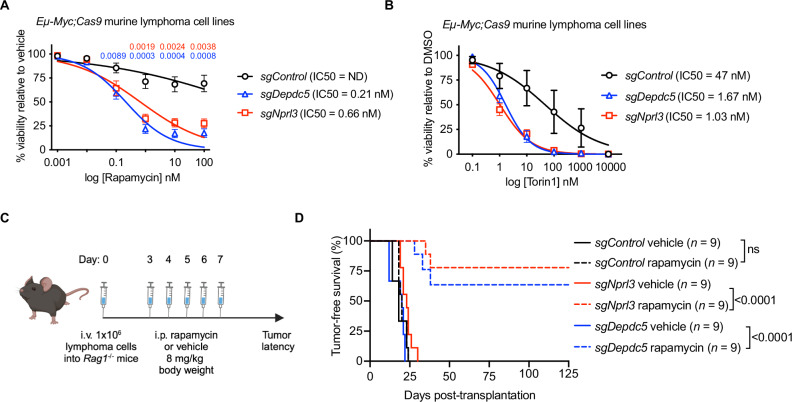
Identifying tumor suppressor genes is predicted to inform on the development of novel strategies for cancer therapy. To identify new lymphoma driving processes that cooperate with oncogenic MYC, which is abnormally highly expressed in ~70% of human cancers, we use a genome-wide CRISPR gene knockout screen in Eµ-Myc;Cas9 transgenic hematopoietic stem and progenitor cells in vivo. We discover that loss of any of the GATOR1 complex components - NPRL3, DEPDC5, NPRL2 - significantly accelerates c-MYC-driven lymphoma development in mice. MYC-driven lymphomas lacking GATOR1 display constitutive mTOR pathway activation and are highly sensitive to mTOR inhibitors, both in vitro and in vivo. These findings identify GATOR1 suppression of mTORC1 as a tumor suppressive mechanism in MYC-driven lymphomagenesis and suggest an avenue for therapeutic intervention in GATOR1-deficient lymphomas through mTOR inhibition.


Conflict of interest statement

Competing interests: The authors declare no conflicts of interest with respect to this work.

Figures

Fig. 1
Fig. 1. In vivo genome-wide CRISPR/Cas9 gene knockout screen identifies candidate tumor suppressors.
A Schematic of the experimental strategy for performing in vivo genome-wide sgRNA screens to identify candidate tumor suppressors. Fetal liver cells (FLCs), a rich source of hematopoietic stem/progenitor cells (HSPCs), from E13.5 Eµ-Myc;Cas9 embryos (C57BL/6-Ly5.2 background) were transduced with lentiviruses containing sgRNAs targeting p53 (sgp53; positive control), a negative control sgRNA targeting human BIM (sgControl) or a whole-genome sgRNA library 28. The transduced FLCs were injected intravenously (i.v.) into lethally irradiated (2 × 5.5 Gy, 3 h apart) congenic recipient C57BL/6-Ly5.1 mice. Lymphoma bearing mice displayed enlarged spleen, lymph nodes and/or thymus. Genomic DNA was isolated from the spleen, comprising mostly of lymphoma cells but also containing non-transformed hematopoietic cells. The enriched sgRNAs were identified by NGS. Schematic created in BioRender. Potts, M. (https://BioRender.com/smdpt7f ). B Tumor-free survival of mice transplanted with Eµ-Myc;Cas9 FLCs that had been lentivirally transduced with the positive control sgRNA (sgp53), the negative control sgRNA (sgControl) or a whole-genome sgRNA library. The dotted line represents cut-off for lymphomas from the whole genome sgRNA library cohort that were arbitrarily deemed to be accelerated and therefore selected for further analysis. n represents total number of transplanted mice per sgRNA from 6 reconstitution cohorts. Median survival is indicated in brackets. Log-rank (Mantel-Cox) statistical test for survival curve comparison to sgControl. C Top 10 tumor suppressor genes identified as hits, determined by frequency of their sgRNAs detected in independent lymphomas from mice from the whole-genome sgRNA library cohort that showed accelerated lymphoma, with the corresponding sgRNAs found to be highly enriched ( > 50% of reads within a given lymphoma) by sequencing. Genes emboldened (five of the top 10) represent those encoding proteins with functions in the mTORC1 inhibitory pathway. Source data provided as Supplementary Data 1 and as Source Data File.
Fig. 2
Fig. 2. Validation of GATOR1 complex components as suppressors of Myc-driven lymphomagenesis in mice as well as in human MYC-driven lymphomas.
A Schematic of the GATOR1 complex, consisting of three proteins, NPRL3, DEPDC5 (sgRNAs targeting their genes identified as hits in our genome-wide CRISPR screen), and NPRL2. The GATOR1 complex negatively regulates mTORC1 signaling in response to the availability of the amino acids leucine (Leu), methionine (Met) and arginine (Arg). BD Tumor-free survival of mice transplanted with FLCs from Eµ-Myc;Cas9 E13.5 embryos that had been transduced with either the sgp53 (positive control), the negative control sgRNA (sgControl) or two independent sgRNAs each for targeting either Nprl3 (B) Depdc5 (C) or Nprl2 (D). n represents the number of transplanted mice per sgRNA across two transplanted mouse cohorts. Median survival is indicated in brackets. Two-sided log-rank (Mantel-Cox) test was used for comparison of mouse survival curves to sgControl. E, Proportions of frameshift, in frame InDels or wildtype (wt) sequence reads for the target gene of each sgRNA, analyzed by NGS. Each bar represents one lymphoma cell line derived from lymphomas of recipient mice that had been transplanted with sgNrpl3, sgDepdc5 or sgNprl2 Eµ-Myc;Cas9 FLCs (n = 3 cell lines per genotype). Source data provided as Supplementary Data 2. F Survival of human patients with diffuse large B cell lymphoma (DLBCL), a cancer driven by abnormally high c-MYC expression, stratified by GATOR1 mRNA expression, where the GATOR1-low (n = 103) strata is defined as expression of either the NPRL3, DEPDC5 or NPRL2 mRNA in the lowest quartile. The others were grouped into the GATOR1-high strata (n = 104). Two-sided log-rank Kaplan-Meier statistical test, P = 0.0021. Source data are provided as a Source Data file.
Fig. 3
Fig. 3. GATOR1 deficiency obviates the pressure to lose p53 function during Myc-driven lymphomagenesis.
A Summary graph of Western blot analyses showing proportions of sgControl, sgDepdc5 or sgNprl3 Eµ-Myc;Cas9 lymphomas that are p53 wt, p53 mutant (Mut) or p53 knockout (KO). n = number of lymphomas from each genotype analyzed, indicated below the bars. B Summary plot showing the proportions of nutlin-3a sensitive (p53 wt) or nutlin-3a resistant (p53 function defective) Eµ-Myc;Cas9 lymphoma cell lines for each genotype. C Next generation sequencing of exons 4-11 of the p53 genomic locus to identify mutations. 3/10 sgControl, 0/9 sgNprl3, 0/8 sgDepdc5 and 0/7 sgNprl2 Eµ-Myc;Cas9 lymphoma cell lines tested carried mutations in the p53 gene. Source data provided as Supplementary Data 3. Predicted translational effect of the equivalent human homologue mutation according to the TP53 database (accessed: https://tp53.cancer.gov/). ‘NA’ means ‘unknown’ effect. D Mutual exclusivity mutational analysis of TP53 (p53) and the GATOR1 component genes DEPDC5 and NPRL2 in human DLBCL patient samples. Translational effect of mutation indicated, where synonymous refers to silent mutations and non-synonymous mutations cause an amino acid change. n = 73 patient samples, P < 0.0001 using two-sided Fisher’s exact test. Source data are provided as a Source Data file.
Fig. 4
Fig. 4. GATOR1 deficient lymphomas display alterations in mTORC1 regulated metabolic pathways.
A Schematic of the GATOR1 complex that negatively regulates mTORC1 signaling in response to the availability of the amino acids leucine (Leu), methionine (Met) and arginine (Arg). mTORC1 can be directly inhibited by rapamycin or the mTORC1/mTORC2 inhibitor Torin1. B Phospho-S6 (activated S6) protein levels (presented as geometric mean fluorescence intensity = MFI) as measured by intracellular flow cytometry of sgControl, sgNprl3 and sgDepdc5 Eµ-Myc;Cas9 lymphoma cell lines cultured at steady state (medium replete with amino acids and serum) or 2 h starvation (medium deprived of all amino acids and serum), and with or without treatment  with rapamycin (20 nM). Summary graph of phospho-S6 protein levels in n = 2 sgControl and 3 of each sgNprl3 or sgDepdc5 lymphoma cell lines across three replicate experiments. Data are presented as mean values ± SEM. Representative flow cytometry histograms shown, from one lymphoma cell line per genotype. Flow cytometry gating strategy represented in Supplementary Fig. S8C. Two-way ANOVA statistical test with Tukey’s multiple comparisons, significant P values displayed. C Western blot analysis of total S6, phospho-S6 (activated S6), total 4E-BP1 and phospho-4E-BP1 (inactivated 4E-BP1) proteins in sgControl, sgNprl3 and sgDepdc5 Eµ-Myc;Cas9 lymphoma cell lines at steady state or after 2 h deprivation of Leu, Met and Arg, with and without treatment with rapamycin (20 nM) for 2 h, n = 1. Probing for ACTIN served as a protein loading control. Protein sizes are indicated in kDa. Uncropped Western blot images are provided as Source Data. D Heatmap of expression of genes involved in mTORC1-regulated metabolic pathways, derived from RNA-Seq analysis of sgControl (n = 6), sgNprl3 (n = 6) and sgDepdc5 (n = 6) Eµ-Myc;Cas9 lymphoma cell lines after culture in medium containing 1% serum (i.e., starvation) for 24 h. Gene expression values are shown as Z-scores. E Relative protein translation was measured in negative control sgControl, sgDepdc5 and sgNprl3 Eµ-Myc;Cas9 lymphoma cell lines after growth for 24 h in starvation medium containing 1% serum by monitoring incorporation of O-propargyl-puromycin (OPP). Flow cytometry gating strategy represented in Supplementary Fig. S8D. n = 6 independent lymphoma cell lines per genotype, 1-2 technical replicates. Data are presented as mean value ± SEM. Ordinary one-way ANOVA statistical test was used for comparison, significant P values displayed. Source data are provided as a Source Data file.
Fig. 5
Fig. 5. GATOR1 deficient lymphoma cells are highly sensitive to mTORC1 inhibition in vitro and in vivo.
A, B Response curves of sgControl, sgNprl3 or sgDepdc5 Eµ-Myc;Cas9 lymphoma cell lines to treatment in vitro with increasing doses of rapamycin (A) or Torin1 (B). Lymphoma cell viability was measured after 24 h of treatment with drug or vehicle by staining with Annexin V plus PI followed by flow cytometric analysis. Annexin V/PI double negative cells were deemed viable. Flow cytometry gating strategy represented in Supplementary Fig. S8B. n = 3 sgControl and 6 of each sgNprl3, sgDepdc5 or sgNprl2 lymphoma cell lines per genotype across 3 technical replicates. Data are presented as mean ± SEM, log transformed and fitting to non-linear regression. IC50 values are shown in brackets. Two-way ANOVA with Dunnett’s multiple comparison statistical test used to compare dose response to sgControl, significant P values displayed in corresponding color per genotype. C Schematic of in vivo rapamycin treatment experiments. One million sgControl, sgNprl3 or sgDepdc5 Eµ-Myc;Cas9 lymphoma cells were transplanted i.v. into the tail vein of RAG1-deficient mice, which lack B and T cells, to prevent lymphoma rejection due to an immune response against Cas9 and/or eGFP. Two days later, mice were randomly assigned into treatment arms, receiving either rapamycin at a dose of 8 mg/kg of body weight for 5 consecutive days by i.p. injection or vehicle as a control. Mice were monitored for lymphoma growth. Schematic created in BioRender. Potts, M. (https://BioRender.com/16f33zs). D Tumor-free survival curve of RAG1-deficient mice that had been transplanted with 1 × 106 negative control (sgControl), sgNprl3 or sgDepdc5 Eµ-Myc;Cas9 lymphoma cell lines. n = 9 mice per treatment arm, with three cell lines per genotype, each injected into three recipient mice. Two-sided log-rank (Mantel-Cox) statistical test for survival curve comparison. Source data are provided as a Source Data file.

References

    1. Dang, C. V. MYC on the path to cancer. Cell149, 22–35 (2012). - PMC - PubMed
    1. Stine, Z. E., Walton, Z. E., Altman, B. J., Hsieh, A. L. & Dang, C. V. MYC, metabolism, and cancer. Cancer Discov.5, 1024–1039 (2015). - PMC - PubMed
    1. Adams, J. M. et al. The c-myc oncogene driven by immunoglobulin enhancers induces lymphoid malignancy in transgenic mice. Nature318, 533–538 (1985). - PubMed
    1. Langdon, W. Y., Harris, A. W., Cory, S. & Adams, J. M. The c-myc oncogene perturbs B lymphocyte development in E-mu-myc transgenic mice. Cell47, 11–18 (1986). - PubMed
    1. Harris, A. W. et al. The E mu-myc transgenic mouse. a model for high-incidence spontaneous lymphoma and leukemia of early B cells. J. Exp. Med167, 353–371 (1988). - PMC - PubMed

MeSH terms

Substances

LinkOut - more resources