. 2025 Aug 21;16(1):7793.
doi: 10.1038/s41467-025-63069-y.

The bispecific innate cell engager AFM28 eliminates CD123+ leukemic stem and progenitor cells in AML and MDS

Affiliations

The bispecific innate cell engager AFM28 eliminates CD123+ leukemic stem and progenitor cells in AML and MDS

Nanni Schmitt et al. Nat Commun. .

Abstract

Strategies targeting leukemic stem and progenitor cells (LSPCs) are needed for durable remissions in acute myeloid leukemia (AML) and high-risk myelodysplastic neoplasms (MDS). While CD123 constitutes a promising target on LSPCs and leukemic blasts, previous CD123-targeting approaches showed limited efficacy and challenging safety profiles. Here, we describe the preclinical efficacy and safety of the bispecific CD123/CD16A innate cell engager "AFM28", demonstrating superior activity against AML and MDS patient-derived LSPCs and blasts in vitro compared to an Fc-enhanced CD123-targeting antibody, especially towards CD123low and/or CD64+ leukemic cells. AFM28 induces autologous anti-leukemic activity in fresh AML whole blood cultures, demonstrating its potential to enhance NK cell function from AML patients. Responsiveness can be further enhanced by allogeneic NK cell addition. Anti-leukemic activity of AFM28 is confirmed in xenograft mouse models. In addition, AFM28 is well tolerated and demonstrates pharmacodynamic activity in cynomolgus monkeys. Altogether, our results indicate that AFM28 has the potential to reduce relapse-inducing residual disease and promote long-term remissions for patients with AML and MDS with a favorable safety profile.


Conflict of interest statement

Competing interests: This study was supported by funding from Affimed GmbH. J.P. is an employee of Affimed GmbH. J.J.S., S.S., U.R., J.M.E., J.K., A.L.G., T.R., T.M., I.K., SKnackmuss, C.M., and J.E. were employees of Affimed at the time of writing and execution of this study. D.N. has received research funding from Affimed, Tolero Pharma, Pharmaxis and Apogenix, received funding for a clinical trial from AbbVie and received honoraria from Celgene and Takeda. The remaining authors declare no competing interests.

Figures

Fig. 1
Fig. 1. AFM28 induces lysis of CD123+ leukemic cell lines irrespective of CD123 and CD64 expression levels.
Buffy coat-derived allogeneic healthy donor NK cells were cultured at a 2:1 E:T ratio with calcein-labeled leukemic cell lines in the presence of increasing concentrations of AFM28, Fc-enhanced anti‑CD123 IgG1 or non-targeting control RSV/CD16A. A Exemplary data for selected tumor cell lines. Specific tumor cell lysis of indicated CD123+ leukemic cells by NK cells derived from one healthy donor was quantified by calcein-release cytotoxicity assay. Data depict one biological sample represented as the mean ± SD of two technical replicates. B Gray bars: Quantification of CD123 expression levels on the cell surface of leukemic cell lines determined as SABC measured by flow cytometry, represented as mean ± SD of 3, 4 or 5 independent biological replicate experiments, as indicated by individual data points per cell line. Magenta and blue bars: Efficacy (Emax) and potency (EC50) of tumor cell lysis by NK cells induced by AFM28 (magenta bars) and anti-CD123 Fc-enhanced IgG1 (blue bars) for all tested cell lines was quantified by calcein-release cytotoxicity assay represented as mean ± SD of 3 or 4 independent biological replicate experiments, as indicated by individual data points per cell line. Note that each experiment utilized NK cells of an independent healthy donor source. Data were analyzed using two-way ANOVA and Šídák’s multiple comparisons test, with p-values below 0.05 indicated in the figure. na, not applicable since EC50 values were not reached. C Representative histogram of CD64 and CD32 expression of the indicated leukemic cell lines. D Quantitative analysis of the MFI of CD64 and CD32 on indicated cell lines (MFI of isotype control antibodies subtracted), represented as mean ± SD of three independent experiments (n = 3). MFI median fluorescence intensity; SABC specific antibody binding capacity; SD standard deviation.
Fig. 2
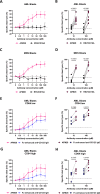
Fig. 2. AFM28 efficiently directs allogeneic NK cells to CD123+ blasts in AML and HR-MDS patient BMMC samples.
BMMC samples derived from AML and MDS patients were treated with 0–500 pM of AFM28, a non-targeting control (RSV/CD16A) or an Fc-enhanced anti-CD123 IgG antibody for 24 h in the presence of IL-2-preincubated allogeneic healthy donor NK cells, all derived from different donors, at a 1:1 E:T ratio. Analysis was performed using flow cytometry. Blasts were defined as viable/CD45low/CD34+ or CD33+/CD38+/CD123+ cells. The gating strategy is shown in Supplementary Fig. 2A. Cell counts of 0 pM treatment were set to baseline. AD Concentration-dependent lysis of blasts from AML (A, B, n = 10) or MDS (C, D, n = 5) patients by AFM28 compared to RSV/CD16A. EH Concentration-dependent lysis of blasts from AML patients with low (E, F, n = 5) or high (G, H, n = 5) CD64 MFI by AFM28 compared to an Fc-enhanced anti-CD123 IgG antibody. Data in (A, C, E and G) are represented as mean ± SD. Data in (B, D, F and H) were analyzed using two-way ANOVA and Šídák’s multiple comparisons test. MFI median fluorescence intensity; SD standard deviation.
Fig. 3
Fig. 3. AFM28 induces potent lysis of CD123+ LSPCs in AML and HR-MDS patient samples and spares healthy hematopoiesis.
BMMC patient-derived AML and MDS samples were treated with or without 100 pM of AFM28 for 24 h in the presence of IL-2-preincubated allogeneic NK cells, all derived from different donors, at an E:T ratio of 1:1. Analysis was performed using flow cytometry. LSPCs were defined as viable/CD45low/CD34+/CD38/CD117+ cells. The gating strategy is shown in Supplementary Fig. 2A. Cell counts of 0 pM treatment for LSPCs and CD123+ LSPCs were set to baseline. A Representative dot plot of LSPC lysis following treatment with 100 pM AFM28 or without AFM28 (indicated as 0 pM) of one AML patient sample. B, C Lysis of LSPCs from AML patients (B, n = 5) and from MDS patients (C, n = 5) in the presence of 100 pM AFM28 or without AFM28. Data are represented as mean ± SD and were analyzed using one-way and two-way ANOVA and Šídák’s multiple comparisons test. D, Schematic workflow of the CFU assay. Created in BioRender (https://BioRender.com/8l2brjy). EG CFU assay results of AML (E, n = 5), MDS (F, n = 5) and healthy (G, n = 5) CD34+ cell samples treated with 0/10/100/1000 pM of AFM28 for 24 h in the presence of allogeneic NK cells at an E:T ratio of 1:1. “CD34+ only” describes culturing untreated CD34+ cells without allogeneic NK cells. Colonies were counted manually. Colony count of “CD34+ only” condition was normalized to 100%. Data are represented as mean ± SD and were analyzed using one-way ANOVA and Tukey’s multiple comparisons test. SD standard deviation.
Fig. 4
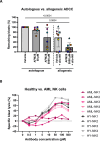
Fig. 4. AFM28 enables autologous and allogeneic ADCC of patient-derived NK cells against CD123+ blasts in primary AML samples.
A Fresh whole blood samples from newly diagnosed AML patients (n = 6) were treated with AFM28 (0/0.01/1 µg/ml equivalent to 0/50/5000 pM) or vehicle in the absence (circles) or presence of healthy donor-derived allogeneic NK cells (squares: fresh, non-expanded NK cells; triangles: cryopreserved cytokine-expanded NK cells generated by a standardized protocol, see Supplementary Methods and Supplementary Fig. 7), all derived from different donors, for 24 h at an E:T ratio (NK cells:peripheral leukocytes) of 1:1. Blasts were defined as viable/CD45low/CD123+/CD33+/CD117+ or CD34+/CD117+. The gating strategy is shown in Supplementary Fig. 2A. Leukemic blast counts of vehicle treatment without NK cells were set to baseline. E:T ratios of patient’s endogenous NK cells to blasts (in the absence of healthy donor-derived allogeneic NK cells) were 0.1:1, 0.01:1 and 0.2:1 for non-responders and 0.5:1, 0.1:1 and 0.1:1 for responders (data points from top to bottom for 5000 pM AFM28). Data are represented as mean ± SD and were analyzed using one-way ANOVA and Tukey’s multiple comparisons test. B BMMC samples derived from a single AML patient were treated with 0–500 pM of AFM28 for 24 h in the presence of allogeneic AML patient-derived NK cells (n = 5) or healthy donor-derived NK cells (n = 5) at a 1:1 E:T ratio. Analysis was performed using flow cytometry. Blasts were defined as viable/CD45low/CD34+/CD38+/CD123+. Blast counts of 0 pM treatment were set to baseline. HY healthy, SD standard deviation.
Fig. 5
Fig. 5. AFM28 blocks IL-3R signaling inhibiting STAT5 phosphorylation in TF-1.
A, B TF-1 cell growth was stimulated with IL-3 (A) or GM-CSF (B) in the presence of titrated AFM28, a non-targeting control (RSV/CD16A), or without antibody addition and with IL-3/GM-CSF (gray dot) or without antibody addition and without IL-3/GM-CSF (cross), for 72 h at 37 °C. The relative number of metabolically active viable cells was determined using the CellTiter-Glo assay in three independent experiments. The results shown were normalized to the maximum cell viability signal, which represents 100%. Data shown as mean ± SD (n = 3). C, D Intracellular phosphorylated STAT5 or STAT6 was measured in TF-1 cells upon stimulation with IL-3 (C) or IL-4 (D) in the presence of titrated AFM28, a non-targeting control engager (RSV/CD16A) or without antibodies (cross). One representative experiment is shown out of three performed. SD standard deviation.
Fig. 6
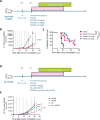
Fig. 6. In vivo anti-leukemic activity of AFM28 against a human AML cell line.
A Experimental schedule of CB17.SCID hCD16A xenograft model. On day 0, CB17.SCID hCD16A mice (n = 40 mice, 10 mice/group) received 1.2 Gy irradiation, followed by IV injection of 1 × 106 EOL-1_Luc cells four hours later. Three days after tumor cell inoculation, mice were randomized according to body weight (10 mice/group) and received either vehicle or AFM28 at different doses (0.3/1/3 mg/kg) twice per week for a total of 3 weeks. BLI measurements were performed every week starting day 15. Dotted lines represent treatment days. B Tumor growth represented by in vivo luciferase expression upon treatment is shown as photons per second in a linear scale. Data are represented as mean ± SD (n = 40 mice, 10 mice/group). Significance was tested by two-way ANOVA and Turkey’s multiple comparisons test comparing treatment groups at day 30, with p-values indicated in the figure. C Kaplan-Meier plot shows survival upon treatment. Significance between groups was tested by the Log-rank (Mantel-Cox) test, with p-values indicated in the figure. D Experimental schedule of hIL-15 NOG xenograft model. On day 0, hIL-15 NOG mice (n = 32 mice, 8 mice/group) received 1.2 Gy irradiation, followed by IV injection of 1 × 106 EOL-1_Luc cells four hours later. Three days after tumor cell inoculation, mice were randomized according to body weight (8 mice/group) and received vehicle, AFM28 (3 mg/kg), NK cells (5 × 106) or AFM28-armed NK cells (5 × 106) twice per week for a total of 3 weeks. Cryopreserved cytokine-expanded NK cells were generated by a standardized protocol (see Supplementary Methods and Supplementary Fig. 7). BLI measurements were performed every week starting day 6. Dotted lines represent treatment days. E Tumor growth represented by in vivo luciferase expression upon treatment is shown as photons per second in a linear scale. Data are represented as mean ± SD (n = 32 mice, 8 mice/group). Significance was tested by two-way ANOVA and Turkey’s multiple comparisons test comparing treatment groups at day 20, with p-values indicated in the figure. BIW twice per week; BLI bioluminescence imaging; D day; hCD16A human CD16A; IV intravenous; Luc luciferase.
Fig. 7
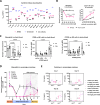
Fig. 7. AFM28 induces basophil depletion and shows a lower cytokine release than a T cell-engager.
A Comparison of cytokine release from primary human leukocytes treated with AFM28, a CD123/CD3 T cell engager or without antibody (w/o) after 24 h incubation. Emax denotes maximal induction of the respective cytokine. Cytokines were measured using the Luminex 24-plex human cytokine panel (only the 16 induced cytokines are shown). Individual data from two donors are shown. B Dose-dependent depletion of CD123+ basophils and dose-dependent changes in CD137 expression on NK cells after 24 h incubation of primary human leukocytes in the presence of titrated AFM28 or RSV/CD16A control engager (for further details and gating strategy see Supplementary Fig. 5B). Data are represented as mean ± SD of six donors and were analyzed using two-way ANOVA and Šídák’s multiple comparisons test. C Circulating healthy donor whole blood loops in the presence of titrated AFM28. Dose-dependent depletion of CD123+ peripheral blood basophils and dose-dependent changes in CD69 and CD16A expression on NK cells. The anti-CD16 3G8 antibody does not compete with AFM28 for CD16A binding, as further illustrated in Supplementary Fig. 6 and as previously shown for the innate cell engager acimtamig (AFM13) targeting the same CD16A epitope. For gating strategy see Supplementary Fig. 8. The E:T cell ratio between NK cells and basophils ranged between 2.1-9.2 amongst donors and did not correlate with the extend of basophil depletion. Individual data from n = 5 donors are shown (% remaining basophils, normalized versus formulation buffer). The population was normally distributed tested by the Shapiro-Wilk test, and significance was tested by two-way ANOVA and Turkey’s multiple comparisons test. Data are represented as mean ± SD. D AFM28 induces basophil depletion in cynomolgus monkeys, indicating PD activity towards CD123+ cells (gated as CD3/CD14/CD20/CD159a/HLADR/FcεR1a+). Basophil recovery after day 15 was concurrent with ADA presence and corresponding loss of exposure. Arrows indicate dosing occasions. Data are represented as mean ± SD (n = 36 animals; 10 animals per vehicle, 20 mg/kg and 100 mg/kg groups; 6 animals per 4 mg/kg group). E Increases in IL-6 levels upon treatment of cynomolgus monkeys (n = 36 animals; 10 animals per vehicle, 20 mg/kg and 100 mg/kg groups; 6 animals per 4 mg/kg group) with AFM28 were detected only at later dosing time points correlating with the onset of an ADA response, mostly at 4 and 20 mg/kg doses of AFM28. ADA anti-drug antibodies.

References

    1. Bonnet, D. & Dick, J. E. Human acute myeloid Leukemia is organized as a hierarchy that originates from a primitive hematopoietic cell. Nat. Med.3, 730–737 (1997). - PubMed
    1. Nilsson, L. et al. Isolation and characterization of hematopoietic progenitor/stem cells in 5q-deleted myelodysplastic syndromes: evidence for involvement at the hematopoietic stem cell level. Blood96, 2012–2021 (2000). - PubMed
    1. Arber, D. A. et al. International consensus classification of myeloid neoplasms and acute Leukemias: integrating morphologic, clinical, and genomic data. Blood140, 1200–1228 (2022). - PMC - PubMed
    1. National Cancer Institute. Cancer Stat Facts: Leukemia – Acute Myeloid Leukemia (AML). https://seer.cancer.gov/statfacts/html/amyl.html (2022).
    1. Stelmach, P. & Trumpp, A. Leukemic stem cells and therapy resistance in acute myeloid Leukemia. Haematologica108, 353–366 (2023). - PMC - PubMed

MeSH terms