. 2025 Aug 21;16(1):7819.
doi: 10.1038/s41467-025-63131-9.

Prefrontal cortex astrocytes modulate distinct neuronal populations to control anxiety-like behavior

Affiliations

Prefrontal cortex astrocytes modulate distinct neuronal populations to control anxiety-like behavior

Eunyoung Kim et al. Nat Commun. .

Abstract

Accumulating evidence has supported diverse regulatory functions of astrocytes in different neural circuits as well as various aspects of complex behaviors. However, little is known about how astrocytes regulate different neuronal subpopulations that are linked to specific behavioral aspects within a single brain region. Here, we show that astrocytes in the medial prefrontal cortex (mPFC) encode anxiogenic environmental cues in freely behaving mice. Silencing mPFC astrocyte Ca2+ signaling heightens anxiety-like behavior and triggers opposing functional responses in excitatory and inhibitory neurons. Moreover, neuronal subpopulations tuned to anxiety-like behavior are differentially modulated by mPFC astrocytes at single cell and network levels. Using cell type-specific proximity biotinylation approaches, we identified significant intracellular and intercellular proteomic alterations in mPFC astrocytes and at the astrocyte-neuron interface associated with anxiety. Collectively, our findings uncover mechanisms underpinning the heterogenous astrocyte-neuron interaction that is behaviorally relevant and offer critical insights into the pathophysiology of emotional disorders.


Conflict of interest statement

Competing interests: The authors declare no competing interests.

Figures

Fig. 1
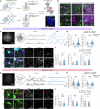
Fig. 1. mPFC astrocyte Ca2+ signaling is associated with anxiety-like behavior in vivo.
a Schematic of experimental design. b Immunohistochemistry (IHC) images and quantification showing the optic fiber implantation site in the mPFC and specific GCaMP6f expression in astrocytes. c Movement trajectory of a mouse during the EPM test. d Representative astrocyte Ca2+ traces with behavioral episodes. e Kymographs of astrocyte Ca2+ signals aligned with open and closed arm entries. f Left, average Ca2+ signal changes during the EPM test. Right, quantitative analysis of the area under the curve (AUC) showing a significant increase to open arm exploration. Two-sided two sample t-test, P < 0.0001. g Illustration of the EZM test. h Kymographs of astrocyte Ca2+ signals aligned with open and closed area entries. i Average Ca2+ signals and integrated responses showing Ca2+ elevation upon open area entries. Two-sided two sample t-test, P = 0.0056 (Closed → Open) and P = 0.036 (Open → Closed). j Illustration of T-maze spontaneous alternation test. k Kymographs of astrocyte Ca2+ signals aligned with goal arm entries. l Average Ca2+ signals and integrated responses showing similar changes between correct and error alternation. Two-sided Mann–Whitney test, P = 0.33. ****P < 0.0001, **P < 0.01, *P < 0.05, n.s. not significant, mean ± SEM. Source data are provided as a Source Data file.
Fig. 2
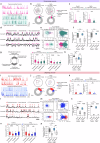
Fig. 2. Reducing Ca2+ signaling of mPFC astrocyte enhances anxiety-like behavior.
a Hypothetical models being tested. b Schematic of experimental design. c, d IHC images and quantification showing astrocyte specificity of CalEx expression in the mPFC. e Representative images of spontaneous Ca2+ activities of mPFC astrocyte from the control (left) and the CalEx (right) mice, where somata, major branches, and territories are outlined (n = 4 mice for control and n = 4 mice for CalEx). f Representative Ca2+ traces from the somata of mPFC astrocytes and frequency analysis of spontaneous Ca2+ signals. Two-sided Mann–Whitney test, P = 0.00058 for somata, P < 0.0001 for major branches, and P < 0.0001 for territories. g Image projections of Ca2+ events from mPFC astrocytes of the control (left) and the CalEx (right) mice over 300 s (n = 4 mice for control and n = 4 mice for CalEx). h Distribution of temporal and spatial density of astrocyte Ca2+ events. Kolmogorov-Smirnov test, P < 0.0001 for both temporal and spatial density. i Kymographs of astrocyte Ca2+ signals in CalEx mice aligned with open and closed area entries in the EPM test. j Average Ca2+ signals and integrated responses showing little astrocyte Ca2+ changes in CalEx mice. Two-sided two sample t-test, P = 0.27. k Locomotion trajectories in the OFT over 10 min. l Travel distance over 20 min of control and CalEx mice. Two-way repeated-measures ANOVA with Bonferroni post hoc correction (left), P = 0.16, two-sided two sample t-test (right), P = 0.18. m Time spent in the center over 20 min showing that CalEx mice spent significantly less time spent in the center. Two-way repeated-measures ANOVA with Bonferroni post hoc correction (left), P < 0.0001, two-sided two sample t-test (right), P = 0.0089. n Representative behavioral annotations in the EPM. o Duration and number of entries of the open and closed arms in the EPM. Two-sided two sample t-test for entry number, P = 0.0065 (open arm) and P = 0.89 (closed arm), two-sided Mann–Whitney test for time spent in each arm, P = 0.019 (open arm) and P = 0.18 (closed arm). p Representative behavioral annotations in the EZM. q Duration and number of entries of the open and closed areas in the EZM. Two-sided two sample t-test for time spent in each area, P = 0.029 (open area) and P = 0.029 (closed area), two-sided two sample t-test for entry number, P = 0.22 (open area) and P = 0.25 (closed area). ****P < 0.0001, ***P < 0.001, **P < 0.01, *P < 0.05, n.s. = not significant, mean ± SEM. Source data are provided as a Source Data file.
Fig. 3
Fig. 3. Opposite changes of excitatory and inhibitory neuronal activities by silencing mPFC astrocytes.
a Schematic of experimental design. b IHC images showing GCaMP6f expression in glutamatergic (n = 8 mice) and GABAergic neurons (n = 11 mice). c and g Example field of view and Ca2+ traces from glutamatergic (c) and GABAergic (g) neurons in the mPFC. For glutamatergic neurons, n = 4 mice for control and n = 4 for CalEx. For GABAergic neurons, n = 5 for control and n = 6 for CalEx. d and h Violin plots of the mean activity of glutamatergic (d) and GABAergic (h) neurons in control and CalEx mice during open area and closed area exploration. For d Two-sided Mann–Whitney test, P = 0.0839 (open area), P < 0.0001 (closed area). For h Two-sided Mann–Whitney test, P < 0.0001 (open area), P < 0.0001 (closed area). e Confocal images and reconstruction for excitatory synapses. White arrows indicate the colocalization of VGLUT1 and PSD95. f Puncta density (per 10 μm3) of VGLUT1, PSD95, and the colocalization of VGLUT1 and PSD95. Two-sided two sample t-test for PSD95, P = 0.013, two-sided Mann–Whitney test for VGLUT1 and VGLUT + PSD95, P = 0.0052 (VGLUT1) and P = 0.011 (VGLUT1 + PSD95). i Confocal images and reconstruction for inhibitory synapses. White arrows indicate the colocalization of VGAT and GPHN. j Puncta density (per 10 μm3) of VGAT, GPHN, and the colocalization of VGAT and GPHN. Two-sided two sample t-test for VGAT and GPHN, P < 0.0001 for both VGAT and GPHN, two-sided Mann–Whitney test for VGAT + GPHN and colocalized puncta, P = 0.046. ****P < 0.0001, **P < 0.01, *P < 0.05, n.s. not significant, mean ± SEM except the violin plots in (d and h), where the center dots represent the median, the box limits correspond to the 25th and 75th percentiles, the whiskers extend to 1.5 times the interquartile range (IQR). Source data are provided as a Source Data file.
Fig. 4
Fig. 4. Distinct changes of excitatory and inhibitory neuronal subpopulations encoding anxiety-like behavior.
a and i Representative Ca2+ traces of glutamatergic (a) and GABAergic (i) neurons tuned to open and closed areas in the EZM test. b and j Example field of view and the distribution of glutamatergic (b) and GABAergic (j) neurons tuned to open and closed areas. c and k Mean activities of tuned glutamatergic (c) and GABAergic (k) neurons. For tuned glutamatergic neurons, two-sided Mann–Whitney test for control, P = 0.032 and two-sided two sample t-test with welch correction for CalEx, P = 0.0059. For tuned GABAergic neurons, two-sided Mann–Whitney test for control (P = 0.70) and CalEx (P = 0.0019). d and l Fisher Linear Discriminant (FLD) decoders trained to predict open area intervals and actual intervals for glutamatergic (d) and GABAergic (l) neurons. Traces showing FLD projection vectors, which represent a learned weighted average of all the neurons’ Ca2+ signal values for each time point (the direction of the transformation is arbitrary). e and m Scatter plots of FLD projections for shuffled and actual data for glutamatergic (e) and GABAergic (m) neurons. f and n Accuracy and performance (auROC) of FLD decoders for actual and shuffled data for glutamatergic (f) and GABAergic (n) neurons. For glutamatergic neurons, two-sided two sample t-test with Welch correction. Accuracy, P = 0.019 (control vs. shuffled), P = 0.016 (CalEx vs. shuffled), and P = 0.92 (control vs. CalEx); auROC, P = 0.016 (control vs. shuffled), P = 0.00012 (CalEx vs. shuffled), and P = 0.48 (control vs. CalEx). For GABAergic neurons, two-sided two sample t-test with Welch correction for accuracy, P < 0.0001 (control vs. shuffled), P < 0.0001 (CalEx vs. shuffled), and P = 0.48 (control vs. CalEx); for auROC, two-sided Mann–Whitney test for control vs. shuffled, P = 0.00041 and two-sided two sample t-test with Welch correction for CalEx vs. shuffled, P < 0.0001 and control vs. CalEx, P = 0.27. g and o Schematic of the EZM with transition and non-transition zones labeled and amplitude of Ca2+ signals of tuned glutamatergic (g) and GABAergic (o) neurons during transition and non-transition zones. Two-sided Mann–Whitney test for all groups. For glutamatergic neurons, P < 0.0001 (control-open transition vs. non-transition), P = 0.04 (control-closed transition vs. non-transition), P < 0.0001 (CalEx-open transition vs. non-transition), P = 0.067 (CalEx-closed transition vs. non-transition). For GABAergic neurons, P < 0.0001 (control-open transition vs. non-transition), P = 0.026 (control-closed transition vs. non-transition), P < 0.0001 (CalEx-open transition vs. non-transition), P = 0.0024 (CalEx-closed transition vs. non-transition). h and p Accuracy of random forest decoders for actual and shuffled data for glutamatergic (h) and GABAergic (p) neurons. Two-sided Mann–Whitney test for all groups. For glutamatergic neurons, P = 0.0027 (control vs. shuffled), P = 0.07 (CalEx vs. shuffled), and P = 0.02 (control vs. CalEx) and for GABAergic neurons, P = 0.012 (control vs. shuffled), P = 0.0071 (CalEx vs. shuffled), and P = 0.34 (control vs. CalEx). For panels f–h, n = 4 for control and n = 4 for CalEx; for n–p n = 5 for control and n = 6 for CalEx. ****P < 0.0001, ***P < 0.001, **P < 0.01, *P < 0.05, n.s. not significant, mean ± SEM except the box plots in panels fh, np, where the center lines represent the median, the box limits correspond to the 25th and 75th percentiles, the whiskers extend to 1.5 times the interquartile range (IQR), and the points represent outliers. Source data are provided as a Source Data file.
Fig. 5
Fig. 5. Astrocyte-specific proteomes reveals cytosolic changes by silencing Ca2+ signaling.
a Schematic of the astrocyte cytosolic-TurboID approach and experimental procedure. b IHC images showing strong streptavidin signals localized with astrocyte marker S100β in the mPFC (n = 3 mice for control and n = 3 mice for Astro-cyto-TurboID). c Venn diagram depicting the numbers of proteins identified in control and CalEx mPFC astrocytes. d Left, protein network analysis map of the top 100 most abundant common proteins. Node size and color represent protein expression fold change between CalEx and control. Edges represent protein association network from the STRING analysis. Right, networks of proteins highlighted for key biological processes of astrocytes. e Volcano plots showing unique and common astrocyte proteins. Differentially expressed common proteins are separated by dotted lines (P < 0.05). f Heatmap showing differentially regulated proteins with a fold change greater than 2, with annotation of primary functions. g Heatmap showing the abundance (average peak area) of selected unique proteins related to GPCRs, neurotransmitter and ion transport, synapse regulation, Ca2+-dependent vesicle release, cell adhesion and lipid metabolism. h Gene Ontology (GO) terms for significant biological pathways of unique proteins detected in mPFC astrocytes. Two-sided two sample t-tests were used for all statistical comparisons of the proteomic data. Source data are provided in Supplementary Data 1.
Fig. 6
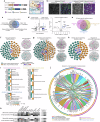
Fig. 6. Astrocyte-neuron interface proteomes identifies cell-specific changes.
a Schematic of the split-TurboID approach. b IHC images showing streptavidin signals associated with split-TurboID expression (n = 2 mice for Astrocyte-C-TurboID and n = 3 mice for Astrocyte-C-TurboID + Neuron-N-TurboID). c Venn diagram depicting the numbers of interface proteins identified in control and CalEx mPFC samples. d Volcano plots showing unique and common interface proteins. Differentially regulated proteins are separated by dotted lines (P < 0.05). e Venn diagram depicting the numbers of identified cell type-specific interface proteins. fh Protein network analysis maps of differentially regulated interface proteins and unique interface proteins expressed in astrocytes (f) excitatory neurons (g) and inhibitory neurons (h) with proteins highlighted for biological processes with high confidence scores. Node size and color represent protein expression fold change. Edges represent protein association network from the STRING analysis. i Heatmaps showing the protein abundance (average peak area) and functions of interface proteins that are specifically identified in astrocytes, excitatory neurons, and inhibitory neurons. j Chord diagram of interaction pairs between interface proteins identified in astrocytes, excitatory neurons, and inhibitory neurons. k Heatmaps showing enrichment of identified cytosolic and interface proteins across various diseases associated with prefrontal dysfunction. OCD, obsessive-compulsive disorder; ASD, autism spectrum disorders; PTSD, post-traumatic stress disorder; ADHD, attention-deficit/hyperactivity disorder; BPD, borderline personality disorder; AD, Alzheimer’s disease; MS, multiple sclerosis. Two-sided two sample t-tests were used for all statistical comparisons of the proteomic data. Source data are provided in Supplementary Data 2.

References

    1. Logue, S. F. & Gould, T. J. The neural and genetic basis of executive function: attention, cognitive flexibility, and response inhibition. Pharm. Biochem Behav.123, 45–54 (2014). - PMC - PubMed
    1. Stuss, D. T. & Alexander, M. P. Executive functions and the frontal lobes: a conceptual view. Psychol. Res63, 289–298 (2000). - PubMed
    1. Tovote, P., Fadok, J. P. & Luthi, A. Neuronal circuits for fear and anxiety. Nat. Rev. Neurosci.16, 317–331 (2015). - PubMed
    1. Calhoon, G. G. & Tye, K. M. Resolving the neural circuits of anxiety. Nat. Neurosci.18, 1394–1404 (2015). - PMC - PubMed
    1. Myers-Schulz, B. & Koenigs, M. Functional anatomy of ventromedial prefrontal cortex: implications for mood and anxiety disorders. Mol. Psychiatry17, 132–141 (2012). - PMC - PubMed