. 2025 Oct;44(19):5244-5289.
doi: 10.1038/s44318-025-00540-y. Epub 2025 Aug 21.

Programmed cell revival from imminent cell death enhances tissue repair and regeneration

Affiliations

Programmed cell revival from imminent cell death enhances tissue repair and regeneration

Kollori Dhar et al. EMBO J. 2025 Oct.

Abstract

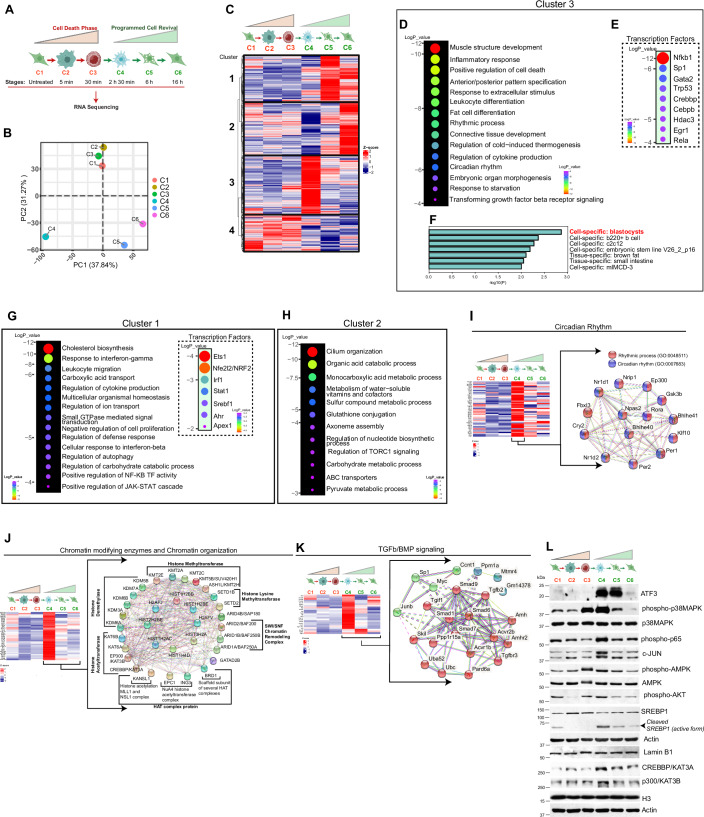
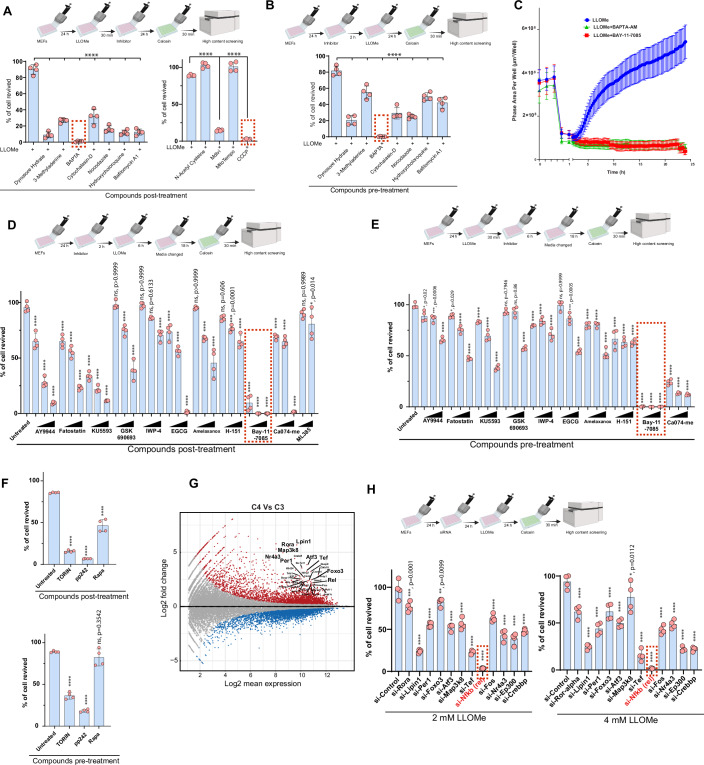
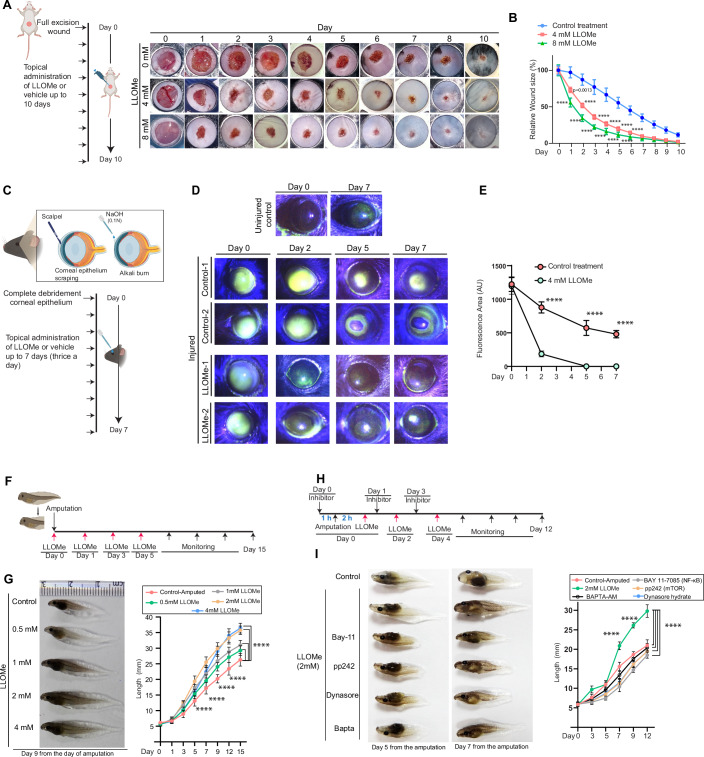
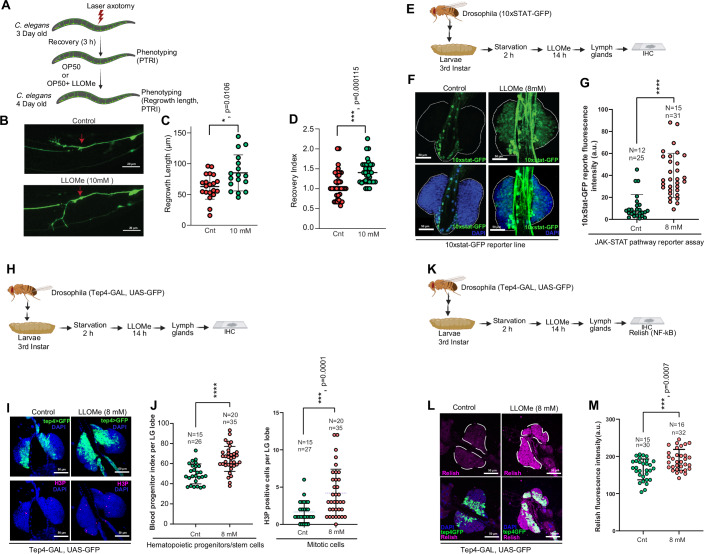
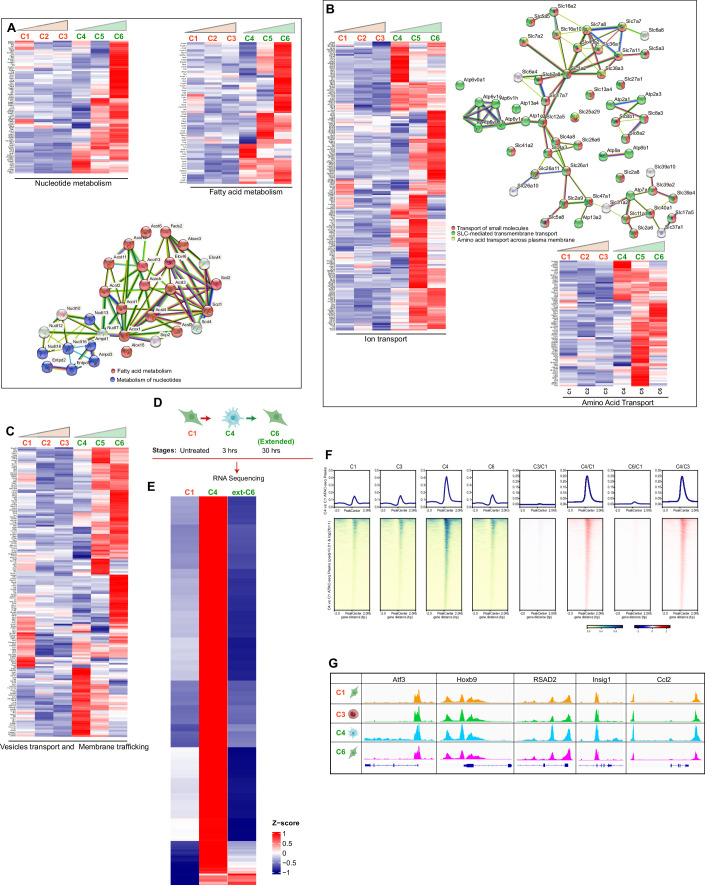
Cell recovery from near-death states is a critical yet poorly understood aspect of cell biology. Here, we describe a tightly-regulated programmed cell revival process after exposure of cells to cell death-inducing lysosomotropic agents, such as L-leucyl-L-leucine methyl ester (LLOMe). In the initial stage of cell recovery, we observe increased chromatin accessibility and upregulation of genes and pathways associated with embryonic development, regeneration, stemness, and inflammation. Subsequently, vital pathways governing metabolism, organelle biogenesis, membrane trafficking, transport, and cytoskeleton remodeling are activated, resulting in the complete renewal of cells. Consistent with the links of this transcriptional profile to tissue repair and regeneration, we found LLOMe to enhance the healing of skin wounds and corneal alkali burns in mice, promote hematopoietic progenitor/stem cell production in Drosophila melanogaster, induce tadpole tail regeneration in frogs, and mediate axon regeneration in Caenorhabditis elegans. Using both genetic and pharmacological approaches, we show NF-ĸB signaling to be critical for both cell revival and regeneration. This study characterizes cell revival from near-death conditions as a programmed cell-intrinsic mechanism, which could be harnessed for therapeutic applications in regenerative medicine.

Keywords: Anastasis; LLOMe; Lysosomal Cell Death and Revival; NF-ĸB Signaling in Cell Revival and Regeneration; Programmed Cell Revival.


Conflict of interest statement

Disclosure and competing interests statement. The authors declare no competing interests.

Figures

Figure 1
Figure 1. Cells revive from apoptosis-like conditions.
(A) Snapshots of time-lapse live microscopy images of MEF cells treated with 4 mM LLOMe. Magnification 40X. Scale Bar, 100 µm. Lower images are digital magnification. Refer to Movie EV1. (B) Upon treatment of cells with sublethal LLOMe concentrations, the cells revive back from apoptosis-like conditions. The process is divided into 6 phases (C1–C6 stages) based on observed morphological changes. The schematic depicts cell morphology at each stage. (C) The graphs depict quantification of phase area per well (area of well covered by cell) from time-lapse live microscopy of MEF cells treated with LLOMe (2 and 4 mM) (refer to Movie EV2). (D) LLOMe (4 mM) or GPN (200 µM) (refer to Movie EV5). (E) LLOMe (4 mM) or sphingosine (15 µM) (refer to Movie EV6), performed using IncuCyte S3. Mean ± SD, nine fields. The drop in the line represents an increase in floating cells and a reduction in confluency (phase area) in wells. (F) MEF cells were treated with different lysosomotrophic agents, and floating cells were collected and washed before replating in another dish. Graphs represent the percentage of floating cells (left panel) and the percentage of cells that revived (right panel) upon replating from a representative experiment. (G) Representative flow cytometry analysis of MEF cells treated with 4 mM LLOMe for 30 min or 16 h (with or without cycloheximide) and stained with Annexin V-FITC and Propidium Iodide (PI). (HJ) Snapshots of representative live cell confocal microscopy of MEF cells treated with LLOMe (4 or 12 mM) for 30 min and stained with (H) Annexin V-FITC (green) and hoechst (blue), Scale Bar, 5 µm, zoom images are digital magnification (I) Annexin V-FITC (green), DIL (red) and DAPI (Blue), Scale Bar, 5 µm (J) Annexin V-FITC (green), ethidium homodimer-1 (EthD-1) (red), and hoechst (blue), Scale Bar, 2 µm. Zoom panels are digitally magnified images. (K) Snapshots of representative live cell confocal microscopy of MEF cells that were stained with Rhod-2 AM (calcium indicator, red) and Mitotracker (mitochondrial marker, green) and treated with 4 mM LLOMe at the indicated time points (0 min, 5 min, and 6 h). Scale Bar, 5 or 7.5 µm as indicated. Zoom panels are digitally magnified images. The 0 min image is part of the EV2K control image. (L, M) Western blot analysis with the lysate of MEF cells treated with 4 mM LLOMe at different time points, with indicated (L) apoptosis or (M) necroptosis marker antibodies. Source data are available online for this figure.
Figure 2
Figure 2. Organelle dynamics during cell death and the resuscitation phase.
(A) Schematic shows the stages at which confocal microscopy is performed to understand changes in cell organelle states and morphology. (BD) Representative confocal microscopy images of MEF cells treated with 4 mM LLOMe for the indicated time points and immunostained with (B) α-tubulin (microtubules) or TOM20 (mitochondria) or RCAS1 (Golgi complex), (C) EEA1 (early endosomes), (D) Rab7 (late endosomes) and lysosomes are stained with lysotracker red. The nucleus is stained with DAPI (pseudo-colored to red or green in some panels for better contrast). Zoom panels show digital magnifications. Scale Bar, 2.5 to 7.5 µm as described in the figures. (EG) Representative confocal microscopy images of MEF cells treated with 4 mM LLOMe for 6 h and cells were stained with (E) lysotracker red, followed by fixation and immunostaining with anti-Rab7 (green), (F) Magic Red (cathepsin-B activity) and lysotracker green, (G) Mitotracker green and lysotracker red. Zoom panels are digital magnifications. (H, I) Left panels, flow cytometry analysis of mitochondrial membrane potential using JC-1 dye in MEF cells treated with 4 mM LLOMe at the indicated time points. Right panel, the bar graph shows the quantification of JC-1 data at the indicated time points (n = 3, mean ± SD, ****p < 0.0001, #not significant (ns) p = 0.9721, ordinary one-way ANOVA with Tukey’s multiple comparison test). Source data are available online for this figure.
Figure 3
Figure 3. Transcriptome analysis of programmed cell revival.
(A) RNA sequencing experiment (n = 3 biological replicates) is performed with MEF cells treated with 4 mM LLOMe at the indicated six-time points (C1–C6) with three biological replicates. (B) Principal component analysis (PCA) of RNA sequencing data (p < 0.05, n = 3) showing the transcriptional changes in MEF cells at different stages of LLOMe treatment. (C) Hierarchical clustering heatmap of differentially expressed genes (p < 0.05, >1.5 folds, ≤0.6 folds, Wald chi-squared test, n = 3) across all six time points (C1–C6). The z-scores represent the relative expression levels. (D, E) The cluster 3 genes from panel C were subjected to (D) Metascape pathway analysis or (E) Metascape TRRUST analysis for transcription factors. The top pathways (metascape) or top transcription factors (TRRUST) were depicted by a bubble plot. The size of each bubble represents the significance levels (log p value). (F) The cluster 3 genes were subjected to enrichment analysis in PaGenBase using the Metascape analysis tool. The graph represents the top gene signature of cell or tissue type obtained from cluster 3 genes. (G, H) The cluster 1 or cluster 2 genes were subjected to Metascape pathway analysis (left panel) or TRRUST analysis (right panel) and the top pathways or top transcription factors were depicted by a bubble plot. The size of each bubble represents the significance (log p value). (IK) Left panel, heatmap generated for genes representing GO terms (I) circadian rhythm, (J) Chromatin-modifying enzymes and chromatin organization, (K) TGFb/BMP signaling, induced (p < 0.05, >1.5 folds, ≤0.6 folds, base mean >10, Wald chi-squared test, n = 3) in C4 to C6 stages compared to C3 stage. Right panel, STRING analysis of core genes of the pathway. (L) Western blot analysis with the lysate of MEF cells treated with 4 mM LLOMe for indicated time points with indicated antibodies. Source data are available online for this figure.
Figure 4
Figure 4. The ATAC-seq analysis during cell death and resuscitation phase.
(A) ATAC sequencing experiment is performed with MEF cells treated with 4 mM LLOMe at the indicated four time points (C1, C3, C4, C6) with two biological replicates. (B) Correlation plot showing the principal component analysis (PCA) of ATAC sequencing data of all differential accessible peaks in MEF cells at different stages of LLOMe treatment (C1, C3, C4, and C6). (C) Volcano plot depicting the change in DNA accessibility between untreated and 30 min post treatment (C3 vs C1); untreated and 3 h post treatment (C4 vs C1); 30 min post treatment and 3 h post treatment (C4 vs C3); untreated and 30 h post treatment (C6 vs C1). (Points indicated are the peaks with differential accessibility, red points indicate the loci with an increase in accessibility (padj < 0.01, log2foldchange >2, n = 2) and blue points indicate the loci with an increase in accessibility (padj < 0.01, log2foldchange <−2, n = 2). (Numbers indicated are the differential peaks with a cut-off) (p value: Wald test; adj p value: Benjamini–Hochberg test). (D, E) The peaks with an increase in accessibility at C4 compared to C3 (padj < 0.01, log2foldchange >2) (p value: Wald test; adj p value: Benjamini–Hochberg test) were subjected to (D) Metascape pathway analysis and TRRUST analysis, and the top pathways or top transcription factors were depicted by a bubble plot. The size of each bubble represents the significance (log p value) and (E) Reactome pathway analysis; the top pathways or top transcription factors were depicted by a bubble plot. (F) Homer motif analysis was performed on the significant peaks with an increase in accessibility at stage C4 compared to C3. The top identified known motifs of the transcription factors were represented along with the significance (p value).(padj < 0.01, log2foldchange <−2, n = 2). (p value: Wald test; adj p value: Benjamini–Hochberg test). Full list of TFs is shown in Appendix Table S1. (G) The accessibility of RelA (p65) ChIP sequencing peaks (GSE132792_RelA_peaks.bed.gz) were compared and plotted at different stages of LLOMe treatment to MEF cells (C1, C3, C4, and C6). The ATAC-seq signal at p65 ChIP-seq peaks in C1, C3, C3/C1, C4, C4/C1, C4/C3, C6, and C6/C1, are plotted as heatmaps with RelA ChIP-seq peaks (GSM3892239) in the first row. (The heatmaps represent a 4 kb window, centered on the peak midpoint and sorted based on the C4 compared to RelA ChIP-seq peaks). On top are the metaplots representing average profiles of ATAC-seq signal at RelA ChIP-seq peaks in the respective condition.
Figure 5
Figure 5. The pathways/genes critical for programmed cell revival.
(A, B) Top panels, schematic representation of the experimental design. The MEFs were either treated with inhibitors (A) after 4 mM LLOMe exposure or (B) before 4 mM LLOMe exposure, followed by staining with live cell dye Calcein-AM and quantification was performed using high content screening. Bottom panel, Graph depicts the percentage of MEF cells revived (****p < 0.0001, mean ± SD, n = 4, 25 fields/well, one-way ANOVA, Dunnett’s multiple comparison test). (C) Time-lapse live microscopy performed using IncuCyte S3 (refer to Movies EV1 13, 14) of MEF cells treated with BAPTA-AM (Calcium chelator) or BAY-11-7085 (NF-κB inhibitor) after 4 mM LLOMe exposure. The graph depicts quantification of phase (cell covered) area per well (µm²/well), Mean ± SD, nine fields. The drop in line represents increased floating cells and reduced confluency (phase area) in wells. (DF) Top panel, schematic representation of the experimental design where MEFs were either treated with inhibitors (D, F) after 4 mM LLOMe exposure or (E, F) before 4 mM LLOMe exposure, followed by staining with live cell dye Calcein-AM and quantification was performed using high-content screening microscopy. Bottom panel, the graph depicts the percentage of MEF cells revived. mean ± SD, *p < 0.05, ***p < 0.001, ****p < 0.0001, ns non-significant, n = 4, 25 fields/well, one-way ANOVA, Tukey’s multiple comparison test. Exact p values are depicted in the Figure and Appendix Table S2. (G) MA-plot analysis represents log2 fold-change versus log2 mean expression between the C3 stage and the C4 stage transcriptome. Each dot is a gene, and the genes that are differentially expressed (p < 0.05, Wald chi-squared test) are highlighted in red (upregulated in C4 stage) or blue (downregulated in C4 stage). The topmost induced genes at the C4 stage compared to the C3 stage are labeled, and some important genes among them are bolded. (H) The MEF cells were subjected to siRNA knockdown for a few of the topmost induced genes (from panel G) and treated with 2 or 4 mM LLOMe, followed by staining with live cell dye Calcein-AM, and quantification was performed using high-content screening. Bottom panels, Graph depicts the percentage of MEF cells revived (*p = 0.0112, **p = 0.0099, ***p = 0.0001, ****p < 0.0001, mean ± SD, n = 4, 25 fields/well, one-way ANOVA, Tukey’s multiple comparison test). Exact p values are depicted in the Figure and Appendix Table S2. Source data are available online for this figure.
Figure 6
Figure 6. LLOMe accelerates wound healing and tadpole tail regeneration.
(A) Left panel schematic depicting the experimental design and the timeline of topical administration of LLOMe or vehicle control. Right panel, representative images showing wound healing in mice skin after full excision wound and topical treatment with 4 or 8 mM LLOMe or vehicle control. (B) Graph depicting the relative wound size for vehicle control and LLOMe (4 or 8 mM) treated wounds. (**p = 0.0013, ****p < 0.0001, mean ± SD, n = 3, two-way ANOVA, Dunnett multiple comparison test). (C) Schematic depicting the experimental design and the timeline of topical administration of LLOMe or vehicle control. (D) Representative fluorescent images of uninjured controls, injured controls, and 4 mM LLOMe-treated mouse eyes at days 0, 2, 5, and 7. (E) The graph depicts the relative fluorescence area of injured control and LLOMe-treated mouse eyes. (****p < 0.0001, mean ± SD, n = 3, two-way ANOVA, Sidak multiple comparison test). (F) Schematic depicting the experimental timeline for LLOMe treatment and monitoring the tail regeneration in tadpole larvae. (G) Representative images of tail regeneration in tadpoles after treatment with the indicated concentration of LLOMe on day 9 from the day of amputation. The graph depicts the tail length upon treatment with the indicated concentrations of LLOMe and time. (****p < 0.0001, mean ± SD, n = 15, two-way ANOVA, Dunnett multiple comparison test). (H) Schematic depicting the experimental timeline for LLOMe and inhibitor treatments and monitoring the tail regeneration in tadpole larvae. (I) Representative images of tail regeneration in tadpoles after treatment with LLOMe (2 mM) and inhibitors at days 5 and 7 from the day of amputation. The graph depicts the tail length upon treatment with LLOMe alone or with the indicated inhibitors over the indicated period of time. (****p < 0.0001, mean ± SD, n = 10, two-way ANOVA, Dunnett multiple comparison test). Source data are available online for this figure.
Figure 7
Figure 7. LLOMe accelerates axon regeneration and stemness.
(A) Schematics representing axotomy and treatment plan of C. elegans for evaluating phenotypes of axon regeneration and posterior touch response index (PTRI). (B) Representative images showing axon regeneration after LLOMe (10 mM) treatment in C. elegans. The red arrow indicates the axotomy position. (C) The bar graph depicts regrowth length 24 h after axotomy. (*p = 0.0106, mean ± SD, N = 4, n = 17–20, unpaired T-test). (D) The bar graph shows an improved recovery index after LLOMe treatment. (***p = 0.000115, mean ± SD, N = 3, n = 35–38, unpaired T-test). Scale Bar, 20 µm. Exact p values are depicted in the Figure and Appendix Table S2. (E) Schematic depicting the experimental timeline of LLOMe treatment of Drosophila (10xSTAT-GFP) third instar larva. (F) Representative immunohistochemistry confocal images of Drosophila third instar larval lymph gland showing (top panels) JAK/STAT pathway activation. (G) The graphs depict 10xSTAT-GFP reporter fluorescence intensity. (****p < 0.0001, mean ± SD, two-tailed unpaired Student’s t-test, Welch’s correction, N (number of larvae) for control is 12 and n (number of lobes) is 25, whereas N for LLOMe treated is 15 and n is 31. Scale Bar, 50 µm. Exact p values are depicted in the Figure and Appendix Table S2. (H) Schematic depicting the experimental timeline of LLOMe treatment of Drosophila (Tep4-Gal4, UAS-GFP) 3rd instar larva. (I) Representative immunohistochemistry (IHC) confocal images of larval lymph gland showing (tep4 (Tep4-Gal4, UAS-GFP, indicated as Tep4>GFP) positive core hematopoietic progenitors and phospho-histone H3 (H3P, Serine 10) positive mitotically active cells. (J) The graphs depict blood progenitor index per lymph gland lobe or H3P-positive cells per lobe. ***p = 0.0001, ****p < 0.0001, mean ± SD, two-tailed unpaired Student’s t-test, Welch’s correction, N (number of larvae) and n (number of lobes). Scale Bar, 50 µm. Exact p values are depicted in the Figure and Appendix Table S2. (K) Schematic depicting the experimental timeline of LLOMe treatment of Drosophila (Tep4-Gal4, UAS-GFP) 3rd instar larva, followed by IHC with Relish antibody. (L) Representative IHC confocal images with Relish antibody. (M) The graph depicts Relish fluorescence intensity. ***p = 0.0007, mean ± SD, two-tailed unpaired Student’s t-test, Welch’s correction, N (number of larvae) and n (number of lobes). Scale Bar, 50 µm. Exact p values are depicted in the Figure and Appendix Table S2. Source data are available online for this figure.
Figure EV1
Figure EV1. Cells resuscitate from cell death-like conditions.
(A) Snapshots of time-lapse live microscopy images of MEF cells treated with 4 mM LLOMe. Magnification 10X. Scale bar, 400 µm. (B) MEF cells were treated with 4 mM LLOMe. The floating cells were collected and washed with PBS before plating in a new dish. Snapshot images of live microscopy of MEF cells after replating. Refer to Movie EV3. Dotted circles represent the revival of the indicated floating cells at the indicated time points. (C)The graph depicts the quantification of the percentage of the well covered by the object (area of the well covered by cells) from time-lapse live microscopy. (D) Representative time-lapse live microscopy images of MEF cells treated with GPN (200 µM), sphingosine (15 µM), LLOMe (4 mM), Siramesine (200 µM), Alum (1 mg/ml), and Silica (1200 µg/ml). Magnification 10X. Scale bar, 400 µm. (E) Representative time-lapse live microscopy images of different cell lines treated with LLOMe. (F) The table depicts the cell lines treated with LLOMe, the concentrations of LLOMe used, and the morphological changes. Magnification 40X. Scale bar, 100 µm. (G) Representative time-lapse live microscopy images of BMDMs cells treated with 0.25 and 0.5 mM LLOMe. Magnification 40X. Scale bar, 75 µm. Source data are available online for this figure.
Figure EV2
Figure EV2. Revival from near-cell death.
(A, B) Representative time-lapse live microscopy images of (A) primary MEF (C57BL/6 mouse) cells treated with 4 mM LLOMe and (B) primary cardiac fibroblast (C57BL/6 mouse) cells treated with 8 mM LLOMe. Magnification 10X. Scale Bar, 400 µm. (C) Time-lapse live microscopy of MEF cells stained with Lysotracker red (10 nM), washed, and then treated with 4 mM LLOMe, performed using IncuCyte S3. Graphs depict quantification of red objects (lysosomes-stained cells) per well, Mean ± SD, nine fields. (D, E) Representative live cell confocal microscopy images of MEF cells treated with LLOMe (4 or 12 mM) for 30 min and stained with (D) Annexin V-FITC (green), DIL (red) and DAPI (blue) (E) Annexin V-FITC (green), ethidium homodimer-1 (EthD-1) (red) and Hoechst (blue). Scale Bar, 5 µm. (F) IncuCyte time-lapse live microscopy of MEF cells stained with 2 µM EthD-1, washed and then treated with 4 mM LLOMe. Graphs depict quantification of red objects (lysosomes-stained cells) per well, mean ± SD, nine fields. Refer to Movie EV8. (G) Representative live cell confocal microscopy of MEF cells treated with LLOMe (4 or 12 mM) for 30 min and stained with Annexin V-FITC (green), and Propidium Iodide, PI (Red). Trypsinized floating cells were used as a control. Scale Bar, 5 µm. (H) Time-lapse live microscopy of MEF cells stained with 20 nM SYTOX Green and then treated with 4 mM LLOMe, performed using IncuCyte S3. Graphs depict quantification of green objects per well, mean ± SD, nine fields. Refer to Movie EV9. (I) Representative time-lapse live microscopy images of MEF cells treated with LLOMe (8 or 12 mM). Magnification 40X. Scale bar, 100 µm. (J) Representative flow cytometry analysis of MEF cells treated with 12 mM LLOMe for 30 min or 16 h and stained with Annexin V-APC and Propidium Iodide (PI). (K) Representative live cell confocal microscopy images of MEF cells, untreated or treated with 4 mM LLOMe for 30 min and stained with Annexin V-FITC (green), Mitotracker (red) and Hoechst (blue) as indicated. Scale Bar, 2 or 5 µm. Zoom panels show digital magnifications. (L, M) Western blot analysis with the lysate of (L) HEK293T cells with Caspase-3 and PARP-1, and (M) MEF cells with Caspase-1 and GSDMD antibodies at different time points. (N) Representative time-lapse live microscopy images of zVAD-FMK-treated MEF cells subjected to LLOMe (4 mM) treatment. Magnification 40X. Scale bar, 100 µm. Source data are available online for this figure.
Figure EV3
Figure EV3. Organelle dynamics during the cell death phase and revival.
(AC) Representative confocal microscopy images of MEF cells treated with 4 mM LLOMe for the indicated time points and immunostained with (A) ERp72 (endoplasmic reticulum), (B) RCAS1 (Golgi complex), and (C) LC3B (autophagosome). The nucleus is stained with DAPI (pseudo-colored to green in (B) for better contrast). Zoom panels show digital magnifications. Scale Bar, 3–10 µm as indicated. (D) Representative confocal microscopy images of MEF cells treated with 4 mM LLOMe for 2 h 30 min (C4 stage) and immunostained with LC3B (autophagosome). The nucleus is stained with DAPI (pseudo-colored to green for better contrast). Zoom panels show digital magnifications. Scale Bar, 10 µm. (E, F) Representative confocal microscopy images of MEF cells treated with 4 mM LLOMe for 16 h and immunostained with (E) Rab7 or stained with (F) lysotracker red. The nucleus is stained with DAPI (pseudo-colored to red/green for better contrast). Zoom panels show digital magnifications. Scale Bar, 3 or 25 µm as indicated. (GI) Representative confocal microscopy images of MEF cells treated with 4 mM LLOMe for 6 h and immunostained with (G) Rab7 (late endosomes) and stained with lysotracker red or (H) stained with magic red and lysotracker green or (I) stained with mitotracker green and lysotracker red. Zoom panels show digital magnifications. Scale Bar, 5 or 10 µm as indicated. (J) Representative confocal microscopy images of MEF cells treated with 4 mM LLOMe for 24 h post revival and stained with lysotracker red and immunostained with anti-Rab7 (late endosomes). The nucleus is stained with DAPI. Scale Bar, 5 µm. (K) Flow cytometry analysis of ROS production using CellROX Green in MEF cells treated with 4 mM LLOMe at the indicated time points. (L) Time-lapse live microscopy using IncuCyte of MEF cells stained with CellROX-red and then treated with 4 mM LLOMe. Graphs depict quantification of red object count per well, mean ± SD, nine fields. Source data are available online for this figure.
Figure EV4
Figure EV4. RNA-sequencing analysis of cell death and revival phase.
(AD) Bubble plots depict top pathways from metascape (A, C, D) and Reactome (B) pathway analysis performed with genes upregulated (padj < 0.05, >1.5 folds, n = 3, Wald chi-squared test) in C4 or C5 or C6 stage as compared to C3 stage. (EJ) Heatmap generated for genes representing GO terms (E) Cell Cycle (F) WNT Signaling, (G) NOTCH signaling, (H) Cholesterol/lipid biosynthesis processes, (I) Organelle biogenesis and maintenance, (J) Axon guidance induced (p < 0.05, >1.5 folds, ≤0.6 folds, base mean >10, n = 3, Wald chi-squared test) across C1 to C6 stage. STRING analysis of core genes of the pathway is also depicted.
Figure EV5
Figure EV5. Pathways of programmed cell revival.
(AC) Heatmap generated for genes (p < 0.05, >1.5 folds, base mean >10, n = 3, Wald chi-squared test) representing GO terms (A) Nucleotide and fatty acid metabolism. (B) Ion transport and amino acid transport. (C) Vesicles transport and membrane trafficking across different stages. (D) RNA sequencing experiment is performed with MEF cells treated with 4 mM LLOMe at the indicated three time points (C1, C4, and extended-C6) with three biological replicates. (E) The genes induced in the C4 stage (p < 0.05, >1.5 fold, see Dataset EV7) compared to the C1 stage was plotted across all three stages (C1, C4, and extended-C6). (F) The heatmaps represent the ATAC-seq signal intensities at loci with increased accessibility at C4 compared to C1 (padj<0.01, log2 foldchange >2) at different stages of 4 mM LLOMe treatment to MEF cells (C1, C3, C4, C6, C3/C1, C4/C1, C4/C3, and C6/C1). (The heatmaps represent a 4 kb window centered on the peak midpoint, and sorted based on the C4 enrichment compared to C1). (G) Genome browser screenshots of five selected genomic regions' signals in C1, C3, C4, and C6. (The blue bar at the bottom indicates the reference sequence (mm10) of the selected genomic regions).
Figure EV6
Figure EV6. LLOMe treatment does not make cells tumorigenic.
(A) Analysis of cell proliferation using MTT assays with MEF cells untreated or treated with 4 mM LLOMe for the indicated time points. (three technical replicates, mean ± SD). (B) Representative time-lapse live microscopy images of migration assays performed with control or 4 mM LLOMe-treated MEF cells at the indicated time points. Magnification 4X. Scale bar, 1000 µm. (C, D) Schematic representation of the experimental design where the same cells were given five cycles of 4 mM LLOMe treatment and plated for (C) clonogenic assays in each cycle. (D) Graph depicts the number of colonies from clonogenic assays (n = 3, mean ± SD, **p = 0.0014, ***p = 0.0008, ****p < 0.0001, ns non-significant p > 0.05, unpaired t-test). (E) Agarose gel image for genomic DNA isolated from control and 4 mM LLOMe-treated MEF cells for the indicated time points. (F) Comet assays were performed with MEF cells that were subjected to seven cycles of trypsinization (control) or LLOMe treatment. (G) Immunofluorescence experiments using γH2A.X antibody were performed with MEF cells that were subjected to seven cycles of trypsinization (control) or LLOMe treatment. (H) MEF cells that were subjected to seven cycles of trypsinization (control) or LLOMe treatment were injected into the flanks of mice (n = 6). (I) MEF cells that were exposed to seven cycles of trypsinization (control) or LLOMe treatment were subjected to senescence-associated β-galactosidase assays or Western blot with p21, p16ink4, and γH2A.X antibody. Source data are available online for this figure.
Figure EV7
Figure EV7. LLOMe induces wound healing and tissue regeneration.
(A) A qRT-PCR analysis of MEF cells treated with LLOMe for different time points as indicated in the figure (n = 3, mean ± SD, *p < 0.05, **p < 0.01, ***p < 0.001, ns non-significant p > 0.05, ordinary one-way ANOVA, Tukey’s multiple comparison test). Exact p values are depicted in the Figure and Appendix Table S2. (B) ELISA with supernatant of the MEF cells treated with LLOMe for different time points as indicated in the figure (n = 3, Mean ± SD, **p = 0.0067, ****p < 0.0001, ns non-significant p > 0.05, ordinary one-way ANOVA, Tukey’s multiple comparison test). Exact p values are depicted in the Figure and Appendix Table S2. (C) Top panel, representative images of a control tadpole tail and amputated tail on day 0. Bottom panel, representative images of untreated or LLOMe-treated amputated tails at the indicated time points. The red arrow indicates blastema formation. (DF) Flow cytometry analysis of (D) ROS production using CellROX Green, (E) lysosomes numbers using lysotracker, and (F) mitochondrial calcium using Rhod-2 AM in untreated and 4 mM LLOMe-treated regenerated tissue of tadpole at the indicated time points. Source data are available online for this figure.

References

    1. Alberts B, Johnson AD, Morgan D, Roberts K, Walter P, Raff MC, Lewis J (2014) Molecular biology of the cell. Garland Science, Taylor and Francis Group
    1. Andrews NW, Corrotte M (2018) Plasma membrane repair. Curr Biol 28:R392–R397 - PubMed
    1. Ankawa R, Goldberger N, Yosefzon Y, Koren E, Yusupova M, Rosner D, Feldman A, Baror-Sebban S, Buganim Y, Simon DJ et al (2021) Apoptotic cells represent a dynamic stem cell niche governing proliferation and tissue regeneration. Dev Cell 56:1900–1916.e1905 - PubMed
    1. Arnoult D (2007) Mitochondrial fragmentation in apoptosis. Trends Cell Biol 17:6–12 - PubMed
    1. Artlett CM (2013) Inflammasomes in wound healing and fibrosis. J Pathol 229:157–167 - PubMed

LinkOut - more resources