. 2025 Aug 21;16(1):7797.
doi: 10.1038/s41467-025-63025-w.

Integrating artificial intelligence and optogenetics for Parkinson's disease diagnosis and therapeutics in male mice

Affiliations

Integrating artificial intelligence and optogenetics for Parkinson's disease diagnosis and therapeutics in male mice

Bobae Hyeon et al. Nat Commun. .

Abstract

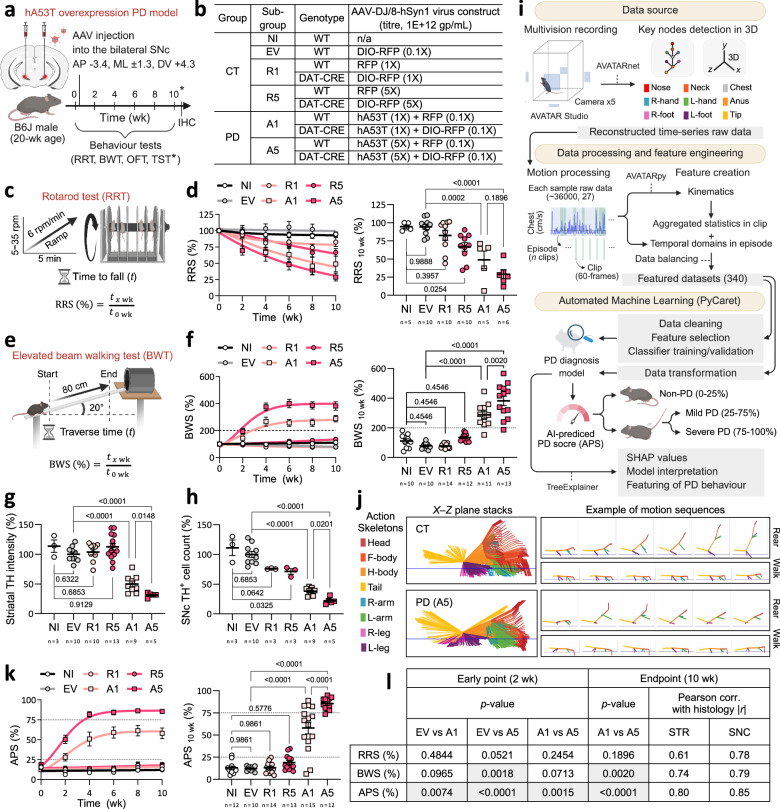
Parkinson's disease (PD), a progressive neurodegenerative disorder, presents complex motor symptoms and lacks effective disease-modifying treatments. Here we show that integrating artificial intelligence (AI) with optogenetic intervention, termed optoRET, modulating c-RET (REarranged during Transfection) signalling, enables task-independent behavioural assessments and therapeutic benefits in freely moving male AAV-hA53T mice. Utilising a 3D pose estimation technique, we developed tree-based AI models that detect PD severity cohorts earlier and with higher accuracy than conventional methods. Employing an explainable AI technique, we identified a comprehensive array of PD behavioural markers, encompassing gait and spectro-temporal features. Moreover, our AI-driven analysis highlights that optoRET effectively alleviates PD progression by improving limb coordination and locomotion and reducing chest tremor. Our study demonstrates the synergy of integrating AI and optogenetic techniques to provide an efficient diagnostic method with extensive behavioural evaluations and sets the stage for an innovative treatment strategy for PD.


Conflict of interest statement

Competing interests: The authors declare no competing interests.

Figures

Fig. 1
Fig. 1. AI-powered diagnosis in distinct severity cohorts of the hA53T PD mouse model.
a Schematic of the experimental setup for establishing the bilateral hA53T PD mouse model, highlighting stereotaxic injection sites into the SNc of B6J male mice. b Table summarising experimental groups: control (CT: NI, EV, R1, R5) and PD (A1, A5), detailing the AAV-DJ/8-hSyn1 constructs and doses. See Supplementary Table 1 for details. c, e Schematics of the rotarod test (RRT) and elevated beam walking test (BWT), indicating how the respective scores (RRS and BWS) are derived. d, f RRS and BWS comparisons between CT and PD groups shown as fitted line and dot plots, longitudinally (0–10 wk) and at the 10 wk endpoint. g, h Comparative histological analysis between CT and PD groups, showing striatal TH intensity (STR) and SNc cell counts (SNC), normalised to the EV group (%) at 10 wk. i Machine learning (ML) pipeline for developing an AI model to diagnose and assess PD severity. The AVATARnet architecture is adapted from YOLOv4 and modified to include 53 CNN layers. 3D coordinates are computed using triangulation and bundle-adjustment. AI techniques are indicated by dashed lines, with automated ML processes utilising PyCaret highlighted at the bottom. j Representative 3D reconstructed action skeletons of motion sequences in the X–Z plane from the CT and PD clusters, with the anus as the reference point. Skeleton images of motion sequences were sampled with a temporal offset: every 5 frames for rearing and 3 frames for walking. k Comparisons of XGB model predicted PD scores (AI-predicted PD scores, APS) between CT and PD groups (unseen mice), shown in fitted line and dot plots longitudinally (0–10 wk) and at the 10 wk endpoint. Dashed lines on the graphs indicate health status boundaries (%): non-PD (NP; 0–25), mild PD (25–75), and severe PD ( > 75). l Table summarising comparative results from behavioural assessments (RRS, BWS and APS). Significant p-values are highlighted by shading. Data are shown as mean ± SEM; sample sizes (n) are indicated in plots. All statistical analyses were performed using one-way ANOVA followed by Holm–Sidak post hoc corrections for multiple comparisons. Schematics were created in BioRender. Heo, W. (2025) https://BioRender.com/cykyauz. Source data are provided in the Source Data file.
Fig. 2
Fig. 2. Exploring PD phenotypes through top 20 behavioural features with insights from XGB model interpretation.
a Graphic summary of the top 20 features with schematics of key feature components. Features ranked by their global impact on the XGB model, depicted by blue horizontal bar graphs (from the validation dataset). The colour-coded boxes detail the feature-associated body parts and the PD symptomatic categories. The beeswarm plots (SHAP summary plot) offer local explanations for each feature, with individual dots representing motion clips. The position of each dot is determined by SHAP values (log odds of PD likelihood), reflecting its impact direction and magnitude on model prediction (negative and positive for non-PD [NP] and PD, respectively). The dot colour represents the magnitude of feature value. Clusters of dots denote the prevalence of a feature’s effect on the model output. Limb-associated features are further highlighted with shading. b Representative SHAP force plots for motion clips correctly classified as NP and PD, illustrating the integration of feature impacts on model predictions. Each plot aligns feature contributions (SHAP values) along the x-axis, culminating in the total effect denoted as f(x), with the main features annotated with their rank and feature values. Schematics were created in BioRender. Heo, W. (2025) https://BioRender.com/cykyauz.
Fig. 3
Fig. 3. Evaluation of optoRET in alleviating PD symptoms and neurodegeneration.
a Schematic of the experimental setup for optoRET treatment in PD mice. On the left side, timeline presents daily based room light and LED cage lid on/off times. The centre illustrates the automated LED cage lid control system, triggering the daily-based LED toggle signals at pre-set schedules. On the right side, the pre-set long-term light schedules are depicted: daily (S#1), biweekly (S#2), or alternate days (S#3). b Pie charts of health status of mice in non-PD (NP), mild, or severe PD statuses. Groups with optoRET unstimulated (dark) or stimulated with light schedules (S#1–3) are highlighted with grey or cyan background, respectively. c Comparisons of XGB model predicted PD scores (APS) between EV, A1, and A1O3 groups, shown in fitted line and dot plots longitudinally (0–10 wk) and at the 10 wk endpoint. d Representative TH-stained IHC images of forebrain and midbrain sections. Red boxes indicate the SNc regions shown in the magnified images on the right. e Comparative histological analysis between EV, A1, and A1O3 groups, showing striatal TH intensity (STR) and SNc cell counts (SNC), normalised to the EV group (%) at 10 wk (STR [left plots, %]: 100 ± 3.89, 50.07 ± 4.82, 87.18 ± 5.62; SNC [right plots, %]: 100 ± 5.17, 38.03 ± 2.08, 90.30 ± 7.84, respectively). f Pie charts, detailing the assessment of PD-affected features, treatment response evaluation (TRE), and PD symptomatic evaluation (PSE). Arrow in between the lower charts indicate the treated segment for further analysis, with feature counts noted in brackets. Data are shown as mean ± SEM; sample sizes (n) are indicated in plots. All statistical analyses were performed using one-way ANOVA, with Tukey’s post hoc correction in panel c and Holm–Sidak correction in panel d for multiple comparisons. Schematics were created in BioRender. Heo, W. (2025) https://BioRender.com/cykyauz. Source data are provided in the Source Data file. str striatum, SNc substantia nigra pars compacta, VTA ventral tegmental area, TH tyrosine hydroxylase. WNBN Wireless Network for Behavioural Neuroscience, BLE Bluetooth low energy.
Fig. 4
Fig. 4. Spectro-temporal insights into optoRET intervention, exploring tremor alleviation and movement complexities in PD.
a ML pipeline, highlighting the feature engineering process in the TSFEL model to identify key statistical and spectro-temporal features of PD behaviour. b Pie charts, detailing the evaluations of PD-affected features, treatment responses, and treated feature domains. Arrow in between the charts (2 and 3) indicate the treated segment for further analysis, with feature counts noted in brackets. c Representative line graphs of chest 3D velocity (vel.) and acceleration (acc.) over time, alongside scalograms from Ricker wavelet transformation (CWT) of the latter. Computed wavelet entropy (w.e) of the acc. signal is marked on each graph. d Diagrams of the computational processes for the wavelet entropy and fundamental frequency of chest 3D acc. data. e, f Plots of wavelet entropy and fundamental frequency of chest 3D acc. signals at 10 wk. g Representative line graphs of the CWT signal at scale 5 for neck 3D acc. over time. Computed std of the signal is marked on each graph. h, i Plots of the CWT signal at scale 5 for neck 3D acc. and power spectrum density (PSD) bandwidth of neck 3D acc. signal at 10 wk. j Representative line graphs of tail 3D angles over time. Computed autocorrelation (auto.r) of the signal is marked on each graph. k, l Plots of the tail 3D angle autocorrelation and zero-crossing rate (ZCR) of tip 3D velocity. Box plots show the median (black line), mean (‘+’ symbol), and interquartile range (box) with Tukey-style whiskers. Sample sizes (n) are indicated in plots. All statistical analyses were performed using one-way ANOVA followed by Holm–Sidak post hoc corrections for multiple comparisons. See Supplementary Table 18 for details. Schematics were created in BioRender. Heo, W. (2025) https://BioRender.com/cykyauz. Source data are provided in the Source Data file. ML machine learning, TSFEL Time Series Feature Extraction Library, Coeff. coefficient.
Fig. 5
Fig. 5. optoRET enhancement in locomotion behaviour and prevention of foot trailing, the PD gait signature.
a Schematic of the key feature components, particularly for turning and gait events. b Representative foot trajectories and leg angle line graphs over time, alongside the marked behaviour events including turning, rearing and swing phases in gait. c,d Plots of turning duration and velocity. e,f Plots of chest vertical velocity standard deviations (std) and maximum (max) in rearing period and transition phases, respectively. g Plots of Gait model predicted PD gait scores for the CT, A5, A1 and A1O3 groups. h Graphic summary of the top 20 features of Gait model. The beeswarm plots (SHAP summary plot) offer local explanations of each feature and the heatmaps details mean feature values, with statistical significances indicated by asterisks. i Pie charts, detailing the evaluations of PD-affected features, treatment responses, and untreated or treated feature domains. j Heatmaps of feet 2D position densities, relative to anus for CT, A5, A1 and A1O3 groups (50, 51, 27 and 27 clips, respectively). Dashed lines indicate the x- and y-axis intersection at 0. k Representative snapshot images of CT and PD mice, highlighting the foot trailing behind the anus for the latter. l Plots of the percentage of feet positions behind the anus, depicted in the negative x-axis of heatmaps. Box plots show the median (black line), mean (‘+’ symbol), and interquartile range (box) with Tukey-style whiskers. For dot plots, data are presented as mean ± SEM. Samples sizes are indicated on each plot. See Supplementary Tables 21, 22 for definitions of listed features and statistical details of heatmaps in panel h, respectively. All statistical analyses were performed using one-way ANOVA, with Benjamini–Hochberg post hoc correction in panel c,d and Holm–Sidak correction in all other panels for multiple comparisons. Schematics were created in BioRender. Heo, W. (2025) https://BioRender.com/cykyauz. Source data are provided in the Source Data file.

References

    1. Armstrong, M. J. & Okun, M. S. Diagnosis and treatment of Parkinson disease: a review. JAMA323, 548–560 (2020). - PubMed
    1. Dovonou, A. et al. Animal models of Parkinson’s disease: bridging the gap between disease hallmarks and research questions. Trans. l Neurodegener.12, 36 (2023). - PMC - PubMed
    1. Yang, Y. et al. Artificial intelligence-enabled detection and assessment of Parkinson’s disease using nocturnal breathing signals. Nat. Med.28, 2207–2215 (2022). - PMC - PubMed
    1. Ntetsika, T., Papathoma, P. E. & Markaki, I. Novel targeted therapies for Parkinson’s disease. Mol. Med27, 17 (2021). - PMC - PubMed
    1. Stoker, T. B., Torsney, K. M. & Barker, R. A. Emerging treatment approaches for Parkinson’s disease. Front Neurosci.12, 693 (2018). - PMC - PubMed

LinkOut - more resources