. 2025 Aug 8;30(4):473.
doi: 10.3892/ol.2025.15219. eCollection 2025 Oct.

UBE2T promotes epithelial-mesenchymal transition and motility in oral cancer cells via induction of IL-6 expression

Affiliations

UBE2T promotes epithelial-mesenchymal transition and motility in oral cancer cells via induction of IL-6 expression

Ai Watanabe et al. Oncol Lett. .

Abstract

Oral squamous cell carcinoma (OSCC) is a prevalent aggressive malignancy with a high mortality rate. However, the mechanisms underlying the progression of OSCC remain to be elucidated. In the present study, bioinformatics analysis identified ubiquitin-conjugating enzyme E2 T (UBE2T) as a poor prognostic factor in head and neck cancer, showing the strongest association with cancer stage progression. Functional studies revealed that UBE2T can enhance motility and induce epithelial-mesenchymal transition (EMT) in OSCC cells. RNA sequencing and subsequent analyses demonstrated that UBE2T upregulated the expression levels of various motility- and EMT-related factors, including ankyrin repeat domain 1, endothelin-1, interleukin-6 (IL-6), matrix metalloproteinase-9 and plasminogen activator, urokinase. Gene set enrichment analysis indicated that UBE2T activates the IL-6/Janus protein tyrosine kinase (JAK)/signal transducer and activator of transcription 3 signaling pathway. Moreover, treatment of OSCC cells with IL-6 or a JAK inhibitor resulted in the induction of EMT and mesenchymal-epithelial transition, respectively, accompanied by enhanced and suppressed cancer cell motility. These results indicated that IL-6, which is upregulated by UBE2T, may be crucial for maintaining mesenchymal traits and motility in OSCC cells. Collectively, these findings suggested that the UBE2T/IL-6/JAK axis may serve as a potential therapeutic target for OSCC.

Keywords: EMT; IL-6; OSCC; UBE2T.


Conflict of interest statement

The authors declare that they have no competing interests.

Figures

Figure 1. UBE2T correlates with poor prognosis and progression of HNSCC. (A) Analysis of UBE2T expression in HNSCC tumor (Tumor; red) and normal tissues (Normal; gray) using GEPIA web server. Values r...
Figure 1.
UBE2T correlates with poor prognosis and progression of HNSCC. (A) Analysis of UBE2T expression in HNSCC tumor (Tumor; red) and normal tissues (Normal; gray) using GEPIA web server. Values represent first log2(TPM+1) transformed expression data. HNSCC tumor tissues (n=519), normal tissues (n=44). Statistical analysis: one-way ANOVA; *P<0.05. (B) Correlation between UBE2T expression and OS of patients with HNSCC. Kaplan-Meier survival plot of two patient cohorts with low (black) and high (red) UBE2T expressions. HR and P-values are shown. (C) Violin plots showing correlation between UBE2T expression and pathological stages (stage I to IV) of HNSCC analyzed using GEPIA web server. Values represent first log2(TPM+1) transformed expression data. Statistical analysis: one-way ANOVA; F and P values are shown. GEPIA, Gene Expression Profiling Interactive Analysis; HNSCC, head and neck squamous cell carcinoma; HR, hazard ratio; OS, overall survival; TPM, transcripts per million; UBE2T, ubiquitin-conjugating enzyme E2 T.
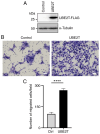
Figure 2. UBE2T enhances migration of oral cancer cells. Ctrl SAS cells and UBE2T SAS cells (UBE2T) were established by infecting SAS–Fucci cells with empty lentivirus or lentivirus expressing FLAG–ta...
Figure 2.
UBE2T enhances migration of oral cancer cells. Ctrl SAS cells and UBE2T SAS cells (UBE2T) were established by infecting SAS-Fucci cells with empty lentivirus or lentivirus expressing FLAG-tagged UBE2T followed by chamber migration assay. (A) Expression of FLAG-tagged UBE2T was visualized by immunoblotting analysis using anti-FLAG M2 antibody. α-tubulin was used as a loading control for cell lysate. (B and C) Migration assay of Control and UBE2T SAS cells. (B) Representative images of migrated cells are shown. Scale bars: 50 µm. (C) Quantitative analysis of migrated cells. Data are represented as mean ± SD. Statistical analysis: two-tailed unpaired Student's t-test; ****P<0.0001. Ctrl, control; UBE2T, ubiquitin-conjugating enzyme E2 T.
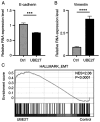
Figure 3. UBE2T induces EMT in oral cancer cells. (A and B) The expression levels of an epithelial cell marker E–cadherin and a mesenchymal cell marker vimentin in Ctrl SAS cells and UBE2T SAS cells (...
Figure 3.
UBE2T induces EMT in oral cancer cells. (A and B) The expression levels of an epithelial cell marker E-cadherin and a mesenchymal cell marker vimentin in Ctrl SAS cells and UBE2T SAS cells (UBE2T) were examined using reverse transcription-quantitative PCR. Relative expression of (A) an epithelial cell marker, E-cadherin and (B) a mesenchymal cell marker, vimentin. All data are normalized to the expression of β-actin. Data are represented as mean ± SD. Statistical analyses: two-tailed unpaired Student's t-test; ***P<0.001; ****P<0.0001. (C) GSEA of EMT gene signatures, comparing RNA sequencing data from Ctrl SAS cells with UBE2T SAS cells (UBE2T). n=2 per group. Ctrl, control; EMT, epithelial-mesenchymal transition; GSEA, gene set enrichment analysis; NES, normalized enrichment score; P-val, nominal P-value from GSEA; UBE2T, ubiquitin-conjugating enzyme E2 T.
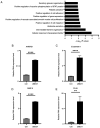
Figure 4. UBE2T upregulates the expression of mesenchymal cell markers associated with motility and epithelial–mesenchymal transition. (A) Gene Ontology functional enrichment analysis of 62 differenti...
Figure 4.
UBE2T upregulates the expression of mesenchymal cell markers associated with motility and epithelial-mesenchymal transition. (A) Gene Ontology functional enrichment analysis of 62 differentially expressed genes upregulated in UBE2T SAS cells compared with Ctrl SAS cells. (B-E) Expression of various mesenchymal cell markers in Ctrl SAS cells and UBE2T SAS cells (UBE2T) were examined by reverse transcription-quantitative PCR. Relative expression of (B) ANKRD1, (C) endothelin-1, (D) MMP-9 and (E) PLAU. All data are normalized to the expression of β-actin. Data are represented as mean ± SD. Statistical analyses: two-tailed unpaired Student's t-test; **P<0.01; ****P<0.0001. ANKRD1, ankyrin repeat domain 1; Ctrl, control; MMP-9, matrix metalloproteinase-9; PLAU, plasminogen activator, urokinase; UBE2T, ubiquitin-conjugating enzyme E2 T.
Figure 5. Expressions of IL–6 and genes involved in IL–6–related signaling are upregulated in UBE2T SAS cells. (A) Search Tool for the Retrieval of Interacting Genes analysis of 62 differentially expr...
Figure 5.
Expressions of IL-6 and genes involved in IL-6-related signaling are upregulated in UBE2T SAS cells. (A) Search Tool for the Retrieval of Interacting Genes analysis of 62 differentially expressed genes upregulated in UBE2T SAS cells. Red font indicates previously reported factors, associated with cancer cell migration and epithelial-mesenchymal transition. (B) GSEA of ‘HALLMARK_IL6_JAK_STAT3_SIGNALING’ gene set comparing RNA sequencing data from Ctrl SAS cells and UBE2T SAS cells (UBE2T). n=2 per group. (C) Relative expression of IL-6 in Control SAS cells (Ctrl) and UBE2T SAS cells (UBE2T). Data are normalized to the expression of β-actin. Data are represented as mean ± SD. Statistical analysis: two-tailed unpaired Student's t-test; ****P<0.0001. ANKRD1, ankyrin repeat domain 1; Ctrl, control; EDN1, endothelin-1; GSEA, gene set enrichment analysis; IL-6/IL6, interleukin-6; JAK, Janus protein tyrosine kinase; MMP9, matrix metalloproteinase-9; NES, normalized enrichment score; PLAU, plasminogen activator, urokinase; P, nominal P-value from GSEA; STAT3, signal transducer and activator of transcription 3; UBE2T, ubiquitin-conjugating enzyme E2 T; VIM, vimentin.
Figure 6. IL–6 induces epithelial–mesenchymal transition and enhances migration of oral cancer cells. SAS cells were cultured in the absence (Ctrl) or presence of IL–6 (IL–6) for 72 h followed by (A a...
Figure 6.
IL-6 induces epithelial-mesenchymal transition and enhances migration of oral cancer cells. SAS cells were cultured in the absence (Ctrl) or presence of IL-6 (IL-6) for 72 h followed by (A and B) reverse transcription-quantitative PCR and (C and D) chamber migration assay. Relative expression levels of (A) an epithelial cell marker, E-cadherin and (B) a mesenchymal cell marker, vimentin. All data are normalized to the expression of β-actin. (C) Representative images of migrated cells treated without (Ctrl) or with IL-6 (IL-6) are shown. Scale bars: 50 µm. (D) Quantitative analysis of migrated cells. All data are represented as mean ± SD. Statistical analyses: two-tailed unpaired Student's t-test; **P<0.01, ****P<0.0001. Ctrl, control; IL-6, interleukin-6.
Figure 7. JAKi induces mesenchymal–epithelial transition and suppresses migration of oral cancer cells. UBE2T SAS cells were cultured in the absence (Ctrl) or presence of ruxolitinib, a JAKi for 72 h ...
Figure 7.
JAKi induces mesenchymal-epithelial transition and suppresses migration of oral cancer cells. UBE2T SAS cells were cultured in the absence (Ctrl) or presence of ruxolitinib, a JAKi for 72 h followed by (A and B) reverse transcription-quantitative PCR and (C and D) chamber migration assay. Relative expression levels of (A) an epithelial cell marker, E-cadherin and (B) a mesenchymal cell marker, vimentin. All data are normalized to the expression of β-actin. (C) Representative images of migrated cells treated without (Ctrl) or with JAKi are shown. Scale bars: 50 µm. (D) Quantitative analysis of migrated cells. All data are represented as mean ± SD. Statistical analyses: two-tailed unpaired Student's t-test; **P<0.01, ***P<0.001. Ctrl, control; JAKi, Janus protein tyrosine kinase inhibitor.

References

    1. Biray Avci C, Goker Bagca B, Nikanfar M, Takanlou LS, Takanlou MS, Nourazarian A. Tumor microenvironment and cancer metastasis: Molecular mechanisms and therapeutic implications. Front Pharmacol. 2024;15:1442888. doi: 10.3389/fphar.2024.1442888. - DOI - PMC - PubMed
    1. Li Y, Liu F, Cai Q, Deng L, Ouyang Q, Zhang XH, Zheng J. Invasion and metastasis in cancer: Molecular insights and therapeutic targets. Sig Transduct Target Ther. 2025;10:57. doi: 10.1038/s41392-025-02148-4. - DOI - PMC - PubMed
    1. Miyazono K, Katsuno Y, Koinuma D, Ehata S, Morikawa M. Intracellular and extracellular TGF-β signaling in cancer: Some recent topics. Front Med. 2018;12:387–411. doi: 10.1007/s11684-018-0646-8. - DOI - PubMed
    1. Xie Y, Wang X, Wang W, Pu N, Liu L. Epithelial-mesenchymal transition orchestrates tumor microenvironment: Current perceptions and challenges. J Transl Med. 2025;23:386. doi: 10.1186/s12967-025-06422-5. - DOI - PMC - PubMed
    1. Robinson DR, Wu YM, Lonigro RJ, Vats P, Cobain E, Everett J, Cao X, Rabban E, Kumar-Sinha C, Raymond V, et al. Integrative clinical genomics of metastatic cancer. Nature. 2017;548:297–303. doi: 10.1038/nature23306. - DOI - PMC - PubMed

LinkOut - more resources