. 2025;7(8):1292-1307.
doi: 10.1038/s42256-025-01074-y. Epub 2025 Aug 4.

Histopathology-based protein multiplex generation using deep learning

Collaborators, Affiliations

Histopathology-based protein multiplex generation using deep learning

Sonali Andani et al. Nat Mach Intell. 2025.

Abstract

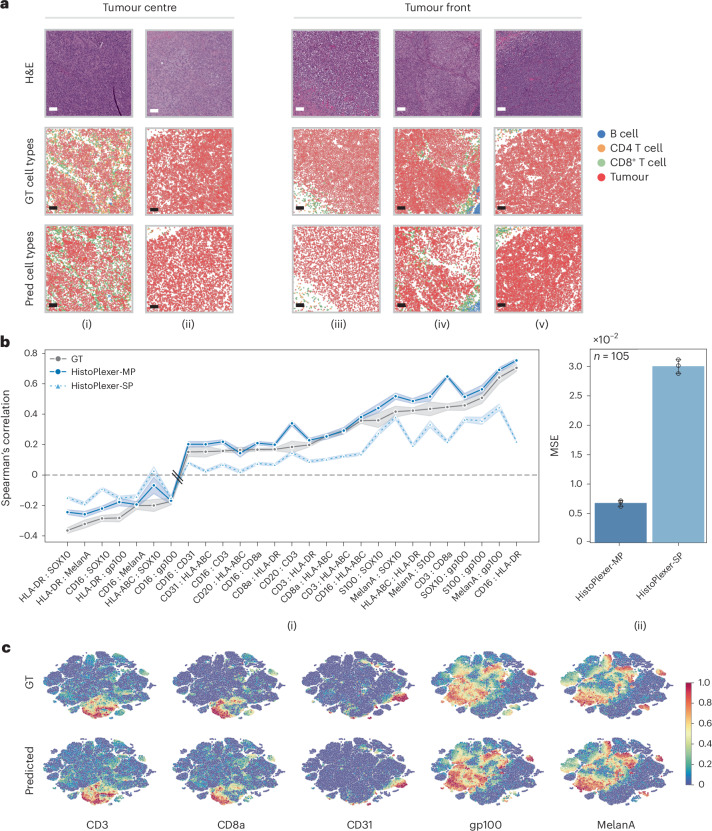
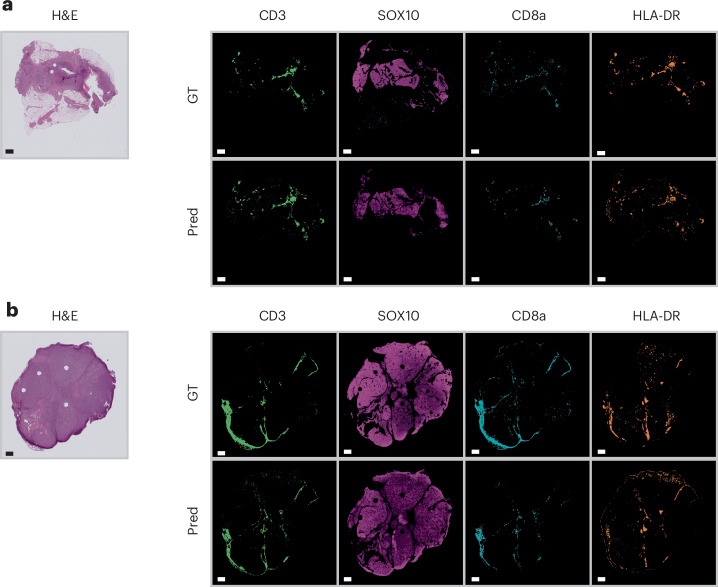
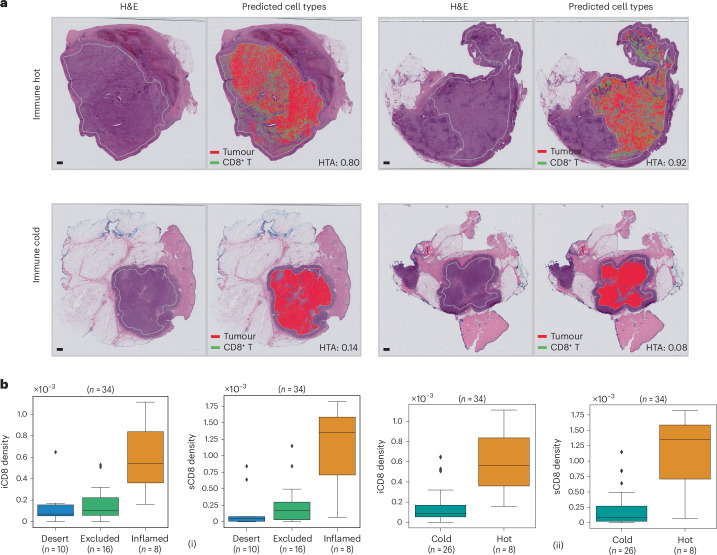
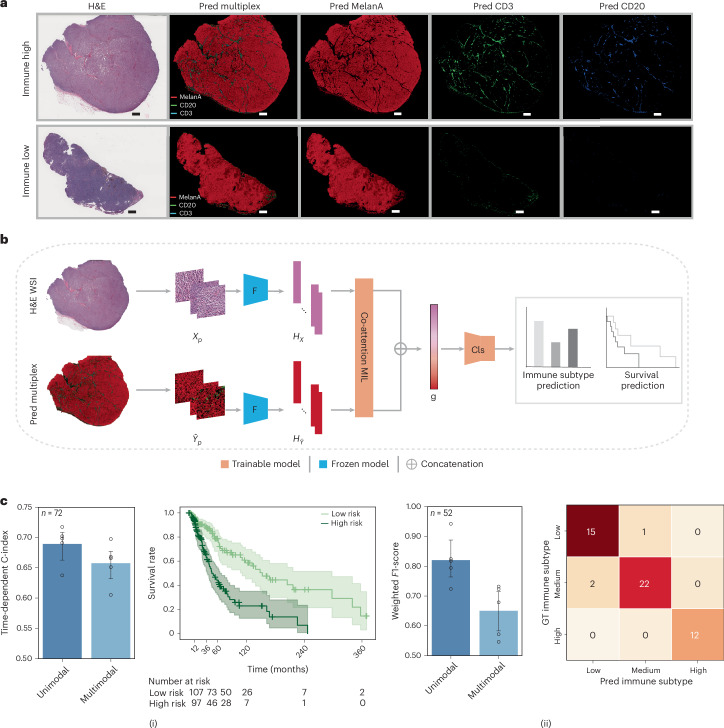
Multiplexed protein imaging offers valuable insights into interactions between tumours and their surrounding tumour microenvironment, but its widespread use is limited by cost, time and tissue availability. Here we present HistoPlexer, a deep learning framework that generates spatially resolved protein multiplexes directly from standard haematoxylin and eosin (H&E) histopathology images. HistoPlexer jointly predicts multiple tumour and immune markers using a conditional generative adversarial architecture with custom loss functions designed to ensure pixel- and embedding-level similarity while mitigating slice-to-slice variations. A comprehensive evaluation of metastatic melanoma samples demonstrates that HistoPlexer-generated protein maps closely resemble real maps, as validated by expert assessment. They preserve crucial biological relationships by capturing spatial co-localization patterns among proteins. The spatial distribution of immune infiltration from HistoPlexer-generated protein multiplex enables stratification of tumours into immune subtypes. In an independent cohort, integration of HistoPlexer-derived features into predictive models enhances performance in survival prediction and immune subtype classification compared to models using H&E features alone. To assess broader applicability, we benchmarked HistoPlexer on publicly available pixel-aligned datasets from different cancer types. In all settings, HistoPlexer consistently outperformed baseline methods, demonstrating robustness across diverse tissue types and imaging conditions. By enabling whole-slide protein multiplex generation from routine H&E images, HistoPlexer offers a cost- and time-efficient approach to tumour microenvironment characterization with strong potential to advance precision oncology.

Keywords: Computational models; Machine learning; Melanoma.


Conflict of interest statement

Competing interestsV.H.K. reports being an invited speaker for Sharing Progress in Cancer Care (SPCC) and Indica Labs; advisory board of Takeda; and sponsored research agreements with Roche and IAG, all unrelated to the current study. V.H.K. is a participant of a patent application on the assessment of cancer immunotherapy biomarkers by digital pathology, a patent application on multimodal deep learning for the prediction of recurrence risk in cancer patients and a patent application on predicting the efficacy of cancer treatment using deep learning, all of which are not directly related to the current work. G.R. and J.F.-P. are participants of a patent application on matching cells from different measurement modalities, which is not directly related to the current work. Moreover, G.R. is cofounder of Computomics GmbH, Germany, and one of its shareholders. B.B. has co-founded Navignostics, a spin-off company of the University of Zurich developing precision oncology diagnostics, and is one of its shareholders and a board member. The other authors declare no competing interests.

Figures

Fig. 1
Fig. 1. Overview of HistoPlexer architecture.
a, The HistoPlexer consists of a translator G that takes H&E and IMC images as input and predicts protein multiplexes from morphology information encoded in the H&E images, ultimately generating protein multiplex on the WSI level from H&E input. b, The objective functions of HistoPlexer contain the GAN adversarial loss (i), Gaussian pyramid loss with average L1 distance across scales (ii), and patch-wise contrastive loss with anchor from generated IMC and positive and negative from GT IMC (iii).
Fig. 2
Fig. 2. ROI-level assessment of HistoPlexer.
a, Quantitative assessment and comparison against benchmarks using MS-SSIM, PSNR and RMSE-SW for MP and SP settings. The up arrow indicates higher values are better. The down arrow indicates lower values are better. The best results are highlighted in bold. b, Qualitative assessment of HistoPlexer for three ROIs ((i)–(iii)) with H&E as input to HistoPlexer, and expression profiles of individual markers: MelanA, CD3, CD8a, CD20, SOX10 and CD16. Top rows: GT expression profiles from IMC modality; bottom rows: predicted (Pred) expression profiles from HistoPlexer. Scale bars, 100 μm. Source data
Fig. 3
Fig. 3. Assessing performance beyond pixel level using cell-type and spatial analyses.
a, Cell-typing results: ROIs from the tumour centre ((i) and (ii)) and tumour front ((iii)–(v)), showing H&E, GT and predicted cell types in ROIs grouped by their location within the tissue: tumour centre and tumour front. Scale bars, 100 μm. b, Spearman’s correlation coefficients between protein pairs, comparing the GT with both SP and MP predictions of HistoPlexer (i). The pairs on the x axis are ordered by increasing Spearman’s correlation in the GT. MSE between the GT and predicted Spearman’s correlation coefficients, comparing the SP and MP predictions of HistoPlexer (ii). Bars represent mean values, and error bars indicate standard deviation (s.d.). c, Joint t-SNE visualization of protein co-localization patterns for selected markers: CD3, CD8a, CD31, gp100 and MelanA. The colour represents normalized protein expression. Source data
Fig. 4
Fig. 4. Qualitative WSI-level assessment of HistoPlexer.
a,b, H&E staining (first column; a and b) and expression profiles of individual markers (CD3, SOX10, CD8a and HLA-DR, from second to last column; a and b). Top rows: GT expression profiles from Ultivue images; bottom rows: Pred expression profiles at the WSI level for samples in a and b. Scale bars, 1 mm.
Fig. 5
Fig. 5. Immune phenotyping using HistoPlexer.
a, Four samples from TuPro metastatic melanoma cohort with two immune-hot cases in the top row and two immune-cold samples in the bottom row. For each sample, H&E image on the left along with overlay of predicted tumour and CD8+ T cells within tumour centre region using HistoPlexer model on the right. Heterogeneity average (HTA) index for quantifying the spatial heterogeneity or interaction between tumour and CD8⁺ T cells is indicated for each sample. Scale bars, 1 mm. b, Box plot of iCD8 and sCD8 CD8+ T cell densities in tumour centre compartment, stratified by immune desert, excluded and inflamed classes (i). Box plot of iCD8 and sCD8 CD8+ T cell densities in tumour centre compartment, stratified by immune-hot and -cold classes (ii). Box plots show the median (centre line), the 25th and 75th percentiles (box limits), and whiskers extending to the most extreme data points within 1.5× the interquartile range from the box limits. Points beyond the whiskers represent outliers.
Fig. 6
Fig. 6. Generalization to an independent patient cohort.
a, Two examples (immune-high and -low) from the TCGA–SKCM cohort, showing H&E images, predicted protein multiplexes and expression profiles of MelanA, CD3 and CD20 markers. Scale bars, 2 mm (top) and 2.5 mm (bottom). b, Model architecture for multimodal survival and immune subtype prediction. c, Survival prediction results (i), displaying time-dependent C-index scores (left) and Kaplan–Meier survival curves for all test patients aggregated across five cross-validation folds for the multimodal setting, with separation of low- and high-risk groups (right). Immune subtype prediction results (ii), showing the weighted F1-score (left) and confusion matrix (right) for classification into low, intermediate and high immune subtypes. The confusion matrix corresponds to the fold with the highest weighted F1-score. For bar plots, bars represent mean values and error bars indicate s.d. Cls, classifier head; F, residual neural network feature extractor ResNet18; HX, H&E IMC features; HŶ, predicted IMC features. Source data
Extended Data Fig. 1
Extended Data Fig. 1. Statistical test for HistoPlexer and baselines.
Paired two-sided t-test: Comparison of significance levels between methods in multiplex (left) and singleplex (right) settings for MS-SSIM (row 1), PSNR (row 2) and RMSE-SW (row 3) metrics. No adjustments were made for multiple comparisons. Significance levels are colour-coded: Not Significant (NS) (p≥0.05), Significant (p<0.05), and Strong Significant (p<0.01).
Extended Data Fig. 2
Extended Data Fig. 2. Qualitative RoI-level assessment of HistoPlexer.
H&E (first column) and expression profiles of individual markers: S100, HLA-DR, HLA-ABC, gp100 and CD31 (from second to last column). Top row: ground-truth (GT) expression profiles; bottom row: predicted (pred) expression profiles. Source data
Extended Data Fig. 3
Extended Data Fig. 3. Co-localization patterns.
a(i) Spearman’s correlation coefficients between protein pairs, comparing the ground truth (GT) with both singleplexed (SP) and multiplexed (MP) predictions of HistoPlexer. a(ii) Mean squared error between the GT and predicted Spearman’s correlation coefficients, comparing the SP and MP predictions of HistoPlexer. Bars represent mean values and error bars indicate standard deviation (SD). b Joint t-SNE visualization of protein co-localization patterns.
Extended Data Fig. 4
Extended Data Fig. 4. Region annotation for Immune phenotyping.
H&E WSI (left) and H&E WSI with an outline of the Tumour Center compartment and annotated regions (right).

Update of

References

    1. Hanahan, D. & Weinberg, R. A. Hallmarks of cancer: the next generation. Cell144, 646–674 (2011). - PubMed
    1. Hanahan, D. Hallmarks of cancer: new dimensions. Cancer Discov.12, 31–46 (2022). - PubMed
    1. Egeblad, M., Nakasone, E. S. & Werb, Z. Tumors as organs: complex tissues that interface with the entire organism. Dev. Cell18, 884–901 (2010). - PMC - PubMed
    1. Jackson, H. W. et al. The single-cell pathology landscape of breast cancer. Nature578, 615–620 (2020). - PubMed
    1. Sobottka, B. et al. Establishing standardized immune phenotyping of metastatic melanoma by digital pathology. Lab. Investig.101, 1561–1570 (2021). - PMC - PubMed

LinkOut - more resources