

Comparative effectiveness of various combined interventions for type 2 diabetes and obesity: a systematic review and network meta-analysis
- PMID: 40842495
- PMCID: PMC12365605
- DOI: 10.3389/fendo.2025.1462104
Comparative effectiveness of various combined interventions for type 2 diabetes and obesity: a systematic review and network meta-analysis
Abstract
Background: Type 2 diabetes mellitus (T2DM) is a leading cause of severe complications, projected to affect 693 million adults globally by 2045. Addressing obesity, a key factor in T2DM, through exercise can improve metabolic health and reduce inflammation. This study conducts a Bayesian network meta-analysis to evaluate the long-term effects of various combined interventions on inflammatory markers and metabolic health in overweight or obese individuals with T2DM.
Methods: We included randomized controlled trials (RCTs) from January 2000 to April 2023 that examined the effects of aerobic training (AT), resistance training (RT), combined aerobic and resistance training (ART), physical-mental training (PMT), whole-body vibration training (WBT), and acupuncture (ACT) on BMI, lipid profiles, fasting blood glucose (FBG), HbA1c, HOMA-IR, IL-6, and TNF-α. A comprehensive literature search was performed in PubMed, Web of Science, CNKI, MEDLINE, EMBASE, and the Cochrane Central Register of Controlled Trials. Data extraction and quality assessment were independently conducted by two researchers, and Bayesian network meta-analysis was performed using R software.
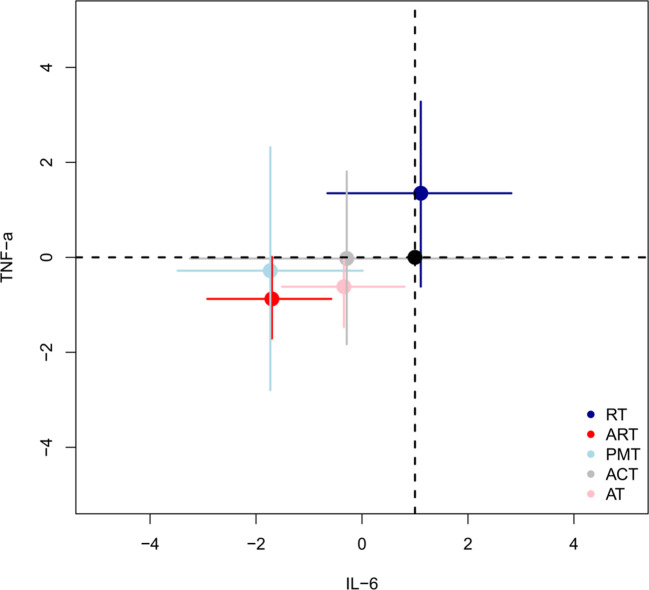
Results: A total of 128 RCTs were included. ART showed the most significant improvements in BMI, IL-6, and TNF-α levels. PMT was the most effective in improving lipid profiles (TG, TC, HDL-C, LDL-C) and insulin sensitivity markers (HbA1c, HOMA-IR). The SUCRA rankings indicated ART and PMT as the most beneficial interventions. Meta-regression analysis highlighted that VO2max improvements were closely associated with reductions in BMI and HbA1c.
Conclusion: ART and PMT demonstrated comprehensive benefits across multiple metabolic and inflammatory outcomes. ART effectively reduced BMI, improved glycemic control, and decreased inflammatory markers through mechanisms involving AMPK and mTOR pathways. PMT improved lipid metabolism and insulin sensitivity by reducing stress hormone levels and modulating endocrine and nervous system functions. A precise exercise prescription combining ART, PMT, AT, RT, and ACT is recommended to optimize metabolic health in T2DM patients. Future research should focus on individualized intervention strategies to enhance clinical outcomes.
Systematic review registration: PROSPERO, identifier CRD42024539376.
Keywords: aerobic training; combined aerobic and resistance training; insulin resistance; obesity; resistance training; type 2 diabetes mellitus.
Copyright © 2025 Cui, Lu, Tan and Cao.
Conflict of interest statement
The authors declare that the research was conducted in the absence of any commercial or financial relationships that could be construed as a potential conflict of interest.
Figures


Similar articles
-
Comparative effectiveness of different exercise modality on glycaemic control and lipid profile for prediabetes: systematic review and network meta-analysis.Front Endocrinol (Lausanne). 2025 Jul 24;16:1518871. doi: 10.3389/fendo.2025.1518871. eCollection 2025. Front Endocrinol (Lausanne). 2025. PMID: 40778279 Free PMC article.
-
Systemic pharmacological treatments for chronic plaque psoriasis: a network meta-analysis.Cochrane Database Syst Rev. 2021 Apr 19;4(4):CD011535. doi: 10.1002/14651858.CD011535.pub4. Cochrane Database Syst Rev. 2021. Update in: Cochrane Database Syst Rev. 2022 May 23;5:CD011535. doi: 10.1002/14651858.CD011535.pub5. PMID: 33871055 Free PMC article. Updated.
-
Systemic pharmacological treatments for chronic plaque psoriasis: a network meta-analysis.Cochrane Database Syst Rev. 2020 Jan 9;1(1):CD011535. doi: 10.1002/14651858.CD011535.pub3. Cochrane Database Syst Rev. 2020. Update in: Cochrane Database Syst Rev. 2021 Apr 19;4:CD011535. doi: 10.1002/14651858.CD011535.pub4. PMID: 31917873 Free PMC article. Updated.
-
Comparative effects of acupuncture and metformin on insulin sensitivity in women with polycystic ovary syndrome: a systematic review and meta-analysis.Front Endocrinol (Lausanne). 2025 Jun 18;16:1553684. doi: 10.3389/fendo.2025.1553684. eCollection 2025. Front Endocrinol (Lausanne). 2025. PMID: 40607225 Free PMC article.
-
Systemic pharmacological treatments for chronic plaque psoriasis: a network meta-analysis.Cochrane Database Syst Rev. 2017 Dec 22;12(12):CD011535. doi: 10.1002/14651858.CD011535.pub2. Cochrane Database Syst Rev. 2017. Update in: Cochrane Database Syst Rev. 2020 Jan 9;1:CD011535. doi: 10.1002/14651858.CD011535.pub3. PMID: 29271481 Free PMC article. Updated.
References
-
- Kopp W. How western diet and lifestyle drive the pandemic of obesity and civilization diseases. In: DeFronzo RA, Ferrannini E, Zimmet P, Alberti G, editors Diabetes, metabolic syndrome and obesity: targets and therapy. Auckland, New Zealand: Dove Medical Press; (2019). p. 2221–36., PMID: - PMC - PubMed
-
- Roden M, Shulman GI. The integrative biology of type 2 diabetes. Nature. (2019) 576:51–60. - PubMed
Publication types
MeSH terms
LinkOut - more resources
Full Text Sources
Medical
Miscellaneous