. 2025 Jul 9;9(9):ziaf116.
doi: 10.1093/jbmrpl/ziaf116. eCollection 2025 Sep.

Cortical bone mechanics technology signal quality maintains robustness across a range of biometric profiles

Affiliations

Cortical bone mechanics technology signal quality maintains robustness across a range of biometric profiles

Andrew Dick et al. JBMR Plus. .

Abstract

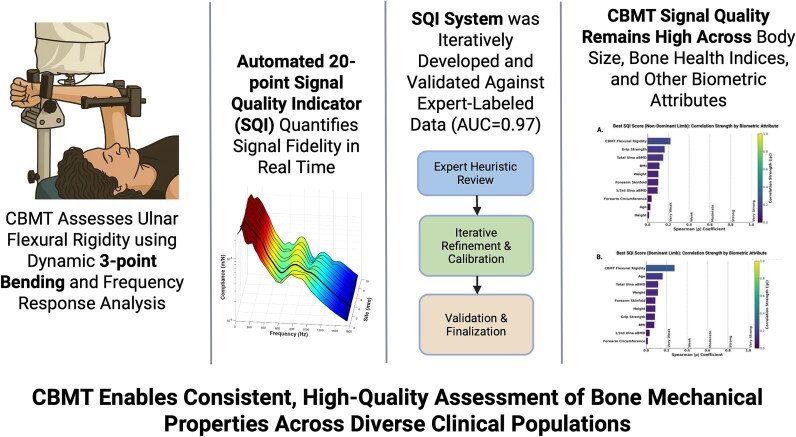
Current methods of diagnosing osteoporosis, such as DXA, have limitations in predicting fracture risk. Cortical bone mechanics technology (CBMT) offers a novel approach by using a three-point bend test with multifrequency vibration analysis to directly measure ulnar bending stiffness and calculate flexural rigidity, a mechanical property highly predictive of whole-bone strength under bending conditions. Cortical bone mechanics technology targets the diaphyseal ulna, a site composed primarily of cortical bone, enhancing its specificity for cortical bone quality. In this study of 388 postmenopausal women, we developed and validated a 20-point signal quality indicator (SQI) scoring system to quantify CBMT signal quality and evaluated its relationship to biometric characteristics. The SQI was developed through expert assessment of representative frequency response function (vibration data) trials and refined over 17 iterations. The final system achieved excellent classification performance (AUC = 0.974; sensitivity, specificity, and accuracy all >97%). A total of 22 740 trials were collected across 758 total arm tests, sampling 10 ulnar sites per arm under three vibration amplitudes. Two expert analysts evaluated signal features associated with high signal quality. The resulting SQI is fully automated and provides real-time feedback. All correlations between SQI scores and biometric attributes were weak or very weak (|ρ| < 0.30). The correlations with body weight (ρ = -0.11), BMI (ρ = -0.12), ulnar BMD (ρ = -0.17), CBMT-derived flexural rigidity (ρ = -0.28), and grip strength (ρ = 0.17) were statistically significant (p < .05) but remained small in magnitude. SQI scores were modestly lower in individuals with higher BMI or flexural rigidity (~2 to 3 points), but values remained in the acceptable-to-good range. This study introduces a robust, automated CBMT signal quality metric and demonstrates that its performance remains stable across a broad range of biometric profiles, supporting its application in both clinical and research settings.

Keywords: BMD; bone strength; cortical bone mechanics technology (CBMT); fracture; mechanical response tissue analysis (MRTA); osteoporosis.


Conflict of interest statement

B.C.C. is a co-founder with equity in OsteoDx, Inc. A.D. and M.S. are employees of OsteoDx Inc. M.R. has served as a consultant to OsteoDx Inc. T.S. serves as a consultant to OsteoDx, Inc. and represents an investor in the company.

Figures

Graphical Abstract
Graphical Abstract
Figure 1
Figure 1
Spatial and spectral variation in frequency response functions (FRFs) across ulnar test sites from a single subject. This 3D surface plot illustrates the compliance (z-axis) across frequency (x-axis) and anatomical site index (y-axis). Data were collected at 10 adjacent sites spaced 1 mm apart, reflecting the CBMT protocol’s spatial sampling strategy. The color gradient depicts the magnitude of compliance, with warmer colors indicating higher values. While there is expected variability across sites, the dominant resonance features, particularly the lower-frequency bone-associated peaks, are consistently present. This visualization highlights how local anatomical and soft tissue variations influence signal fidelity and underscores the importance of sampling across multiple positions to capture high-quality modal signals for analysis. It is important to note that SQI scores evaluate the quality of the experimental FRF signals, not the quality of the model fitting itself. From a translational standpoint, the automated SQI scoring system is intended to guide workflow decisions, such as whether a test should be repeated, and to support consistent signal quality assessment.
Figure 2
Figure 2
Representative compliance-frequency curves from five different subjects are shown for trials with SQI scores of 1 (very poor), 5 (fair), 10 (good), and 20 (exceptional). These illustrate the progressive improvement in resonance clarity and signal isolation with increasing SQI. At low SQI levels, bone resonance is indistinct and confounded by noise or overlapping features. As SQI increases, modal structure becomes more defined, with clearer separation between bone and skin resonances, reduced noise, and fewer secondary features. Curves are annotated to highlight key characteristics that inform the SQI scoring rubric, including primary mode clarity, modal separation, and noise in the bone decay region. In high-quality FRF signals, the complex compliance FRF signals demonstrate 2 primary resonances. The location and shape of the higher frequency resonance is determined primarily by the mechanical properties of the skin and other soft tissue and the applied static load, while those of the lower frequency resonance are determined primarily by the mechanical properties of the underlying bone., Both resonances are also affected by damping effects of surrounding soft tissue. Non-biological low frequency (<50 Hz) noise that is attributed to the mechanical system has been filtered and removed. Ulnar flexural rigidity is ultimately quantified based on the compliance FRF model fit. Abbreviations: FRF, frequency response functions; SQI, signal quality indicator.
Figure 3
Figure 3
Development and validation workflow for the cortical bone mechanics technology (CBMT) signal quality indicator (SQI) scoring system. This flowchart illustrates the multi-phase process used to develop and validate the SQI scoring system for CBMT signals. The workflow is organized into 3 phases: Expert Heuristic Review, Iterative Refinement and Calibration, and Validation and Finalization. In the first phase (ie, the calibration phase), two experienced modal analysis engineers independently reviewed 1000 CBMT trials to heuristically identify features of high-quality signals (HQS). These insights informed the initial construction of a sequential gating scoring system. In the second phase (ie, the SQI refinement phase), 5 rounds of independent review (2530 trials per engineer) were conducted to refine the system, supported by the calculation of signal-derived parameters and validation through Least absolute shrinkage and selection operator (LASSO) regression to optimize feature selection and reduce collinearity. The final phase involved 12 iterative refinements (500 trials each) to finalize the scoring system, culminating in a quantitative assessment of sensitivity, specificity, and accuracy. Color-coded elements correspond to each development phase. Abbreviations: HQD, high-quality signal; SQI, signal quality indicator.
Figure 4
Figure 4
Demonstration of construct validity of the signal index (SQI) sequential grading scoring system. (A) Receiver operating characteristic (ROC) area under the curve (AUC) values plotted across ten iterative refinements of the SQI scoring system (iterations 8-17). Each point reflects the system’s AUC based on comparison to expert-derived reference labels on an independent validation set. (B) Sensitivity, specificity, and accuracy values across the same 10 iterations. Note that all three metrics were calculated independently for each iteration. These plots collectively demonstrate performance stabilization and help identify the optimal iteration. Abbreviations: SQI, signal quality indicator.
Figure 5
Figure 5
Correlation strength between biometric attributes and CBMT-derived signal quality indicator (SQI) scores for the best site in each limb. Spearman rank correlation coefficients (|ρ|) are shown for 10 biometric and physiological variables relative to the best (ie, highest scoring) SQI value from the non-dominant limb (A) and the dominant limb (B). All correlations were weak or very weak (|ρ| < 0.3), indicating minimal association between biometric variation and SQI performance. Vertical dashed lines denote conventional thresholds for correlation strength: very weak (|ρ| = 0.0-0.19), weak (0.20-0.39), moderate (0.40-0.59), strong (0.60-0.79), and very strong (0.80-1.0). Color intensity reflects correlation magnitude using a consistent heatmap scale across both panels. Abbreviations: CBMT, cortical bone mechanics technology.
Figure 6
Figure 6
CBMT signal quality indicator (SQI) subgroup comparisons. Violin plots of the best SQI scores by BMI category (normal: <25 kg/m2, overweight: 25-29.9 kg/m2, obese: ≥30 kg/m2) for the non-dominant (A) and dominant (B) limbs. The asterisk indicates significantly lower SQI score in the obese group for the non-dominant limb, with no difference between the normal and overweight groups. No differences were observed for the dominant limb. Violin plots showing SQI scores for the non-dominant (A) and dominant (B) limbs across BMI categories. Distributions are truncated, with wider sections indicating greater data density. Horizontal lines represent medians. Abbreviations: CBMT, cortical bone mechanics technology.
Figure 7
Figure 7
Graphical abstract summarizing the CBMT signal quality indicator (SQI) system, from device function to validation and biometric performance. CBMT non-invasively measures ulnar flexural rigidity using dynamic 3-point bending combined with vibration-based analysis. A robotic system moves the loading point along the mid-forearm to 10 discrete sites. A fully automated 20-point SQI algorithm quantifies signal fidelity in real time, developed through expert-guided calibration and achieving high classification accuracy (AUC = 0.97). The system demonstrates robust performance across a wide range of biometric profiles, with SQI scores showing minimal correlation with 10 anthropometric and physiological variables, including BMI. Abbreviations: AUC, area under the curve; CBMT, cortical bone mechanics technology.

Similar articles

References

    1. NIH . Osteoporosis, Health and Human Services. Bethesda, MD: National Institutes of Health; 2018: No. 18-AR-8004.
    1. Jackson RD, Mysiw WJ. Insights into the epidemiology of postmenopausal osteoporosis: the Women's Health Initiative. Semin Reprod Med. 2014;32(06):454–462. 10.1055/s-0034-1384629 - DOI - PubMed
    1. Hansen D et al. Medicare cost of osteoporotic fractures: the clinical and cost burden of an important consequence of osteoporosis. Commissioned by the National Osteoporosis Foundation. 2019;
    1. Lewiecki EM, Ortendahl JD, Vanderpuye-Orgle J, et al. Healthcare policy changes in osteoporosis can improve outcomes and reduce costs in the United States. JBMR Plus. 2019;3(9):e10192. 10.1002/jbm4.10192 - DOI - PMC - PubMed
    1. Watts NB. Bone quality: getting closer to a definition. J Bone Miner Res. 2002;17(7):1148–1150. 10.1359/jbmr.2002.17.7.1148 - DOI - PubMed

LinkOut - more resources