. 2025 Aug 6:16:1611818.
doi: 10.3389/fimmu.2025.1611818. eCollection 2025.

Loss of Cullin 5 in myeloid cells protects against autoimmune neuroinflammation

Affiliations

Loss of Cullin 5 in myeloid cells protects against autoimmune neuroinflammation

Yohaniz Ortega-Burgos et al. Front Immunol. .

Abstract

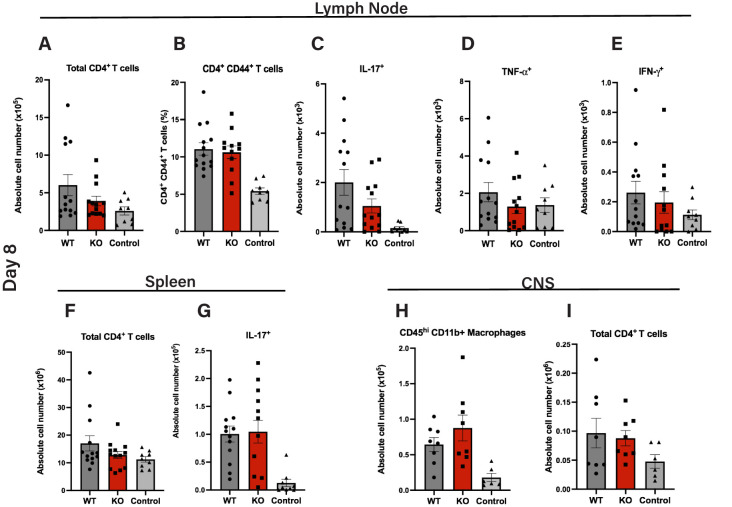
Autoimmune neuroinflammation occurs when an individual's immune cells attack the brain, spinal cord or peripheral nerves. Several Suppressor of Cytokine Signaling (SOCS) proteins have been shown to limit pro-inflammatory signaling pathways in myeloid cells and prevent neuroinflammation. They rely on several mechanisms to accomplish this. Their SH2 domain allows them to bind phosphorylated tyrosine residues on surface receptors to prevent downstream signaling while their C-terminal SOCS domain can promote their assembly with Cullin5 (CUL5) to degrade signaling proteins. To date, the role of CUL5 in myeloid-cell-mediated function is poorly understood. Here we show that loss of Cul5 in myeloid cells resulted in reduced neuroinflammation and attenuated progression of Experimental Autoimmune Encephalomyelitis (EAE). Although peripheral CD4+ T cell activation was not overtly affected, Cul5-deficient macrophages in the Central Nervous System (CNS) demonstrated a significant shift toward an anti-inflammatory phenotype, characterized by increased expression of Arginase 1. This correlated with an enhanced frequency of FoxP3+ regulatory T cells. In contrast to what would be predicted if CUL5 and SOCS proteins work together to degrade pro-inflammatory cytokine signaling, Cul5 deletion in myeloid cells selectively enhanced IL-4-mediated Arginase 1 expression. These findings identify CUL5 as an unanticipated pro-inflammatory mediator during neuroinflammation and reveal its potential as a therapeutic target for autoimmune diseases.

Keywords: Cullin 5; macrophage polarization; macrophages; neuroinflammation; ubiquitin ligase (E3).


Conflict of interest statement

The authors declare that the research was conducted in the absence of any commercial or financial relationships that could be construed as a potential conflict of interest.

Figures

Figure 1
Figure 1
Cul5 does not broadly affect the differentiation of myeloid cells under homeostatic conditions. (A) Western blot analysis of CUL5 expression in BMDMs from Cul5fl/fl LysM-Cre and WT mice. β-actin is shown as a loading control. (B) Representative flow cytometry plots showing WT and Cul5-deficient BMDM differentiation at days 2, 4, and 6 in culture, (n=4 per group). (C) Compiled data from bone marrow-derived macrophage differentiation from Cul5fl/fl LysM-Cre and WT mice. Bars indicate mean ± SEM from two independent experiments. (D) Absolute cell counts in the spleen, bone marrow, and brain of Cul5fl/fl LysM-Cre and WT mice under homeostatic conditions. (E–G) Flow cytometry analysis of myeloid and lymphoid cell populations in the spleen, bone marrow, and brain. Data were analyzed using multiple unpaired t-tests and are representative of two independent experiments (n=5–6 per group). Each dot represents data from a single mouse.
Figure 2
Figure 2
Loss of Cul5 reduces EAE severity. (A) Schematic representation of the experimental timeline for EAE induction following MOG35–55 immunization. (B) Mean clinical scores of Cul5fl/fl LysM-Cre and WT mice over the course of the disease. Disease progression was monitored daily until day 14 post-induction (n = 5–6 mice per group). (C) Mean body weights of MOG immunized mice. (n = 5–6 mice per group). Data in (A–C) are representative of three independent experiments. (D) Representative flow plots of CD4+ T cells in the CNS at day 14 post-EAE induction. (D–I) Quantification of immune cell populations infiltrating the CNS at day 14 post-induction, including total CD4+ T cells (E), neutrophils (F), CD45hi infiltrating myeloid cells (G), CD45int myeloid cells (H), and MHCII+CD80+ macrophages (I). Data represent two independent experiments. Error bars indicate mean ± SEM. Statistical significance was determined using Two-way ANOVA (A, B) or unpaired t-test (D–I) (*P < 0.05, **P < 0.01, ***P < 0.001, ****P < 0.0001).
Figure 3
Figure 3
Similar induction of MOG35–55 peptide-specific T cells in peripheral lymphoid tissues in WT and Cul5fl/fl LysM-Cre mice. Quantification of total numbers and MOG35–55-specific CD4+ T cell responses in cells isolated from secondary lymphoid tissues and CNS of Cul5fl/fl LysM-Cre and WT mice following MOG35–55 immunization. Cells were isolated from the draining lymph nodes at day 8 post induction and analyzed by flow cytometry. Mean cell numbers of CD4+ T cells (A), CD44+ CD4+ T cells (B), and IL-17 (C), TNFα (D), and IFNγ (E) producing T cells. Cells were isolated from the spleen at day 8 post-induction and analyzed by flow cytometry, including total CD4+ T cells (F) and IL-17A+ CD4+ T cells (G) Cells were isolated from the CNS at day 8 post induction and analyzed by flow cytometry. Mean cell numbers of CD4+ T cells (H) and CD45hi microglia/macrophages (I) in the CNS. Results are representative of three independent experiments (A–F) and two independent experiments (G–H) (n=10–11 mice per group). Error bars indicate mean ± SEM. Statistical significance was determined using an unpaired t-test (P < 0.05, P < 0.01, *P < 0.001, **P < 0.0001).
Figure 4
Figure 4
Cul5 deficiency enhances Arginase 1 expression in macrophages during EAE. Quantification of myeloid and lymphoid cell populations in the CNS of Cul5fl/fl LysM-Cre and WT mice at day 12 post-induction of EAE. (A–C) Total cell numbers of CD45+CD11b+ infiltrating myeloid cells, CD45hi Arginase 1+ microglia/macrophages and Ly6G+neutrophils in the CNS following MOG35–55 immunization. (D, E) Frequency of Arginase 1+ cells within the CD45hi and CD45int populations, highlighting the enrichment of Arginase 1-expressing in the CD45hi subset in Cul5-deficient mice. (F) Mean total cell numbers of CD4+ T cells, (F, G) Frequency of conventional CD4+ T cells, and FoxP3+ regulatory T cells in the CNS following MOG35–55 immunization. Data represent pooled results from two independent experiments (n=11 mice per group). Error bars indicate mean ± SEM. Statistical significance was determined using an unpaired t-test (P < 0.05, P < 0.01, *P < 0.001, **P < 0.0001. Each dot represents an individual mouse.
Figure 5
Figure 5
Loss of Cul5 results in increased Arginase 1 levels following IL-4 receptor stimulation of BMDMs. (A) BMDMs were generated from WT and Cul5-deficient mice. Cells were then analyzed for Arginase 1 levels via flow cytometry. Representative and compiled data showing the frequencies of Arginase 1+ cells following IL-4 or IL-13 stimulation (10 ng/mL) for 24 hours. (B) Percentage positive of CD86 and MHCII BMDMs following LPS (100 ng/mL) and IFN-γ (10 ng/mL) stimulation for 24 hours, showing no significant differences in upregulation of co-stimulatory molecules between Cul5fl/fl LysM-Cre and WT macrophages. Results are representative of three independent experiments (n=3–4 mice per group). Error bars indicate mean ± SEM. Statistical significance was determined using an unpaired t-test (**P < 0.01).
Figure 6
Figure 6
Loss of Cul5 triggers an anti-inflammatory protein expression profile in macrophages. (A) Workflow illustrating ex vivo cell isolation for WCP analysis (B) Heatmap displaying the top 20 significantly upregulated and downregulated proteins in Cul5fl/fl LysM-Cre vs WT CD45hi microglia/macrophages. Each row represents a protein, and each column represents a biological replicate. Normalized Z score of protein abundance is depicted using a pseudocolor scale. (C) Volcano plot displaying the distribution of differentially expressed proteins between Cul5fl/fl LysM-Cre and WT macrophages. The x-axis represents the log2 fold change (log2FC) in protein abundance, while the y-axis represents the log10 (p-value), indicating statistical significance. Proteins significantly downregulated in Cul5fl/fl LysM-Cre are shown in blue, while those upregulated are shown in red. Proteins with no significant changes are represented in gray. Dashed horizontal lunes indicate significance and fold-change thresholds used for analysis. (D-I) show individual violin plots for (D) Clec4e, (E) Ssr1, (F) Lyz2, (G) Atm, (H) Serpinb6, (I) AIdh5a1 (J) Ucp2 displaying log2‐normalized protein abundances as measured by whole‐cell proteomics in WT and Cul5fl/fl LysM-Cre. Protein intensities were normalized and plotted for individual replicates. Violin plots represent the mean. Statistical analysis was performed using Student’s t-test (**P<0.01, ***P<0.001, ****P<0.0001).

References

    1. Mosser DM, Edwards JP. Erratum: Exploring the full spectrum of macrophage activation (Nature Reviews Immunology, (2008) 8 (958-969)). Nat Rev Immunol Nat Publishing Group. (2010) 10:460. doi: 10.1038/nri2788 - DOI - PMC - PubMed
    1. Nasser H, Adhikary P, Abdel-Daim A, Noyori O, Panaampon J, Kariya R, et al. Establishment of bone marrow-derived M-CSF receptor-dependent self-renewing macrophages. Cell Death Discov. (2020) 6. doi: 10.1038/s41420-020-00300-3, PMID: - DOI - PMC - PubMed
    1. Stout RD, Suttles J. Immunosenescence and macrophage functional plasticity: dysregulation of macrophage function by age-associated microenvironmental changes. Immunol Rev. (2005) 205:60–71. doi: 10.1111/j.0105-2896.2005.00260.x, PMID: - DOI - PMC - PubMed
    1. Hirayama D, Iida T, Nakase H. The phagocytic function of macrophage-enforcing innate immunity and tissue homeostasis. Int J Mol Sci. (2018) 19. doi: 10.3390/ijms19010092, PMID: - DOI - PMC - PubMed
    1. Verberk SGS, van der Zande HJP, Baardman J, de Goede KE, Harber KJ, Keuning ED, et al. Myeloid ATP citrate lyase regulates macrophage inflammatory responses in vitro without altering inflammatory disease outcomes. Front Immunol. (2021) 12:669920. doi: 10.3389/fimmu.2021.669920, PMID: - DOI - PMC - PubMed

MeSH terms

LinkOut - more resources