

Analytical Method Development Using Quantum Laser Cascade Spectroscopy with Diffuse and Attenuated Total Reflectance for Determining Low Concentrations of Active Pharmaceutical Ingredients
- PMID: 40843101
- PMCID: PMC12366802
- DOI: 10.26420/austinjanalpharmchem.2023.1157
Analytical Method Development Using Quantum Laser Cascade Spectroscopy with Diffuse and Attenuated Total Reflectance for Determining Low Concentrations of Active Pharmaceutical Ingredients
Abstract
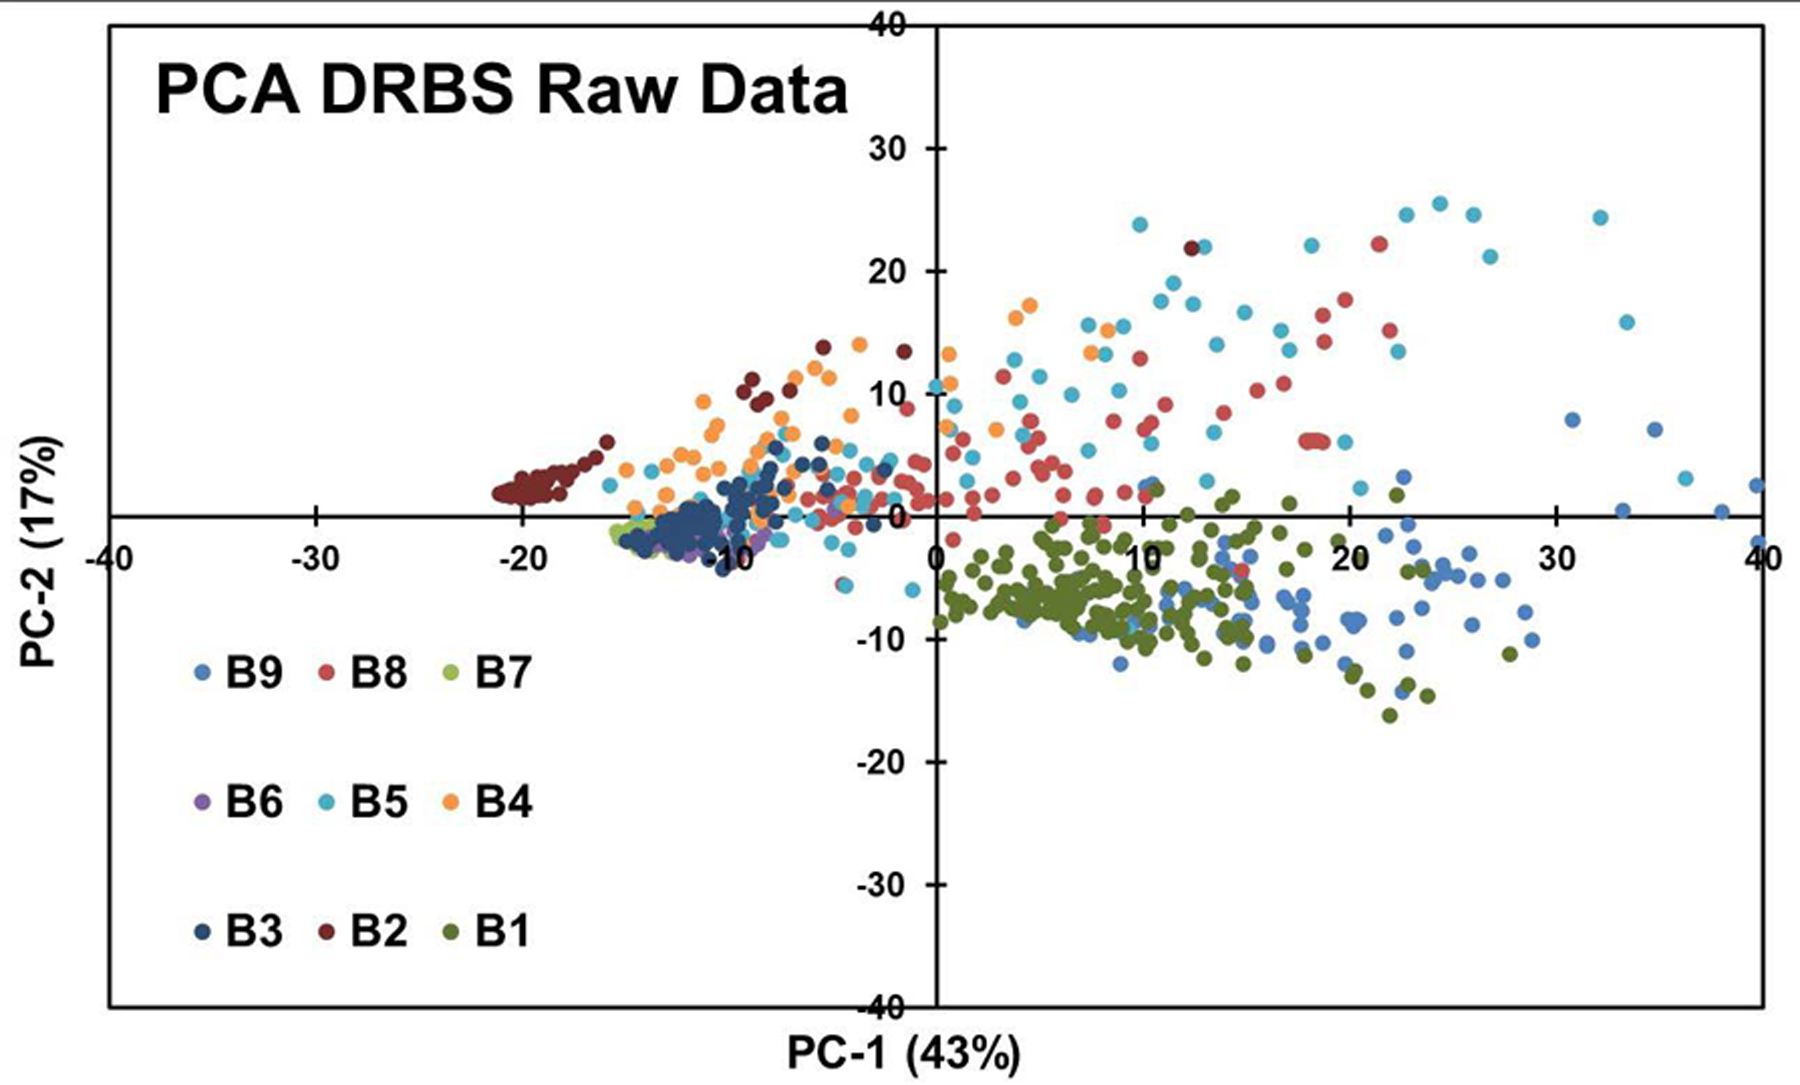
Quantum Cascade Laser Spectroscopy (QCLS) will quantify acetaminophen as an active pharmaceutical ingredient in different low concentrations formulations in tablet presentation. Tablets contain acetaminophen in nine blends ranging from 0.0% to 3.0% w/w, with mannitol, croscarmellose, cellulose, and magnesium stearate, as excipients. The tablets were analyzed in non-contact mode by mid-infrared attenuated total reflectance and diffuse reflectance backscattering. Measurements were conducted covering the spectral range 770-1890 cm-1. Calibrations were generated by applying multivariate analysis using principal component analysis. The high power of the quantum cascade laser-based spectroscopic system attached to attenuated total reflectance and diffuse reflectance backscattering resulted in the design of discrimination methodologies for pharmaceutical applications with acetaminophen as an active pharmaceutical ingredient in the formulation. The main conclusion is that attenuated total reflectance is better for other analyses. For tablet analysis using mid-infrared quantum cascade lasers, diffuse reflectance backscattering is more accurate for predicting the API content. QCLS is gaining even more acceptance as a valuable tool in Process Analytical Technology.
Keywords: Active pharmaceutical ingredients; Content uniformity; Diffuse reflectance backscattering; Principal component analysis; Process analytical technology; Quantum cascade lasers.
Figures


References
-
- Ropero J, Beach L, Alcalà M, Rentas R, Davé RN, Romañach RJ. Near-infrared spectroscopy for the in-line characterization of powder voiding part I: Development of the methodology. J Pharm Innov 2009; 4: 187–97.
-
- Andrews D, Geentjens K, Igne B, McGeorge G, Owen A, Pedge N, et al. Analytical method development using transmission Raman spectroscopy for pharmaceutical assays and compliance with regulatory guidelines—Part I: Transmission Raman spectroscopy and method development. J Pharm Innov 2018; 13: 121–32.
-
- Shimamura R, Koide T, Hisada H, Inoue M, Fukami T, Katori N, et al. Pharmaceutical quantification with univariate analysis using transmission Raman spectroscopy. Drug Dev Ind Pharm 2019; 45: 1430–6. - PubMed
-
- Szostak R, Mazurek S. Quantitative determination of acetylsalicylic acid and acetaminophen in tablets by FT-Raman spectroscopy. Analyst. 2002; 127: 144–8. - PubMed
-
- Gómez DA, Coello J, Maspoch S. Raman spectroscopy for the analytical quality control of low-dose break-scored tablets. J Pharm Biomed Anal 2016; 124: 207–15. - PubMed
Grants and funding
LinkOut - more resources
Full Text Sources