. 2025 Aug 20;12(8):250491.
doi: 10.1098/rsos.250491. eCollection 2025 Aug.

A mathematical model of human oesophageal motility function

Affiliations

A mathematical model of human oesophageal motility function

Takashi Miura et al. R Soc Open Sci. .

Abstract

Recent advances in various observation methods revealed several unique characteristics of oesophageal peristalsis and its disorders. However, a framework for understanding the oesophageal motility pattern is lacking. Here, we propose a simple mathematical model of the human oesophageal motility function. The model comprises central nervous system signals, enteric nervous system neurons (interneurons and motoneurons) and oesophageal smooth muscles. The neural function implements excitable dynamics at the oesophageal body and toggle-switch dynamics at the lower oesophageal sphincter. The local signal transmission in enteric nervous system and 'the law of the intestine' were also incorporated. The model behaviours can be understood using mathematical analysis, and we could reproduce the physiological dynamics of the normal oesophagus-deglutitive inhibition, unidirectional pulse transmission, restoration of lower oesophageal sphincter constriction and dilatation of the anal side of the pulse. In addition, we could reproduce various pathological motility patterns described in the Chicago classification by the combinations of parameter changes, which may provide insights into the possible pathogenesis of these disorders.

Keywords: high-resolution manometry; mathematical modelling; oesophageal motility.


Conflict of interest statement

T.M.,H.I., Y.H., H.T.-I., K.S., S.-I.E., E.I., and Y.O. declare no conflict of interest in this study.

Figures

Human esophageal peristalsis.
Figure 1.
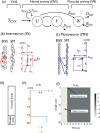
Human oesophageal peristalsis. (a) Schematic of the oesophagus and stomach, frontal view. (b) Typical pattern of oesophageal peristalsis in high-resolution manometry (HRM). The purple rectangle indicates the region of interest of this study. (c) A reconstructed cylindrical representation of impedance-derived distension and pressures (modified from [5]). (d) An example of secondary peristalsis that originates from the centre of the oesophagus (red arrow), showing unidirectionality of the pulse. (e) Multiple swallowing results in the transmission of only the last pulse. IRP remains normal (black rectangle). Pseudocolour represents oesophageal pressure.
Model description.
Figure 2.
Model description. (a) The model consists of CNS signal (SCNS), neural activity (U, V) and muscular activity (W). CNS, central nervous system; ENS, enteric nervous system; SM, smooth muscle. (b) Definition of the interneuron kernel KIN. The kernel has a short-range ‘stimulatory’ region that deviates to the anal side. (c) Definition of the motoneuron kernel KMN. The kernel consists of a long-range ‘inhibitory’ region, which implements the distension at the anal side (figure 1d). (d) Schematic of the difference between LES and oesophageal body. The oesophageal body is excitable, and the LES region is bistable. (e) Initial condition of U and V. (f) Definitions of positive and negative stimuli by single swallowing (SCNS).
Dynamics of the model behavior.
Figure 3.
Dynamics of the model behaviour. (a,b) Implementation of excitability and bistability. (a) Nullclines (solid line) and temporal responses (dashed line) at the excitable region. Blue lines represent normal cases, and green lines represent pathologically high amplitude cases. (b) Nullcline (solid line) and temporal response (dashed line) at the bistable region. (c,d) Unidirectional pulse propagation. (c) Effect of d on unidirectional pulse propagation. (d) Intuitive explanation of the disappearance of a backward pulse.
Numerical simulations of the normal esophagus.
Figure 4.
Numerical simulations of the normal oesophagus. (a) Numerical simulation results show a steady state of the oesophagus without stimulus. LES contraction is maintained. (b) Dynamics of a pulse after swallowing. The pattern reproduces the actual HRM pattern (figure 1b). (c) Distension–contraction plot view of the numerical simulation result. (d) Unidirectional transport of the pulse in the model. When the centre of the oesophageal body is stimulated, only a forward pulse is transmitted. (e) Definition of SCNS for repeated stimulus. Inhibitory signals from the next swallow mask the previous positive stimulus. (f) Result of multiple swallowing in the model. Only the last signal is transmitted. IRP remains normal (black rectangle).
Reproduction of disorders of EGJ outflow.
Figure 5.
Reproduction of disorders of oesophagogastric junction (EGJ) outflow. (a–d) HRM pattern (a) and numerical simulations (b–d) of EGJ outflow obstruction (EGJOO). Normal pulse transmission (black arrows) and loss of LES relaxation (red arrows) are observed. (b) Low iCNS. (c) Low TENS at LES. (d) High BSM at LES. (e–h) HRM pattern (e) and numerical simulations (f–h) of type I achalasia. Lack of pulse transmission and loss of LES relaxation are observed. (f) Low sCNS and Low iCNS. (g) Low sCNS and low TENS at LES. (h) Low sCNS and high BSM at LES. (i–l) HRM pattern (i) and numerical simulation (j–l) of type II achalasia. Lack of pulse transmission, loss of LES relaxation and PEP are observed. Reduced LES relaxation (red arrows) and PEP are observed (red arrowheads). (j) Low sCNS, low iCNS and PEP. (k) Low sCNS, low TENS at LES and PEP. (l) Low sCNS, high BSM at LES and PEP. (m–p) HRM pattern (m) and numerical simulation (n–p) of type III achalasia. Reduced LES relaxation (red solid arrows) and premature contraction (red dashed arrowheads) are observed. (n) High rIN and low iCNS. (o) High rIN and low TENS at LES. (p) High rIN and high BSM at LES.
Reproduction of esophageal body anomaly.
Figure 6.
Reproduction of oesophageal body anomaly. (a–e) Distal oesophageal spasm. Normal LES relaxation (black arrows) and accelerated excitation wave (dashed red arrows) are observed. (a) HRM pattern [24]. (b) Low TENS at body. (c) High sIN. (d) High rIN. (e) High dIN. (f–j) Absent contractility. The contraction pulse disappears. (f) HRM pattern. (g) Low sCNS. (h) High TENS at body. (i) Low sIN. (j) Low ESM. (k–o) Jackhammer oesophagus. Strong contraction is observed. (k) HRM pattern of short-duration jackhammer oesophagus. (l) HRM pattern of long-duration jackhammer oesophagus. (m) High AENS at body. (n) High ESM. (o) Low DSM.

Similar articles

References

    1. Hall JE. 2021. Guyton and hall textbook of medical physiology, 14th edn. Philadelphia, PA, USA: Elsevier.
    1. Goyal RK, Chaudhury A. 2008. Physiology of normal esophageal motility. J. Clin. Gastroenterol. 42, 610–619. ( 10.1097/MCG.0b013e31816b444d) - DOI - PMC - PubMed
    1. van Hoeij FB, Bredenoord AJ. 2016. Clinical application of esophageal high-resolution manometry in the diagnosis of esophageal motility disorders. J. Neurogastroenterol. Motil. 22, 6–13. ( 10.5056/jnm15177) - DOI - PMC - PubMed
    1. Mashimo H, Goyal RK. 2006. Physiology of esophageal motility. GI Motility Online. ( 10.1038/gimo3) - DOI
    1. Mittal RK, Muta K, Ledgerwood-Lee M, Gandu V, Zifan A. 2021. Abnormal esophageal distension profiles in patients with functional dysphagia: a possible mechanism of dysphagia. Gastroenterology 160, 1847–1849. ( 10.1053/j.gastro.2020.12.002) - DOI - PubMed

LinkOut - more resources