

Mechanisms of hepatic dysfunction in Nile tilapia (Oreochromis n iloticus) fed a high-fava bean (Vicia faba L.) diet
- PMID: 40843215
- PMCID: PMC12365109
- DOI: 10.1016/j.aninu.2025.01.013
Mechanisms of hepatic dysfunction in Nile tilapia (Oreochromis n iloticus) fed a high-fava bean (Vicia faba L.) diet
Abstract
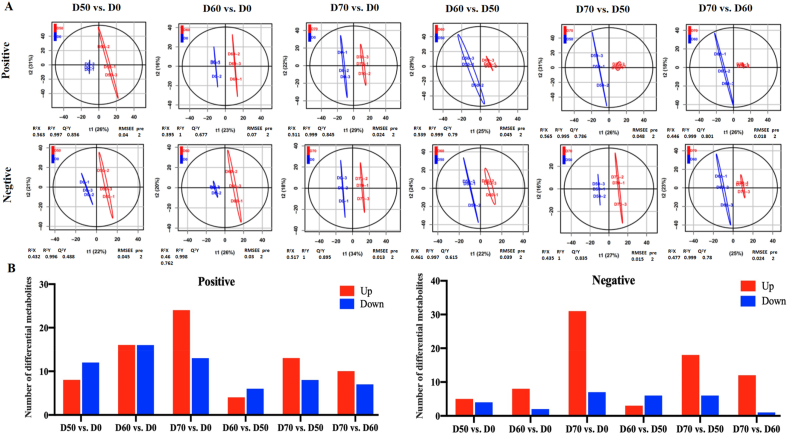
Fava bean is currently utilized as a specialized feed ingredient to enhance the muscle texture of fish. When incorporated at appropriate levels, fava beans can improve fish muscle crispy texture. However, high dietary levels of fava beans may lead to liver damage in fish, although the specific mechanisms behind this effect remain unclear. In this study, 600 genetic improvement of farmed tilapia (GIFT; Oreochromis niloticus) of uniform size (initial body weight 552.3 ± 10.12 g) and healthy appearance were randomly divided into four groups, each with three replicates of 50 fish. The fish diets contained different levels of fava beans (0, 50%, 60%, and 70%), designated as D0, D50, D60, and D70, respectively, over a ten-week feeding experiment. A comprehensive analysis of the impact of fava beans on muscle texture and liver health in GIFT was performed. The results showed that 50%, 60%, and 70% dietary fava beans had no significant effect on the growth performance of GIFT (P > 0.05), but 70% dietary fava beans increased feed conversion ratio (FCR) (P = 0.022). Consumption of fava beans at levels of 50%, 60%, and 70% in the diet altered GIFT muscle texture (P < 0.05), and adversely effected serum biochemistry and liver health (P < 0.05). Non-targeted metabolome analysis of the liver revealed that dietary fava beans may cause irreversible damage to liver cells by disrupting the DNA methylation process (P < 0.05). This finding enhances the understanding of the mechanisms behind the negative impact of fava bean consumption on liver function. It is crucial to investigate potential strategies to mitigate these adverse effects while maintaining the desired muscle quality when fava beans are used in aquatic feed.
Keywords: Fava bean; Liver health; Metabolomics; Muscle texture; Tilapia.
© 2025 The Authors.
Conflict of interest statement
We declare that we have no financial and personal relationships with other people or organizations that can inappropriately influence our work, and there is no professional or other personal interest of any nature or kind in any product, service and/or company that could be construed as influencing the content of this paper.
Figures


References
-
- Abdel-Tawwab M., Hagras A.E., Elbaghdady H.A.M., Monier M.N. Dissolved oxygen level and stocking density effects on growth, feed utilization, physiology, and innate immunity of Nile tilapia, Oreochromis niloticus. J Appl Aquacult. 2014;26:340–355.
-
- AOAC . 18th ed. AOAC International; Gaithersburg, MD: 2006. Official methods of analysis.
-
- Canuto G.A.B., da Costa J.L., da Cruz P.L.R., de Souza A.R.L., Faccio A.T., Klassen A., Rodrigues K.T., Tavares M.F.M. Metabolomics: definitions, state-of-the-art and representative applications. Quim Nova. 2018;41(1):75–91.
-
- Cong J., Zhang L., Li J., Wang S., Gao F., Zhou G. Effects of dietary supplementation with carnosine on growth performance, meat quality, antioxidant capacity and muscle fiber characteristics in broiler chickens. J Sci Food Agric. 2017;97:3733–3741. - PubMed
LinkOut - more resources
Full Text Sources
