. 2025 Aug 19:16:20417314251348038.
doi: 10.1177/20417314251348038. eCollection 2025 Jan-Dec.

Formation of neutrophil extracellular traps in the early stages exacerbate the healing process by regulating macrophage polarization in Achilles tendon-bone injury

Affiliations

Formation of neutrophil extracellular traps in the early stages exacerbate the healing process by regulating macrophage polarization in Achilles tendon-bone injury

Yiqin Zhou et al. J Tissue Eng. .

Abstract

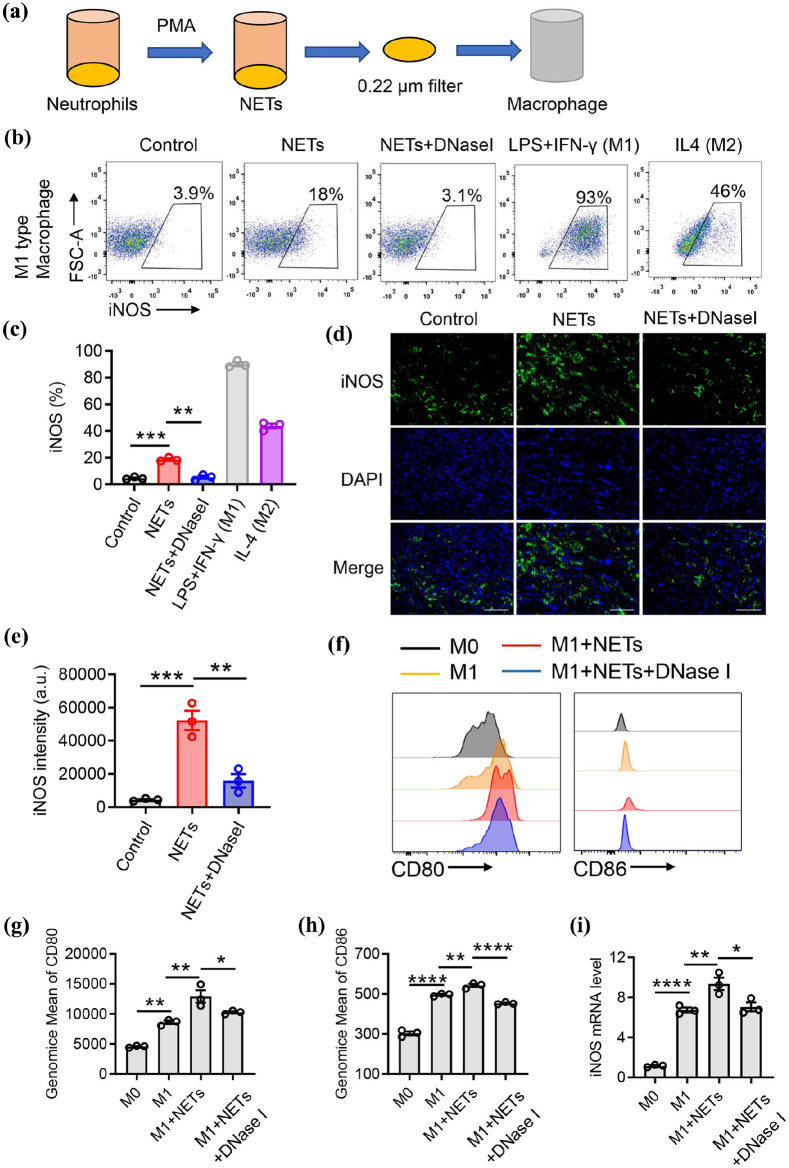
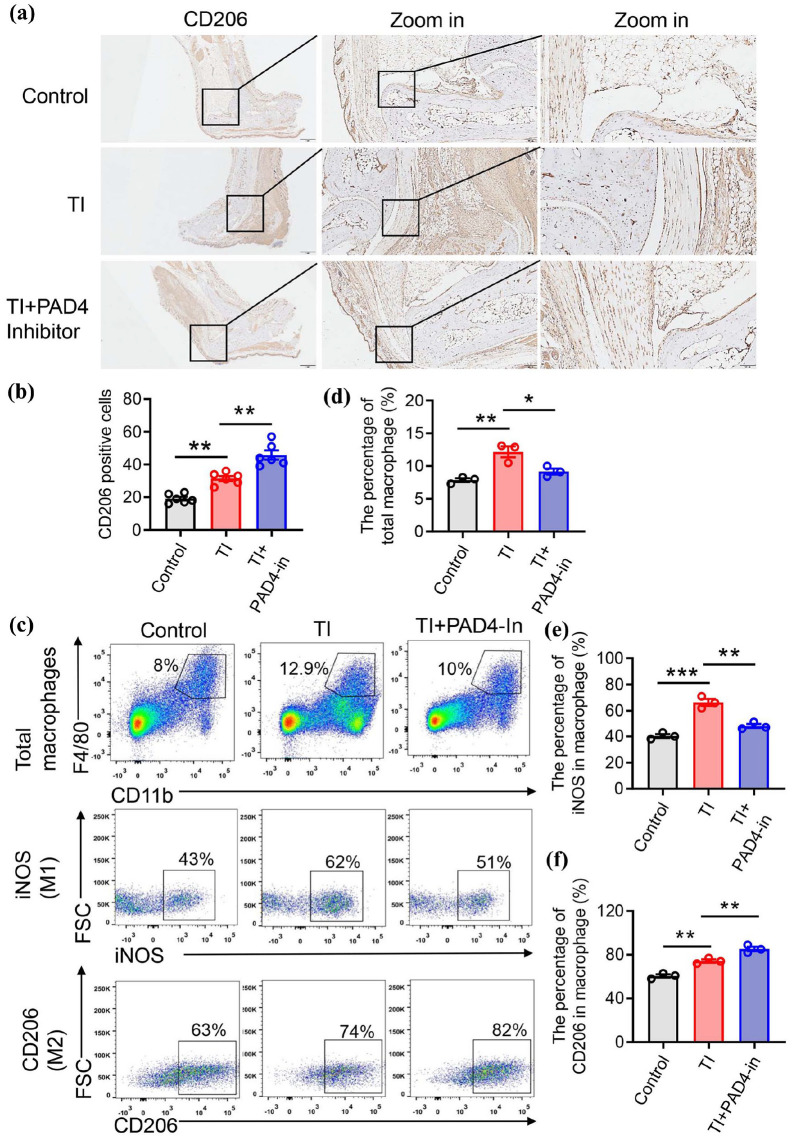
The influence of neutrophils and of neutrophil extracellular traps (NETs) on post-traumatic tendon-to-bone healing was studied in a murine model. The impact of neutrophil infiltration on macrophage polarization and peritendinous fibrosis in early-stage Achilles tendon injury is reported. Mice underwent Achilles tendon-bone injury and divided into four groups: sham operation, tendon injury (TI) treated with acetylcellulose (vehicle control), TI treated with a Protein arginine deiminase-4 (PAD4) inhibitor GSK484, and TI treated with a neutrophil elastase inhibitor Sivelestat. Each group was monitored for 21 days. Post-traumatic neutrophil infiltration and NET formation were assessed using flow cytometry and immunofluorescence. Immunohistochemistry, Western blot, and qPCR were used to evaluate macrophage polarization. Peritendinous fibrosis was assessed using Masson staining and Western blot. Neutrophil infiltration and NET formation increased significantly in the tendon following injury. A significant increase in M1-related markers and a decrease in M2-related markers were associated with NET formation. NET Inhibition using GSK484 or sivelestat reduced M1 markers and increased M2 markers. Furthermore, NET inhibition during the early stage suppressed peritendinous fibrosis and reduced inflammation during the healing process. In co-culture experiments, NETs induced proinflammatory cytokine secretion and upregulated M1 markers in bone marrow-derived macrophages while downregulating M2 markers. nlsNETs promote early-phase tendon-bone injury by inducing M1 macrophage polarization and peritendinous fibrosis. Targeting NETs during the initial phase of tendon injury could potentially facilitate the healing process.

Keywords: fibrosis; macrophages; neutrophil extracellular traps; neutrophils; tendon-bone injury.


Conflict of interest statement

The author(s) declared no potential conflicts of interest with respect to the research, authorship, and/or publication of this article.

Figures

Graphic
Graphic
The image consists of six panels (a-d) with text (e-f) and statistical data.1. Experimental mouse model with tissue preparation and treatment schedule, showing cell infiltration and NET formation.2. Western blot of two cell types showing protein fold changes after treatment.3. Flow cytometry plots of cell populations showing fold changes after treatment.4. Representative western blot of MPO, cit-H3, and Hoechst staining for three treatment groups.5. Western blot quantifying MPO and cit-H3 levels after treatment for three groups.6. Western blot quantifying MPO and cit-H3 levels after treatment for three groups.The image provides a comprehensive set of data and observations regarding the treatment of tendon injury using NET inhibitors, highlighting the effects on cell infiltration and NET formation.
Figure 1.
Inhibition of NETs with GSK484 or sivelestat reduces neutrophil infiltration and NET formation following tendon injury. (a) Schematic of the experimental mouse model. Mice underwent surgical transection of the Achilles tendon at the calcaneal insertion site, followed by daily treatment with vehicle (corn oil), GSK484, or sivelestat for three consecutive days. Tissues were harvested on day 3 post-surgery. (b and c) Flow cytometry analysis (b) and representative plots (c) of neutrophils (CD11b+Ly6G+) and macrophages (CD11b+F4/80+) from control, tendon injury (TI), TI + PAD4 inhibitor, and TI + NE inhibitor groups. n = 6 mice/group. (d) Confocal immunofluorescence images showing MPO (green), citrullinated histione H3 (cit-H3, purple), and Hoechst (blue) in tendon sections. Scale bars, 150 µm. (e and f) Quantification of MPO (e) and cit-H3 (f) fluorescence intensities. Data are presented as the mean ± SEM. n = 6 mice/group. Statistical significance determined by one-way ANOVA (c, e, and f). *p < 0.05, **p < 0.01, ****p < 0.0001.
This image consists of six panels showing comparative immunofluorescence and flow cytometry analyses of neutrophils from rotator cuff injury (RCI) patients and healthy volunteers (HVs). Panel (a) displays fluorescence intensities of Hoechst, Sytox Green, cit-H3, and MPO, indicating ROS and cit-H3 levels. Panels (b-c) quantify extracellular DNA and cit-H3 intensity, respectively, with higher values in RCI patients. Panel (d) shows CD11b+CD66b+ neutrophils’ CD11b expression. Panel (e) illustrates increased cell percentage from RCI patients compared to HVs. Panel (f) shows a flow cytometry scatter plot and cit-H3 staining, indicating higher cit-H3 in RCI patients. Panel (g) quantifies cit-H3 percentage, with higher values in RCI patients. Data is analyzed statistically, showing significance with **** (p < 0.0001). Neutrophil NETs formation is also analyzed comparing RCI and HV samples, showing a higher percentage in RCI patients with the use of PMA or in vitro incubation of RCI neutrophils.
Figure 2.
NET formation is enhanced in neutrophils from RCI patients compared with healthy volunteers (HVs). (a) Immunofluorescence staining of Hoechst (Blue), Sytox Green (Green), cit-H3 (Red), and MPO (magenta) in neutrophils from rotator cuff injury (RCI) patients and HVs. Cells were treated with DMSO or PMA. Scale bar, 10 μm. (b) Quantification of extracellular DNA per field of view. (c) Quantification of cit-H3 intensity. (d) Flow cytometry analysis of CD11b+CD66b+ neutrophils from RCI patients and HVs. (e) Quantification of cell percentage. (f) Flow cytometry analysis of NETs formation in CD11b+CD66b+ neutrophils after PMA treatment. (g) Quantification of cell percentage of cit-H3. n = 6 HVs or RCI patients. Data are presented as the mean ± SEM. Significance was examined by unpaired two-sided Student’s t test (e) or one-way ANOVA (b, c, and g). ****p < 0.0001.
A diagram is shown, showing H&E staining, histological healing scores, and cartilage regeneration from the control, TI, TI+PAD4 inhibitor, and TI+NE inhibitor groups.
Figure 3.
GSK484 or sivelestat treatment attenuates tendon injury and enhances cartilage regeneration. (a) Mouse model schematic. Achilles tendon transection was followed by 3-day treatment and tissue harvesting at day 21. (b and c) H&E staining (b) and histological healing scores (c) from control, TI, TI + PAD4 inhibitor, and TI + NE inhibitor group. (d and e) Representative safranin O staining (d) and cartilage regeneration from the control, TI, TI + PAD4 inhibitor, and TI + NE inhibitor groups. n = 6 mice/group. Data are presented as the mean ± SEM. Significance was examined by one-way ANOVA (c and e). *p < 0.05, ****p < 0.001, ****p < 0.0001.
The image presents a study on the effects of TIM and NE inhibition on peritendinous fibrosis. It includes Masson’s trichrome staining and fibrotic area quantification, western blot analysis of fibronectin, collagen I, and α-SMA, qPCR analysis of Snail, MMP9, and TIMP1 mRNA expression, and ELISA analysis of IL-1β, TNF-α, and TGF-β in serum. The study reveals a significant decrease in fibrotic area and protein expression in the TI + PAD4 inhibitor and TI + NE inhibitor groups compared to the control group. Statistical analysis indicates significant differences, with the NE inhibitor showing the most significant effect on reducing fibrosis.
Figure 4.
NETs inhibition alleviates peritendinous fibrosis. (a and b) Masson’s trichrome staining (a) and quantification of fibrotic area from control, TI, TI + PAD4 inhibitor, and TI + NE inhibitor groups. n = 6 mice/group. (c and d) Western blot (c) and quantitative analysis of fibronectin, collagen I, and α-SMA. n = 3 mice/group. (e) qPCR analysis of Snail, MMP9 and TIMP1 mRNA expression from control, TI, TI + PAD4 inhibitor, and TI + NE inhibitor groups. n = 3 mice/group. (f) ELISA analysis of IL-1β, TNF-α and TGF-β in serum from control, TI, TI + PAD4 inhibitor, and TI + NE inhibitor groups. n = 3 mice/group. Data are presented as the mean ± SEM. Significance was examined by unpaired two-sided Student’s t test (b) or one-way ANOVA (d–f). *p < 0.05, **p < 0.01. ***p < 0.001, ****p < 0.0001.
Figure 5.
Figure 5.
PMA-induced NETs enhance M1 macrophage polarization. (a) Schematic of in vitro macrophage stimulation with NET-containing medium. (b) Flow cytometry analysis of iNOS M1 macrophages (CD11b+F4/80+) after stimulated with the cultured medium from control, NETs, NETs + DNaseI, LPS + IFN-γ (M1), and IL4 (M2) groups. (c) Quantification of iNOS expression. (d) Confocal analysis of iNOS (M1; green) and DAPI (blue) in neutrophils after stimulated with the cultured medium from control, NETs, and NETs + DNaseI groups. Scale bars, 5 µm. (e) Representative analysis of the iNOS intensity. (f) Flow cytometry analysis of the CD80 and CD86. (g and h) Quantification of Genomic mean of CD80 and CD86. (i) qRCR of iNOS mRNA from indicated groups. Each group included three technical replicates. The results were performed at least two-independent experiment. Data are presented as the mean ± SEM. Significance was examined by one-way ANOVA (c, e and g–i). *p < 0.05, **p < 0.01. ***p < 0.001, ****p < 0.0001.
The image is a comprehensive presentation of various biological assays and their outcomes, focusing on the study of macrophage polarization and cytokine levels.
Figure 6.
NETs suppress IL-4–induced M2 macrophage polarization. (a) Flow cytometry of macrophages (CD11b+F4/80+). (b) Flow cytometry analysis of CD206 from macrophages (CD11b+F4/80+) after stimulated with the cultured medium from control, NETs, NETs + DNasel, LPS + IFN-γ (M1), and IL4 (M2) groups. (c) Quantification of CD206 . (d) M2 macrophage were induced after IL-4 treatment. Cultured medium from PMA-induced NETs or PMA-induced NETs with DNase I treatment were added. (e) Quantification of CD206. (f) qPCR analysis of Arginase 1 mRNA expression. (g) ELISA analysis of IL-10 and TGF-β from cultured medium in control, LPS, LPS + NETs, and LPS + NETs + DNaseI groups. (h) ELISA analysis of TNF-α and IL-6 from cultured medium in control, IL4, IL4 + NETs, and IL4 + NETs + DNaseI groups. Each group included three technical replicates. The results were performed at least two-independent experiment. Data are presented as the mean ± SEM. Significance was examined by one-way ANOVA (c, e and g, h). *p < 0.05, **p < 0.01, ****p < 0.0001.
Immunohistochemical analysis of macrophage polarization and protein expression in tendon-bone section and tendon tissue after tendon-bone injury. (a, b, c, d) and (e, f) represent quantification and expression of different protein markers. Data indicates that PAD4 inhibition reduces M1 macrophage polarization and decreases inflammatory protein expression in tendon-bone injury. Significance was examined by one-way ANOVA. Scale bar = 1 mm. Data are presented as the mean ± SEM. Significance was examined by one-way ANOVA (b, d, and f). **P < 0.01, ****p < 0.0001. Data are presented as the mean ± SEM. Significance was examined by one-way ANOVA. Scale bar = 1 mm. Data are presented as the mean ± SEM. Significance was examined by one-way ANOVA. **P < 0.01, ****p < 0.0001.
Figure 7.
PAD4 inhibition reduces M1 macrophage polarization after tendon-bone injury. (a) Immunohistochemistry (IHC) analysis of CD68 in tendon-bone section from control, TI, and TI + PAD4 inhibitor groups. (b) Quantification of CD11c positive cells. n = 6 mice/group. (c) IHC analysis of CD11c in tendon section from control, TI, and TI + PAD4 inhibitor groups. (d) Quantitative analysis of CD11c positive cells in c. n = 6 mice/group. (e) Western blot of iNOS, TLR4 and IL-1β in tendon tissue from control, TI, and TI + PAD4 inhibitor groups. (f) Quantification of relative gray intensity/GAPDH in c. n = 3 mice/group. Data are presented as the mean ± SEM. Scale bar = 1 mm. Significance was examined by one-way ANOVA (b, d, and f). **P < 0.01, ****p < 0.0001.
The image presents a series of experimental results on the effect of PAD4 inhibition on macrophage polarization in the context of tendon injury (TI). Each panel shows different aspects of the study:(a) Immunohistochemistry (IHC) analysis of CD206 in tendon-bone sections from control groups and those treated with TI and TI with Pad4 inhibitor. The images show a close-up comparison of CD206 expression in the tissue, indicating higher expression levels in the presence of TI.(b) Quantification of CD206 positive cells using a bar graph. This data shows that TI treatment results in an increase in CD206 positive cells compared to the control, and this increase is more pronounced with the addition of the Pad4 inhibitor.(c) Flow cytometry analysis of total macrophages, iNOS, and CD206. The data is presented in scatter plots for CD206 and iNOS, and a histogram for total macrophages. TI treatment increases the percentage of macrophages expressing these markers, and this effect is more pronounced with the Pad4 inhibitor.(d) Quantification of the percentages of total macrophages. A bar graph shows that the percentage of total macrophages is significantly higher in the TI and TI with Pad4 inhibitor groups compared to the control, with the Pad4 inhibitor showing the most significant increase.(e) Quantitative analysis of iNOS in macrophages. A bar graph shows that the peak iNOS percentage is significantly higher in the Ti + PAD4-in group compared to the control.(f) Quantitative analysis of CD206 in macrophages. A bar graph shows that the peak CD206 percentage is significantly higher in the Ti + PAD4-in group compared to the control.Each group included three technical replicates, and the significance of the differences was examined by one-way ANOVA. The results suggest that PAD4 inhibition promotes an increase in macrophage polarization towards an M2 phenotype following tendon injury.
Figure 8.
PAD4 inhibition promotes M2 macrophage polarization following tendon injury. (a) IHC analysis of CD206 in tendon-bone section from control, TI, and TI + PAD4 inhibitor groups (n = 6). (b) Quantification of CD206 positive cells. n = 6 mice/group. (c) Flow cytometry analysis of macrophages (CD11b+F4/80+) and iNOS, CD206 in control, TI, and TI + PAD4 inhibitor groups. (d) Quantification of the percentages of total macrophages. (e) Quantitative analysis of iNOS in macrophages (CD11b+F4/80+). (f) Quantitative analysis of CD206 in macrophages (CD11b+F4/80+). Each group included three technical replicates (d–f). Data are presented as the mean ± SEM. Significance was examined by one-way ANOVA (b and d–f). *p < 0.05. **p < 0.01, ***p < 0.001.

Similar articles

References

    1. Darby IA, Zakuan N, Billet F, et al. The myofibroblast, a key cell in normal and pathological tissue repair. Cell Mol Life Sci 2016; 73: 1145–1157. - PMC - PubMed
    1. Zheng W, Song J, Zhang Y, et al. Metformin prevents peritendinous fibrosis by inhibiting transforming growth factor-β signaling. Oncotarget 2017; 8: 101784–101794. - PMC - PubMed
    1. Yao Z, Wang W, Ning J, et al. Hydroxycamptothecin inhibits peritendinous adhesion via the endoplasmic reticulum tress-dependent apoptosis. Front Pharmacol 2019; 10: 967. - PMC - PubMed
    1. Shapouri-Moghaddam A, Mohammadian S, Vazini H, et al. Macrophage plasticity, polarization, and function in health and disease. J Cell Physiol 2018; 233: 6425–6440. - PubMed
    1. Sunwoo JY, Eliasberg CD, Carballo CB, et al. The role of the macrophage in tendinopathy and tendon healing. J Orthop Res 2020; 38: 1666–1675. - PubMed

LinkOut - more resources