

Combined Effects of PFAS, Social, and Behavioral Factors on Liver Health
- PMID: 40843721
- PMCID: PMC12372029
- DOI: 10.3390/medsci13030099
Combined Effects of PFAS, Social, and Behavioral Factors on Liver Health
Abstract
Background: Environmental exposures, such as per- and polyfluoroalkyl substances (PFAS), in conjunction with social and behavioral factors, can significantly impact liver health. This research investigates the combined effects of PFAS (perfluorooctanoic acid (PFOA) and perfluorooctane sulfonate (PFOS), alcohol consumption, smoking, income, and education on liver function among the U.S. population, utilizing data from the 2017-2018 National Health and Nutrition Examination Survey (NHANES).
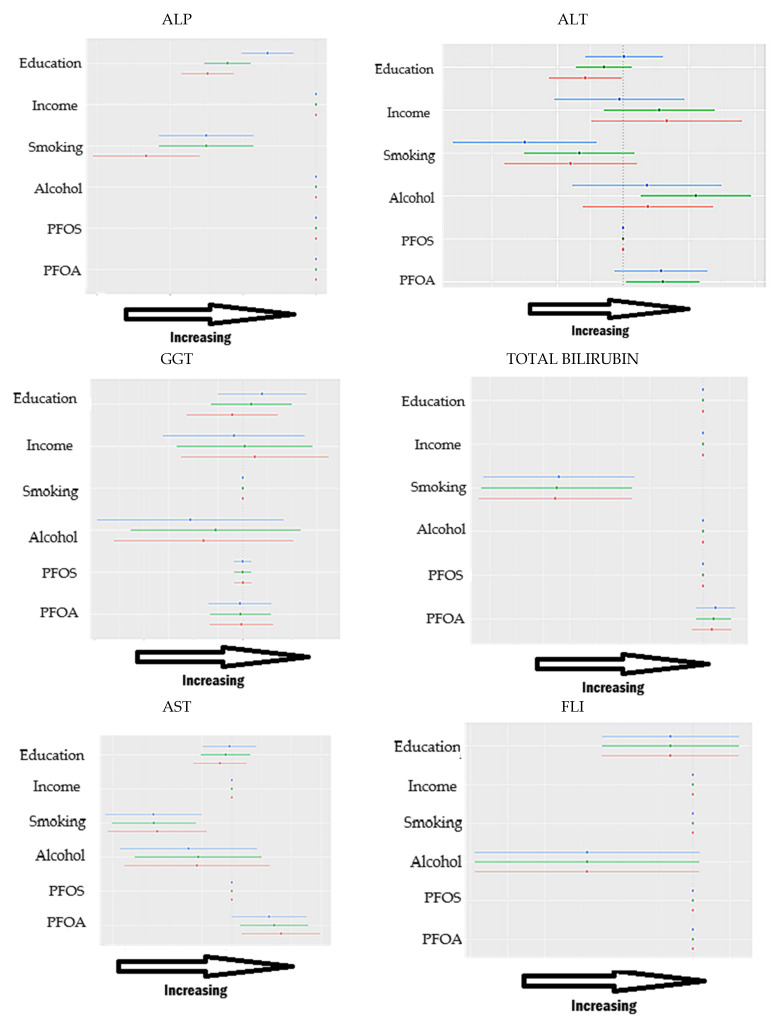
Methods: PFAS concentrations in blood samples were analyzed using online solid-phase extraction combined with liquid chromatography-tandem mass spectrometry (LC-MS/MS), a highly sensitive and specific method for detecting levels of PFAS. Liver function was evaluated using biomarkers such as alanine aminotransferase (ALT), aspartate aminotransferase (AST), alkaline phosphatase (ALP), gamma-glutamyltransferase (GGT), total bilirubin, and the fatty liver index (FLI). Descriptive statistics and multivariable linear regression analyses were employed to assess the associations between exposures and liver outcomes. Bayesian Kernel Machine Regression (BKMR) was utilized to explore the nonlinear and interactive effects of these exposures. To determine the relative influence of each factor on liver health, Posterior Inclusion Probabilities (PIPs) were calculated.
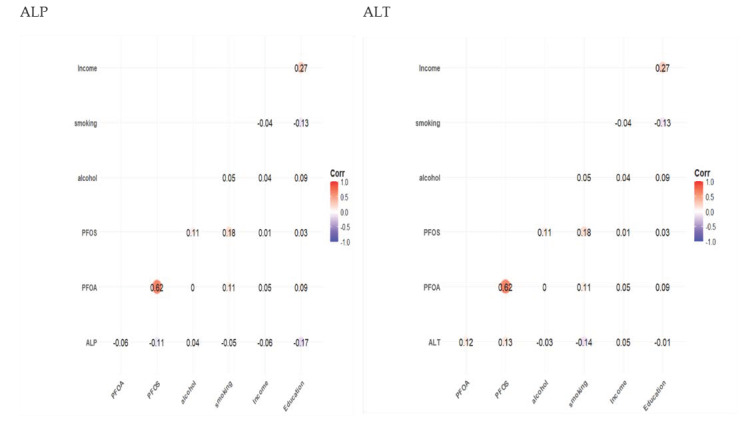
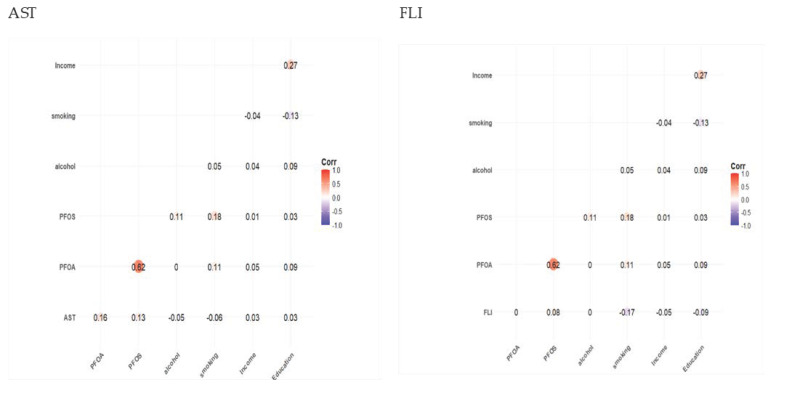
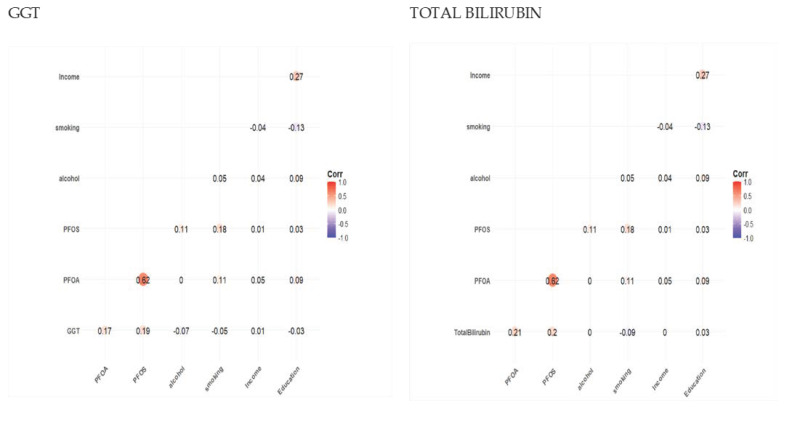
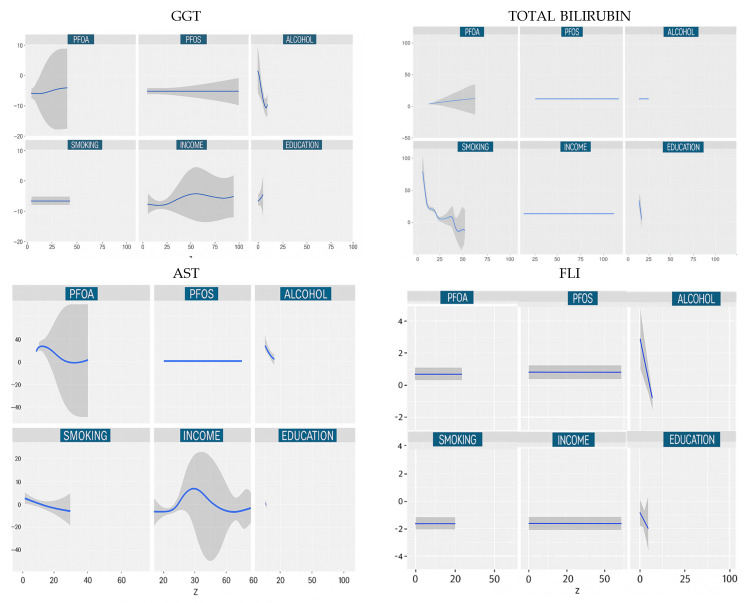
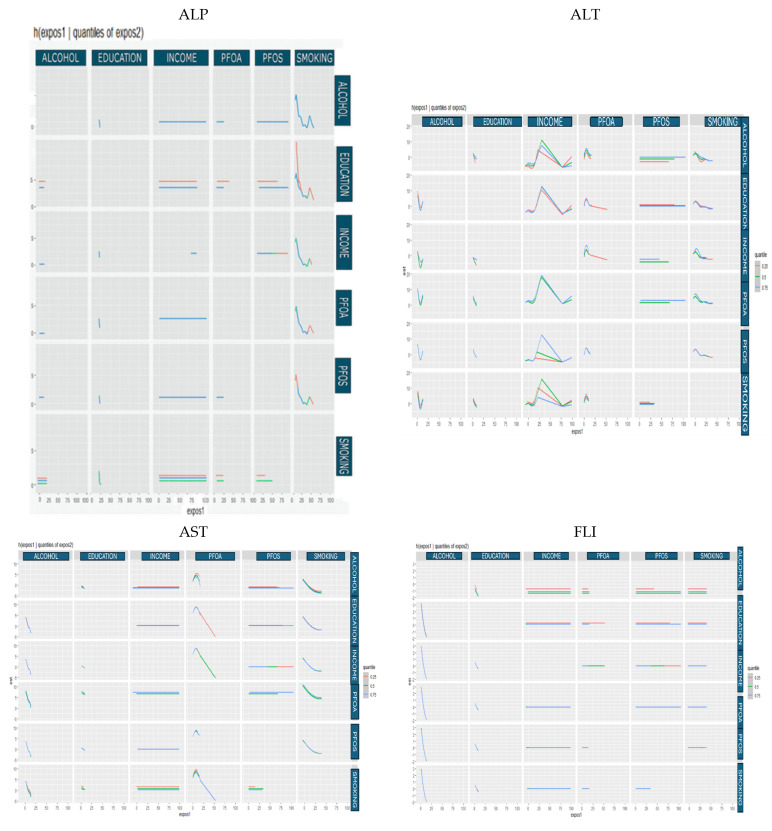
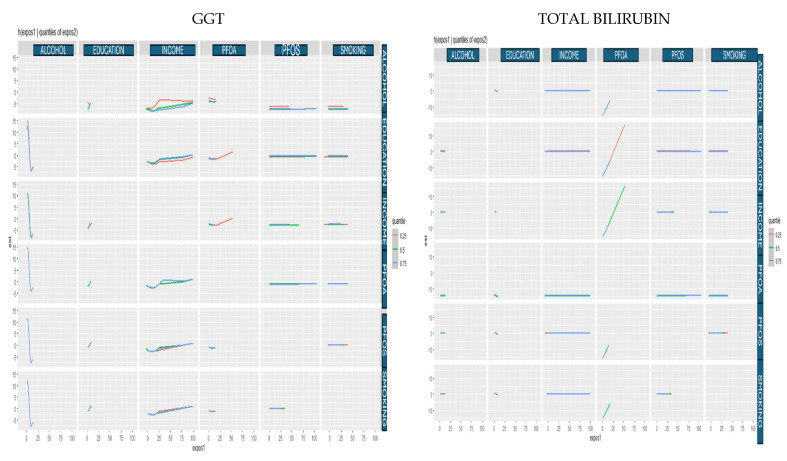
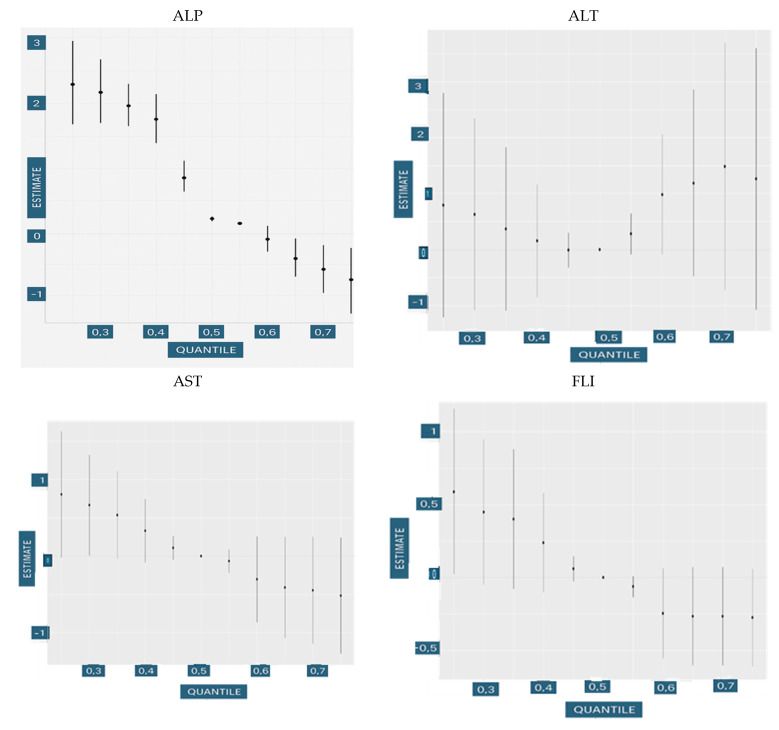
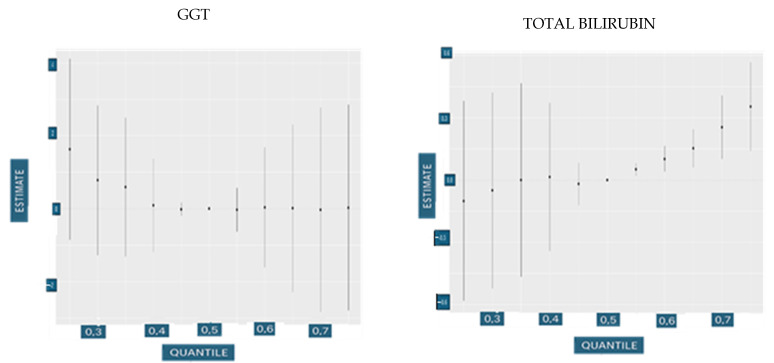
Results: Linear regression analyses indicated that income and education were inversely associated with several liver injury biomarkers, while alcohol use and smoking demonstrated stronger and more consistent associations. Bayesian Kernel Machine Regression (BKMR) further highlighted alcohol and smoking as the most influential predictors, particularly for GGT and total bilirubin, with posterior inclusion probabilities (PIPs) close to 1.0. In contrast, PFAS showed weaker associations. Regression coefficients were small and largely non-significant, and PIPs were comparatively lower across most liver outcomes. Notably, education had a higher PIP for ALT and GGT than PFAS, suggesting a more protective role in liver health. People with higher education levels tend to live healthier lifestyles, have better access to healthcare, and are generally more aware of health risks. These factors can all help reduce the risk of liver problems. Overall mixture effects demonstrated nonlinear trends, including U-shaped relationships for ALT and GGT, and inverse associations for AST, FLI, and ALP.
Conclusion: These findings underscore the importance of considering both environmental and social-behavioral determinants in liver health. While PFAS exposures remain a long-term concern, modifiable lifestyle and structural factors, particularly alcohol, smoking, income, and education, exert more immediate and pronounced effects on hepatic biomarkers in the general population.
Keywords: PFAS; behavior; environmental health; exposome; liver function; socioeconomic status.
Conflict of interest statement
The authors declare no conflicts of interest.
Figures
Similar articles
-
Sex specificity in associations between exposure to a mixture of per and poly-fluoroalkyl substances and anxiety among US adults.J Expo Sci Environ Epidemiol. 2025 Jul;35(4):578-589. doi: 10.1038/s41370-024-00741-3. Epub 2025 Jan 7. J Expo Sci Environ Epidemiol. 2025. PMID: 39775104
-
Prescription of Controlled Substances: Benefits and Risks.2025 Jul 6. In: StatPearls [Internet]. Treasure Island (FL): StatPearls Publishing; 2025 Jan–. 2025 Jul 6. In: StatPearls [Internet]. Treasure Island (FL): StatPearls Publishing; 2025 Jan–. PMID: 30726003 Free Books & Documents.
-
Associations between per- and polyfluoroalkyl substances exposure and renal function as well as poor prognosis in chronic kidney disease patients.Ren Fail. 2025 Dec;47(1):2520903. doi: 10.1080/0886022X.2025.2520903. Epub 2025 Jun 25. Ren Fail. 2025. PMID: 40563132 Free PMC article.
-
Exposure to perfluoroalkyl and polyfluoroalkyl substances and risk of stroke in adults: a meta-analysis.Rev Environ Health. 2023 Sep 4;39(4):791-800. doi: 10.1515/reveh-2023-0021. Print 2024 Dec 17. Rev Environ Health. 2023. PMID: 37656598
-
Exposure to per- and Polyfluoroalkyl Substances and Markers of Liver Injury: A Systematic Review and Meta-Analysis.Environ Health Perspect. 2022 Apr;130(4):46001. doi: 10.1289/EHP10092. Epub 2022 Apr 27. Environ Health Perspect. 2022. PMID: 35475652 Free PMC article.
References
-
- Buck R.C., Franklin J., Berger U., Conder J.M., Cousins I.T., De Voogt P., Jensen A.A., Kannan K., Mabury S.A., van Leeuwen S.P.J. Perfluoroalkyl and polyfluoroalkyl substances in the environment: Terminology, classification, and origins. Integr. Environ. Assess. Manag. 2011;7:513–541. doi: 10.1002/ieam.258. - DOI - PMC - PubMed
-
- National Institute of Health Study Links Synthetic Chemicals to Liver Damage. [(accessed on 15 November 2024)]; Available online: https://www.nih.gov/news-events/nih-research-matters/study-links-synthet....
-
- Li C., Zhou K., Qin W., Tian C., Qi M., Yan X., Han W. A review on heavy metals contamination in soil: Effects, sources, and remediation techniques. Soil Sediment Contam. Int. J. 2019;28:380–394. doi: 10.1080/15320383.2019.1592108. - DOI
MeSH terms
Substances
Grants and funding
LinkOut - more resources
Full Text Sources
Miscellaneous
