. 2025 Sep;241(9):e70095.
doi: 10.1111/apha.70095.

Magnetic Resonance Cartography of Renal Tubule Volume Fraction During Diuretic Intervention

Affiliations

Magnetic Resonance Cartography of Renal Tubule Volume Fraction During Diuretic Intervention

Ehsan Tasbihi et al. Acta Physiol (Oxf). 2025 Sep.

Abstract

Aim: The renal tubular volume fraction (TVF) fluctuates under physiological conditions, and is altered in several renal diseases. Tools that enable noninvasive assessment of TVF are currently lacking. Magnetic Resonance (MR) TVF cartography is a novel approach for unraveling renal (patho-)physiology. Here, we employ MR-TVF cartography to monitor changes in response to the diuretic furosemide, and examine its role for the interpretation of renal oxygenation assessed by mapping the MRI relaxation time T2*. We hypothesize that furosemide increases TVF.

Methods: In anesthetized rats (n = 7) the MRI relaxation times T2, T2*, T2' and kidney size were obtained before/following an i.v. bolus of furosemide using a 9.4 Tesla MRI scanner. Spectral analysis of the T2 signal decay was performed to estimate the number of T2 components in renal tissue. TVF cartographies were calculated using voxel-wise bi-exponential fit of the T2 decay. Near Infrared Spectroscopy (NIRS, n = 9) was used to assess the total hemoglobin concentration (HbT) as a surrogate of renal blood volume.

Results: Furosemide induced changes in renal MRI and NIRS parameters relative to baseline: TVFCORTEX = 31.1%, TVFOUTER_MEDULLA = 30.7%, T2_CORTEX = 13.0% and T2_OUTER_MEDULLA = 20.6%. HbTCORTEX was reduced by 2.7%. HbTMEDULLA declined by 8.6%. Kidney size showed a modest increase of 2.9%. T2*OUTER_MEDULLA and T2´OUTER_MEDULLA rose by 20.5% and 20.2%. T2*CORTEX and T2´CORTEX remained unchanged. T2* and TVF were strongly correlated in the outer medulla and moderately in the cortex.

Conclusion: MR-TVF cartography is highly relevant for elucidating mechanisms of renal (patho-)physiology, including the role of renal oxygenation assessed by MRI mapping of renal T2*.

Keywords: MRI; furosemide; kidney; tubule system; tubule volume fraction.


Conflict of interest statement

The authors declare no conflicts of interest.

Figures

FIGURE 1
FIGURE 1
Spectral analysis of the relaxation time T 2 using a free fit with the nonnegative least squares (NNLS) algorithm. (A) In vivo T 2 map of a rat kidney. For spectral analysis of T 2 relaxation regions of interest (ROI) were defined for the renal cortex, the outer medulla and the inner medulla. (B) Representative example of the T 2 fitting for the regions of interest highlighted in A with NNLS. (C) T 2 spectrum obtained for a rat kidney using the ROIs highlighted in A. For data acquisition a minimum echo time of TE = 6.96 ms (ΔTE = 6.96 ms, number of echoes = 42 TR = 2000 ms) was used.
FIGURE 2
FIGURE 2
Evaluation of absolute TVF values in a phantom study: (A) T 2 map in milliseconds of the phantom scanned with the short TE protocol using multi‐echo spin‐echo (TR = 500 ms, number of echoes = 13, first TE = 6.4 ms, inter‐echo time ΔTE = 6.4 ms, number of averages = 1, α refocusing pulse = 180°, t acquisition = 58 s) with selected region‐of‐interest (ROI1–ROI2). ROI1 has a T 2 distribution similar to the T 2 bandwidth of blood/parenchyma. ROI2 has a T 2 distribution similar to the T 2 bandwidth of tubular fluid. The outer tubes are filled with distilled water used as a reference. (B) Evaluation of the assessment of the absolute volume fraction with decomposition of parametric T 2 using bi exponential fitting of the T 2 decay with fixed T 2_long. The coefficient of determination R 2 of 0.942 indicates a strong agreement for TVF assessments.
FIGURE 3
FIGURE 3
Cartography of the tubular volume fraction TVF and the MR relaxation times T 2 and T 2* obtained in rat kidneys in vivo at baseline, ~4 min after furosemide injection, and ~18 min after furosemide injection ~6 min after the start of the infusion of the electrolyte solution (Ringer's solution). Marked alterations in TVF and T 2 following furosemide injection are visually evident. Postinjection, an increase in TVF was observed in both the renal cortex and outer medulla. Similarly, T 2 values exhibited a notable rise in the renal cortex and outer medulla. Additionally, a marked increase in T 2* was observed in the outer medulla.
FIGURE 4
FIGURE 4
Time courses of relative changes following administration of furosemide. (A) Time course of TVF changes (mean ± SEM, n = 7) for cortex (blue), outer medulla (gray), inner medulla (red) before the intervention (baseline), after the furosemide administration (gray dashed line) and during the infusion of Ringer's solution (blue dashed line), (B) time course of T 2* changes for cortex, outer medulla, inner medulla, (C) time course of T 2 changes for cortex, outer medulla, inner medulla, (D) time course of T 2´ changes for cortex, outer medulla, inner medulla, and (E) time course of kidney size changes before (baseline) and during these interventions. Gray dashed line at time = 0 indicates the start of the furosemide injection. Blue dashed line at time = 12 min indicates the start of the infusion of the electrolyte solution (Ringer's solution). Time points at t = 2 min, 4 min and 6 min are reported as mean ± SEM of n = 6 rats. This is due to the different time point of acquisition in the first two rats, which underwent MR scans using both the long TE range and short TE range protocols.
FIGURE 5
FIGURE 5
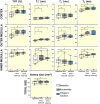
Changes in TVF, T 2*, T 2´, T 2 and kidney size following administration of furosemide. The TVF showed significant changes in response to furosemide in the renal cortex and outer medulla, but not in the inner medulla. Pair‐wise comparisons show significant increases compared to baseline during the furosemide intervention and the Ringer's solution administration in the cortex (p = 0.0075, p = 0.0033, respectively) and outer medulla (p = 0.0325, p = 0.0005). T 2* was significantly increased in the outer medulla during the furosemide intervention and Ringer's solution administration (p = 0.0075, p = 0.0325). T 2* changes were not significantly changed in the renal cortex and inner medulla. T 2´ was significantly increased only in the outer medulla during the furosemide intervention (p = 0.0272). T 2 was significantly increased during the furosemide intervention and Ringer's solution administration in the cortex (p = 0.0162, p = 0.0013) and outer medulla (p = 0.0075, p = 0.0033). In the inner medulla, T 2 was significantly increased only during the Ringer's solution administration (p = 0.0162). Kidney size significantly increased during the intervention and upon Ringer's solution administration (p = 0.0075, p = 0.0033). Nonparametric repeated‐measures Friedman test, with Dunn's post hoc test for pair‐wise comparisons; n = 7;*p < 0.05, †p < 0.01, ‡p < 0.001.
FIGURE 6
FIGURE 6
Repeated‐measures correlation matrix illustrating the association between changes in TVF, kidney size, T 2*, T 2´, T 2 for the renal cortex, the outer medulla and the inner medulla. The color legend and the circle size indicate the strength of the correlation. Numbers inside circles indicate correlation coefficients; n = 7. Nonsignificant correlations are omitted.
FIGURE 7
FIGURE 7
Changes in total hemoglobin concentration (HbT), a surrogate of renal blood volume fraction, obtained from near infrared spectroscopy (NIRS) in the renal cortex (blue) and medulla (red) following furosemide injection (n = 9). (A) Time course of relative HbT values are shown as percentage change relative to baseline. The vertical line indicates the time point of furosemide administration (t = 0 s). Shaded areas represent the standard error of the mean (SEM). (B) Furosemide administration led to a significant decrease from baseline in the cortex and medulla (p < 0.0001), assessed using a paired nonparametric Friedman test.

Similar articles

References

    1. Cao J., Zhu S., Ye M., et al., “Comparison of Renal Artery vs Renal Artery‐Vein Clamping During Partial Nephrectomy: A System Review and Meta‐Analysis,” Journal of Endourology 34, no. 4 (2020): 523–530. - PubMed
    1. Schoenberg S. O., Aumann S., Just A., et al., “Quantification of Renal Perfusion Abnormalities Using an Intravascular Contrast Agent (Part 2): Results in Animals and Humans With Renal Artery Stenosis,” Magnetic Resonance in Medicine 49, no. 2 (2003): 288–298. - PubMed
    1. Kellum J. A. and Prowle J. R., “Paradigms of Acute Kidney Injury in the Intensive Care Setting,” Nature Reviews. Nephrology 14, no. 4 (2018): 217–230. - PubMed
    1. Haase M., Bellomo R., Story D., et al., “Effect of Mean Arterial Pressure, Haemoglobin and Blood Transfusion During Cardiopulmonary Bypass on Post‐Operative Acute Kidney Injury,” Nephrology, Dialysis, Transplantation 27, no. 1 (2012): 153–160. - PubMed
    1. Li L., Fu H., and Liu Y., “The Fibrogenic Niche in Kidney Fibrosis: Components and Mechanisms,” Nature Reviews. Nephrology 18, no. 9 (2022): 545–557. - PubMed

LinkOut - more resources