. 2025 Sep 2;19(34):30902-30918.
doi: 10.1021/acsnano.5c06724. Epub 2025 Aug 22.

Time-Resolved Fluorescence Imaging and Correlative Cryo-Electron Tomography to Study Structural Changes of the HIV-1 Capsid

Affiliations

Time-Resolved Fluorescence Imaging and Correlative Cryo-Electron Tomography to Study Structural Changes of the HIV-1 Capsid

Zaida K Rodriguez et al. ACS Nano. .

Abstract

The conical HIV-1 capsid protects the internal viral genome and facilitates the infection of target cells. Highly potent antivirals, such as the clinically approved drug Lenacapavir (LEN), block HIV-1 replication by changing the capsid structure and modulating its function. However, structural studies of the HIV-1 capsid, its disassembly, or stabilization by antivirals have been challenging. Here, we developed a correlative light and cryo-electron microscopy (CLEM) workflow to characterize HIV-1 capsid morphology, starting from a small volume of viral particles harvested from cellular supernatants. We report two critical improvements in sample preparation, namely, (1) affinity capture and retention of fluorescent HIV-1 particles on cryo-EM grids to enable mapping virus/capsid location prior to sample vitrification and (2) streamlined alignment protocols to subsequently identify and correlate regions of interest in fluorescence and cryo-EM images. These improvements enable a reproducible CLEM workflow to accurately locate capsids for cryo-electron tomography (cryo-ET) studies. Using this approach, we resolved ultrastructures of HIV-1 capsids treated with LEN and the cellular metabolite inositol hexaphosphate (IP6), revealing distinct modes of capsid lattice stabilization. Finally, using our CLEM workflow, we demonstrate the feasibility of correlating time-resolved fluorescence imaging of capsid disassembly to end point cryo-ET structures. These advances will facilitate in vitro structural studies to define the mechanisms of HIV-1 capsid stabilization and disassembly. The CLEM workflow developed here can also be extended to studying structural changes in other viruses in response to diverse stimuli.

Keywords: CLEM; HIV-1 capsid uncoating; IP6; cryo-ET; lenacapavir.


Figures

1
1
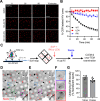
An in vitro assay to study HIV-1 uncoating by CLEM. (A) Schematics show fluorescent HIV-1 particles immobilized on cryo-EM grids using the 2G12 antibody-mediated affinity capture (see the main text and the section Materials and Methods). fHIV-1 is labeled with INsfGFP (green), which marks the vRNPs internal to the conical capsid shell (blue), and with the CDR (red) marker, which decorates the outer capsid surface. Following saponin (SAP) treatment, the viral membrane is permeabilized, and uncoating is initiated. Progression of uncoating is visualized by time-resolved imaging of CDR-loss. The goal of this study is to develop a CLEM workflow to correlate the loss of CDR visualized by time-resolved fLM to capsid structures by cryo-ET. (B) Representative initial and end-point images of a time-resolved imaging data set showing INsfGFP (green) and CDR (red) labeled cores captured on grids. Dashed circles identify cores that were tracked, and colored arrowheads identify presumably intact (pink) and fully uncoated (cyan) cores. Scale bar = 2 μm. (C) CDR fluorescence intensity traces showing HIV-1 cores uncoating to different extents corresponding to T1 and T2 cores in (B) over 31 min of imaging. See also Movie 22 related to (B) and (C).
2
2
CLEM workflow for time-resolved studies. Overview of (A) sample preparation and (B) schematics of CLEM workflow steps 1–8 (see also Figure S1B and the section Materials and Methods). Golden arrows mark the small number of grid-handling steps that minimize grid damage, and the number of blotting steps in affinity capture is shown. The estimated time for completion of each step is annotated in magenta. (C) A zoomed-in image of an affinity-captured grid showing an even distribution of fHIV-1 puncta labeled with CDR (red) and INsfGFP (green). (D) An example of overlaid fLM, cryo-TEM, CLEM, and structural data (inset, steps 6–8) from a representative experiment. Scale bar in (C) 20 μm and insets shown in (D) 50 nm. The sample preparation (gray), fLM (blue), and cryo-TEM (red) steps are color-coded for clarity. Note: CDR and 200 nm beads are imaged using the same wavelength (ex/em 561/580), and 200 nm beads are not included in the example image shown in (C), which shows an even distribution of affinity-captured fHIV-1.
3
3
Incorporation of 4 μm fiducial beads improves the overall efficiency of the CLEM workflow. (A) fLM and (B) cryo-TEM overview montage maps of affinity-captured grids decorated with large 4 μm and small 200 nm fiducial beads (red). Colored circles identify broken squares, and colored arrows point to 4 μm fiducial beads used in the CLEM-1 alignment of the grid maps. For clarity, the cryo-TEM atlas in (B) is rotated to overlay the square numbers (#1–7) where high-resolution confocal data sets were collected. (C) Zoomed-in panels of (A and B)high-resolution fLM image (left panels) and cryo-TEM MMM-map (right panels) of the central grid square #1 shown in A and B, show the distribution of fiducial beads (red in (A) and electron-dense dark puncta in (B)). The inset in right zoomed panels shows the CLEM-2 alignment of the grid square, with overlaid INsfGFP (green) and 200 nm bead (red) signals. (D) The ability to identify the grid center and orient the fLM- and LMM-TEM maps (CLEM-1 efficiency) was evaluated from different experiments containing either perfect grids (no break) or grids with broken squares, with (+) or without (−) 4 μm beads. The number of experiments (n) used in the analysis is indicated.
4
4
Affinity -captured fHIV-1 particles and 200 nm fiducial beads remain immobilized on cryo-EM grids. (A) Representative image showing CLEM-2 alignment of 200 nm fiducial beads (red) and the identification of fHIV-1 particles (green) on a lacey carbon film. A zoomed-in image from (A) with and without the fluorescence signal from overlaid fHIV-1 particles is shown in the right panels (top) and (bottom), respectively. Dashed circles highlight the location of fHIV-1 particles. (B) Zoomed-in view of boxed areas (A, right panels) showing circular structures representing virus particles. The fraction (>90%) of electron-dense structures of fHIV-1 particles and beads detected by fLM that was retained within the 200 nm radius dashed circles in (A) and (B) was determined from multiple experiments, shown in (A) (see also Figure F). (C) Examples of orthoslices from reconstructed structures by cryo-ET. (D) Quantification of the fraction of mature and immature viral particles, including vesicles in the cryo-ET data sets (n = 86), identified by the CLEM workflow and by cryo-ET data sets collected at the location of circular EM densities shown in (B). Tracing of substructures overlaid on TEM images (middle panel) and without overlay (bottom panel) is shown for clarity in (C). The scale bar in (A) is 2 μm, in zoomed-in images (right panels) is 500 nm, in (B) is 200 nm overlaid, and in (C) is 50 nm.
5
5
HIV-1 cores remain adhered to grids following virus membrane permeabilization. (A) Time-resolved imaging and (B) quantification of CDR puncta (red) loss from membrane-permeabilized virions (+SAP), treated with control DMSO, IP6 (100 μM), or LEN (500 nM). Data show the loss of the CDR marker in the presence of DMSO (control) and CDR retention during capsid stabilization by IP6 and LEN treatment. (C) Schematic of the CLEM workflow used to detect capsid structures. (D) A representative image showing CLEM-2 alignment of fLM and TEM MMM maps, showing 200 nm fiducial beads (red,; note the density of beads within overlaid images) and identification of fHIV-1 particles (green) on Quantifoil gold R2/1 grids. (E) Same as in (D) without the fHIV-1 overlay, and (F) a zoomed-in view of boxed regions in (E) to better visualize the densities (arrows; also see Figure S5Afor high-resolution images) underlying the location of the fHIV-1 signal (white circles) and within the 200 nm radius region marked by black dashed circles. (G) Quantification of electron densities of virus (shown in Figures A and S4A) and cores after (+SAP) virus membrane permeabilization that were identified within 200 nm of fluorescence signals of fHIV-1 particles by CLEM-2 image alignment (see also Figure S5B for precision of EM density localization with respect to fLM signals). Error bars indicate the mean and SEM from n = 7 (virions) and n = 10 experiments (cores, + SAP). The respective structures of virions from cryo-ET reconstructions are shown in Figures C and S4C and cores in Figure .
6
6
Ultrastructures of IP6 and LEN stabilized capsids. Examples of reconstructed cryo-ET tomograms depicting capsid morphology during treatment with (A) IP6 or (B) LEN identified by CLEM (Figure ; additional tomographic snapshots for LEN-treated cores are shown in Figure S6B). The morphology of putative capsid structures (red), internal densities of vRNPs (green), and external permeabilized membrane densities (dashed gray lines) are highlighted by tracing on the 2D images. Densities of vRNPs in compromised structures could not be distinguished from those of debris and thus were not traced. The overlaid (middle panels) and traces alone (lower panels) are shown for clarity. Structures with full conical morphology were considered intact, whereas all other structures, including those that had partial conical features (visible broad or narrow ends), were considered compromised, as indicated in (A, B). Scale bars are 50 nm in A and B. Quantification of the fraction of intact and compromised cores (as shown in panels A and B) during (C) IP6 and (D) LEN treatment. The total number of tomograms analyzed is overlaid on each figure panel.
7
7
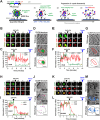
Proof-of-concept time-resolved CLEM studies correlate capsid uncoating dynamics to end point cryo-ET structures. (A) Schematics of fluorescent virus labeling with iGFP and CDR used in time-resolved CLEM experiments. The cartoon shows the affinity capture of fluorescent HIV-1 particles labeled with an iGFP fluid-phase marker. Three scenarios are depicted, including (1) the primary loss of iGFP that occurs during virus membrane permeabilization with SAP, followed by (2) a loss of capsid-entrapped iGFP molecules during the initial steps of capsid opening, and (3) subsequent loss of the CDR label that reports the disassembly of the remainder of the capsid structure. (B, E, H, and K) Experimental time-stamped images of fHIV-1 cores on grids showing iGFP and CDR fluorescence before and after SAP and IP6 addition at 2.5 min. (C, F, I, and L) Corresponding fluorescence intensity traces and (D, G, J, and M) orthoslices through reconstructed tomograms by cryo-ET showing the correlated capsid morphology. Data show a core that retained the capsid-entrapped iGFP signal and CDR fluorescence (B, C) appears intact with conical morphology (D), a core that lost the majority of its capsid-entrapped iGFP at 9 min but retained most of the CDR signals (E-–G) appears as a tubular structure, and cores that completely lost iGFP and CDR signals (H-–J and K-–M) before plunge-freezing appear amorphous in structure. The time of SAP + IP6 addition (black arrow), the retention and/or complete iGFP loss (yellow arrow), and plunge-freezing (blue arrow) are overlaid on figure panels for clarity. Scale bars in D, G, J, and M are 50 nm. The location of individual cores and trajectories on the CLEM-2 map (Figure S7) is overlaid on fluorescence traces in C, F, I, and L for clarity. See also related Figure S8 and Movies 1721.

Similar articles

References

    1. Ganser-Pornillos B. K., Yeager M., Pornillos O.. Assembly and architecture of HIV. Adv. Exp. Med. Biol. 2012;726:441–465. doi: 10.1007/978-1-4614-0980-9_20. - DOI - PMC - PubMed
    1. de Marco A., Muller B., Glass B., Riches J. D., Krausslich H. G., Briggs J. A.. Structural analysis of HIV-1 maturation using cryo-electron tomography. PLoS Pathog. 2010;6(11):e1001215. doi: 10.1371/journal.ppat.1001215. - DOI - PMC - PubMed
    1. Briggs J. A., Wilk T., Welker R., Krausslich H. G., Fuller S. D.. Structural organization of authentic, mature HIV-1 virions and cores. EMBO J. 2003;22(7):1707–1715. doi: 10.1093/emboj/cdg143. - DOI - PMC - PubMed
    1. Mattei S., Glass B., Hagen W. J., Krausslich H. G., Briggs J. A.. The structure and flexibility of conical HIV-1 capsids determined within intact virions. Science. 2016;354(6318):1434–1437. doi: 10.1126/science.aah4972. - DOI - PubMed
    1. Briggs J. A., Krausslich H. G.. The molecular architecture of HIV. J. Mol. Biol. 2011;410(4):491–500. doi: 10.1016/j.jmb.2011.04.021. - DOI - PubMed

LinkOut - more resources