. 2025 Sep;241(9):e70085.
doi: 10.1111/apha.70085.

NMDA-Type Glutamate Receptor Activation Promotes Ischemic Arrhythmias by Targeting the AKT1-TBX3-Nav1.5 Axis

Affiliations

NMDA-Type Glutamate Receptor Activation Promotes Ischemic Arrhythmias by Targeting the AKT1-TBX3-Nav1.5 Axis

Yuxian He et al. Acta Physiol (Oxf). 2025 Sep.

Abstract

Aim: The aim of this study is to determine the possible role of N-methyl-D-aspartate receptor (NMDAR) dysregulation in the ischemic electrical remodeling observed in patients with myocardial infarction (MI) and elucidate the underlying mechanisms.

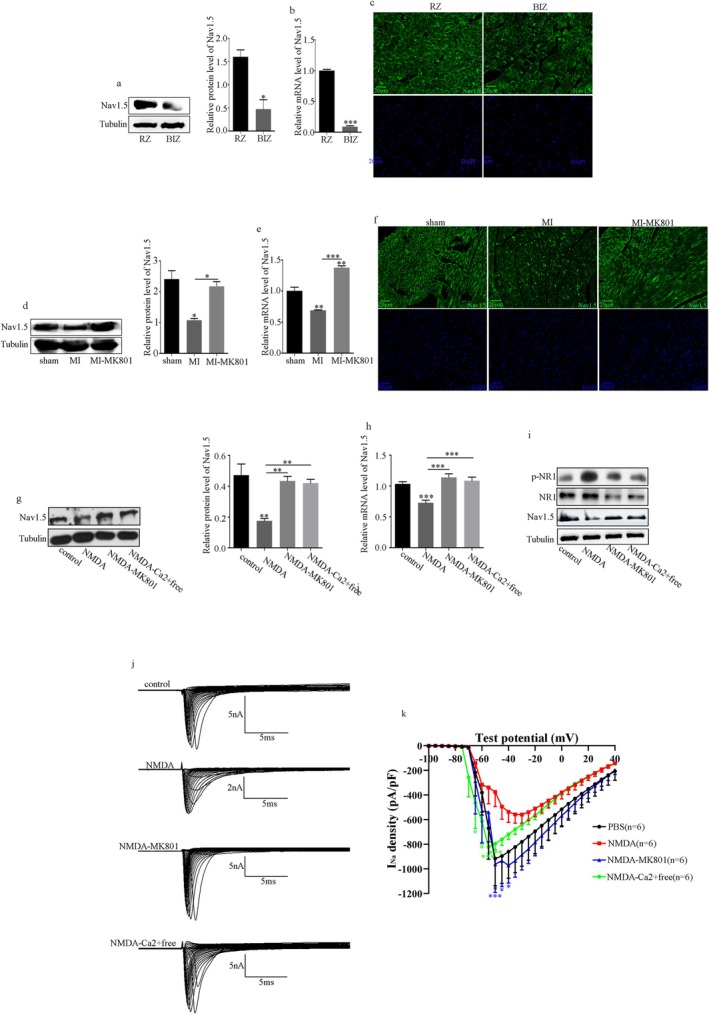
Methods: Human heart tissue was obtained from the border of the infarct and remote zones of patients with ischemic heart disease, and mouse heart tissue was obtained from the peri-infarct zone. NMDAR expression was detected using immunofluorescence (IF) and Western blotting (WB). Spontaneous ventricular arrhythmias (VAs) in mice were detected using electrocardiogram backpacks. Electrical remodeling post-MI was detected using patch clamp recordings, quantitative real-time polymerase chain reactions, IF, and WB. Mechanistic studies were performed using bioinformatic analysis, plasmid and small interfering RNA transfection, lentiviral packaging, and site-directed mutagenesis.

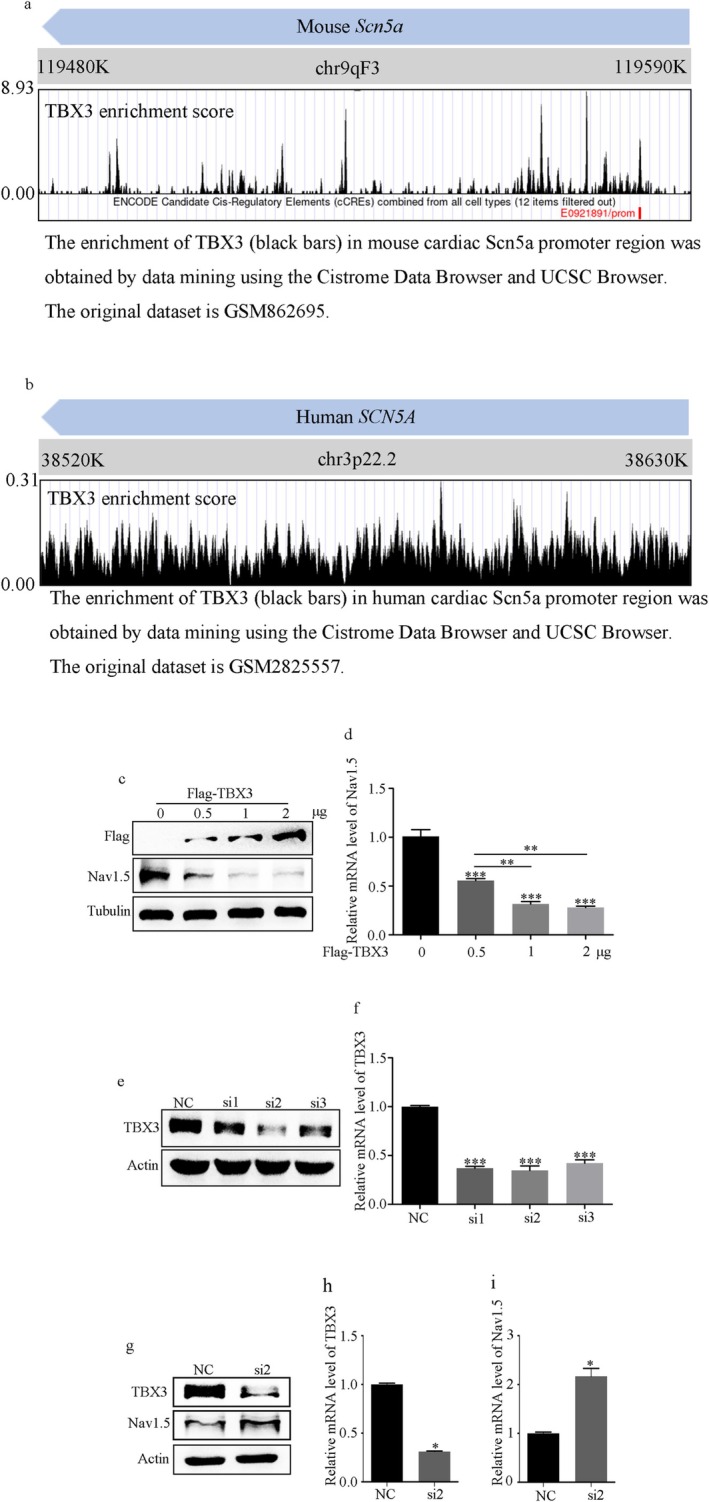
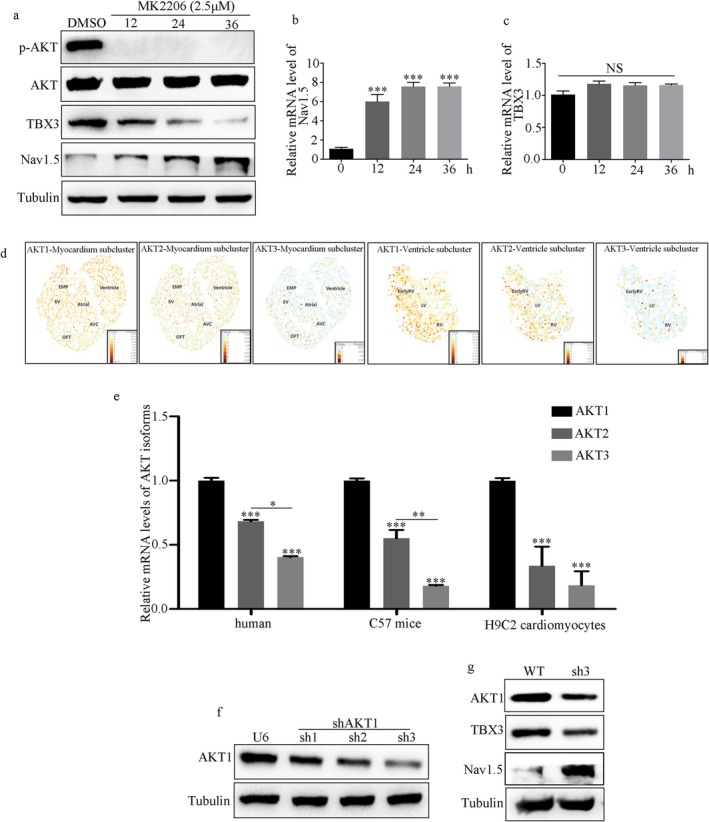
Results: NMDAR is highly expressed in patients with ischemic heart disease and mice with MI. NMDAR inhibition reduces the occurrence of VAs. Mechanistically, NMDAR activation promotes electrophysiological remodeling, as characterized by decreased Nav1.5, Kv11.1, Kv4.2, Kv7.1, Kir2.1, and Cav1.2 expression in patients with ischemic heart disease and mice with MI and rescues these ion channels dysregulation in mice with MI to varying degrees by NMDAR inhibition. Decreased Nav1.5 expression and inward sodium current density were attenuated by NMDAR inhibition in primary rat cardiomyocytes. Moreover, NMDAR activation upregulates T-Box Transcription Factor 3 (TBX3) post-translationally, further downregulating Nav1.5 transcriptionally. Furthermore, AKT1 is the predominant isoform in the ventricular myocardium upstream of TBX3 and mediates NMDAR-induced TBX3 upregulation in cardiomyocytes.

Conclusion: NMDAR activation contributes to MI-induced VAs by regulating the AKT1-TBX3-Nav1.5 axis, providing novel therapeutic strategies for treating ischemic arrhythmias.

Keywords: NMDAR; electrophysiological remodeling; myocardial infarction; pseudo‐phosphorylation; ventricular arrhythmias.


Conflict of interest statement

The authors declare no conflicts of interest.

Figures

FIGURE 1
FIGURE 1
The expression and activation of NMDAR in patients with ischemic heart disease and MI mice. (a) Protein levels of NR1 and phosphorylated‐NR1 in patients with ischemic heart disease evaluated using Western blot. (b) Quantitative analysis of (a). (c) Protein levels of NR1 and phosphorylated‐NR1 in MI mice evaluated using Western blot. (d) Quantitative analysis of (c). (e) Levels of NR1 and phosphorylated‐NR1 in patients with ischemic heart disease measured using IF. (f) Levels of NR1 and phosphorylated‐NR1 in MI mice measured using IF. BIZ, The border of the infarct zone; IF, Immunofluorescence; MI, Myocardial infarction; NR1, N‐methyl‐D‐aspartate receptor 1; RZ, The remote zone. Data from three independent repetitions of experiments are expressed as means ± standard deviations (SDs). Two‐tailed Student's t test was performed for comparison between two groups, and one‐way ANOVA followed by a post hoc Tukey's test was used to compare the data from multiple groups. A value of p < 0.05 was considered statistically significant.
FIGURE 2
FIGURE 2
NMDAR inhibition reduces the incidence of VAs after MI. (a) Schematic illustration of the procedure for in vivo study. (b, c) The number of ventricular arrhythmias (VT or VF) and representative traces recorded by ECG backpacks in mice of the sham, MI, and MI‐MK801 groups. (d) Representative ECG of VAs before death in 1 mouse in the MI group. (e) Representative M‐mode echocardiography images of the sham, MI, and MI‐MK801 groups. (f, g) Summary of LV ejection fraction and fractional shortening of mice from the sham, MI, and MI‐MK801 groups. (h) Correct LV mass of mice from the sham, MI, and MI‐MK801 groups. (i, j) Masson‐trichrome staining of the heart sections from each group. ECG, Electrocardiogram; ip, Intraperitoneal injection; LV, Left ventricular; VF, Ventricular fibrillation; VT, Ventricular tachycardia. Small sample size categorical data were expressed as percentages and analyzed using Fisher's exact test. Data from three independent repetitions of experiments are expressed as means ± standard deviations (SDs). One‐way ANOVA followed by a post hoc Tukey's test was used to compare the data from multiple groups. (*p < 0.05, **p < 0.01, ***p < 0.001).
FIGURE 3
FIGURE 3
NMDAR inhibition improves Nav1.5 dysregulation in ventricular cardiomyocytes. (a) Protein levels of Nav1.5 and quantitative analysis in patients with ischemic heart disease evaluated using Western blot. (b) Levels of Nav1.5 in patients with ischemic heart disease evaluated using RT‐PCR. (c) Levels of Nav1.5 in patients with ischemic heart disease evaluated using IF. (d) Protein levels of Nav1.5 and quantitative analysis in MI mice evaluated using Western blot. (e) Levels of Nav1.5 in MI mice evaluated using RT‐PCR. (f) Levels of Nav1.5 in MI mice evaluated using IF. (g) Protein levels of Nav1.5 and quantitative analysis in H9C2 cells evaluated using Western blot. (h) Levels of Nav1.5 in H9C2 cells evaluated using RT‐PCR. (i) Protein levels of Nav1.5, NR1, and p‐NR1 and quantitative analysis in primary rat cardiomyocytes. (j–k) The INa density in primary rat cardiomyocytes. Data from three independent repetitions of experiments are expressed as means ± standard deviations (SDs). Two‐tailed Student's t test was performed for comparison between two groups, and one‐way ANOVA followed by a post hoc Tukey's test was used to compare the data from multiple groups. (*p < 0.05, **p < 0.01, ***p < 0.001).
FIGURE 4
FIGURE 4
TBX3 was a negative controller of Scn5a transcription. (a, b) The enrichment of TBX3 in the mouse and human cardiac SCN5A promoter region was obtained by data mining using the Cistrome and UCSC databases. The original dataset is GSM862695 and GSM2825557. (c, d) Nav1.5 protein and mRNA levels overexpressed with different amounts of pCMV‐Flag‐TBX3 in H9C2 cells. (e, f) Screening of the best small interfering RNAs for TBX3 (si‐TBX3) using Western blot and RT‐PCR. (g–i) TBX3 knockdown caused an increase in both the mRNA and protein levels of Nav1.5. Data from three independent repetitions of experiments are expressed as means ± standard deviations (SDs). Two‐tailed Student's t test was performed for comparison between two groups, and one‐way ANOVA followed by a post hoc Tukey's test was used to compare the data from multiple groups. (*p < 0.05, **p < 0.01, ***p < 0.001).
FIGURE 5
FIGURE 5
AKT1 is the predominant AKT isoform in myocardium and post‐translationally upregulates TBX3. (a) Protein levels of TBX3 and Nav1.5 in H9C2 cells treated with MK2206 at different time points. (b, c) mRNA levels of Nav1.5 and TBX3 in H9C2 cells treated with MK2206 at different time points. (d) Bioinformatics analysis based on the reported single‐cell transcriptome data. The original dataset is GSE126128. (e) qRT‐PCR analyses using primers specific to AKT1, AKT2, and AKT3 of human, mice, and H9C2 cells. (f) Screening of the best small hairpin RNAs for AKT1 (sh‐AKT1) using Western blot. (g) AKT1 knockdown caused a decrease in TBX3 protein level and an increase in Nav1.5 protein level. Data from three independent repetitions of experiments are expressed as means ± standard deviations (SDs). Two‐tailed Student's t test was performed for comparison between two groups, and one‐way ANOVA followed by a post hoc Tukey's test was used to compare the data from multiple groups. (*p < 0.05, **p < 0.01, ***p < 0.001).
FIGURE 6
FIGURE 6
AKT1 promotes TBX3 protein stability and enhances its ability to repress Nav1.5 by pseudo‐phosphorylation of TBX3 at serine 720. (a) MG132, an inhibitor of the proteasome, rescued TBX3 protein levels in AKT1‐silenced H9C2 cells. (b, c) The decay rates of TBX3 protein level in both H9C2 cells and AKT1‐silenced H9C2 cells were evaluated using Western blot. (d, e) AKT1 phosphorylation of TBX3 at serine 720 enhanced the ability to inhibit Nav1.5 in H9C2 cells, identified using Western blot and RT‐PCR. Data from three independent repetitions of experiments are expressed as means ± standard deviations (SDs). One‐way ANOVA followed by a post hoc Tukey's test was used to compare the data from multiple groups. (**p < 0.01, ***p < 0.001).
FIGURE 7
FIGURE 7
NMDAR activation promotes post‐MI arrhythmias through the AKT1–TBX3–Nav1.5 axis. (a) Protein levels of p‐AKT1 and quantitative analysis in patients with ischemic heart disease evaluated using Western blot. (b) Protein levels of p‐AKT1 and quantitative analysis in MI mice evaluated using Western blot. (c) Protein levels of p‐AKT1 and quantitative analysis in H9C2 cells evaluated using Western blot. (d) NMDAR activation failed to increase TBX3 expression and decrease Nav1.5 levels when inhibiting AKT1 phosphorylation. (e) NMDAR activation failed to promote the expression of TBX3 and decrease Nav1.5 levels in AKT1‐silenced H9C2 cells. Data from three independent repetitions of experiments are expressed as means ± standard deviations (SDs). Two‐tailed Student's t test was performed for comparison between two groups, and one‐way ANOVA followed by a post hoc Tukey's test was used to compare the data from multiple groups. *p < 0.05, **p < 0.01.

References

    1. Myerburg R. J. and Junttila M. J., “Sudden Cardiac Death Caused by Coronary Heart Disease,” Circulation 125, no. 8 (2012): 1043–1052. - PubMed
    1. Rouleau J. L., Talajic M., Sussex B., et al., “Myocardial Infarction Patients in the 1990s—Their Risk Factors, Stratification and Survival in Canada: The Canadian Assessment of Myocardial Infarction (CAMI) Study,” Journal of the American College of Cardiology 27, no. 5 (1996): 1119–1127. - PubMed
    1. Pezawas T., Diedrich A., Robertson D., et al., “Risk of Arrhythmic Death in Ischemic Heart Disease: A Prospective, Controlled, Observer‐Blind Risk Stratification Over 10 Years,” European Journal of Clinical Investigation 47, no. 3 (2017): 231–240. - PMC - PubMed
    1. Wasson S., Reddy H. K., and Dohrmann M. L., “Current Perspectives of Electrical Remodeling and Its Therapeutic Implications,” Journal of Cardiovascular Pharmacology and Therapeutics 9, no. 2 (2004): 129–144. - PubMed
    1. Nguyen T. P., Qu Z., and Weiss J. N., “Cardiac Fibrosis and Arrhythmogenesis: The Road to Repair Is Paved With Perils,” Journal of Molecular and Cellular Cardiology 70 (2014): 83–91. - PMC - PubMed

Substances