Comparative Study
. 2025 Aug 22;20(8):e0328001.
doi: 10.1371/journal.pone.0328001. eCollection 2025.

Ischemic duration determines extent of cardiac remodeling, and both early and delayed reperfusion prevent fatal cardiac rupture: Model comparison

Affiliations
Comparative Study

Ischemic duration determines extent of cardiac remodeling, and both early and delayed reperfusion prevent fatal cardiac rupture: Model comparison

Ling Zhao et al. PLoS One. .

Abstract

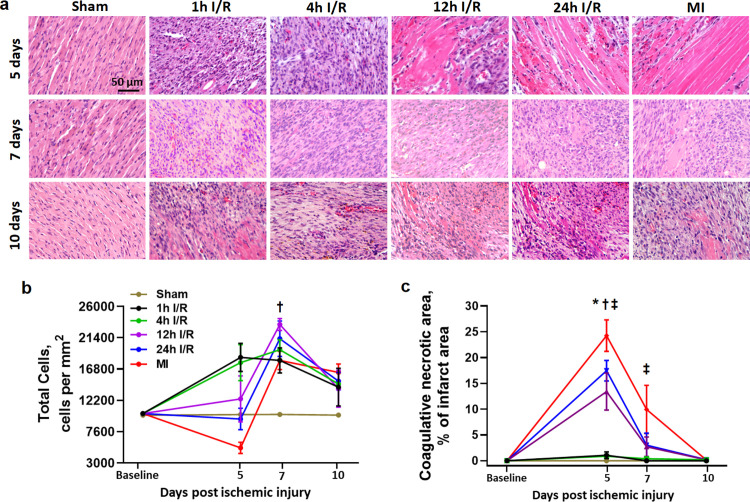
High incidence of cardiac rupture in murine myocardial infarction (MI) model leads to a substantial loss before the study end-point. Selecting animal models with varying degrees of injury for different research purposes is crucial for cardiovascular research. Male C57 mice were subjected to ischemia/reperfusion (I/R) or permanent occlusion (MI) injury. The incidence of cardiac rupture, degree of myocardial injury, inflammatory responses, left ventricular (LV) remodeling and infarct myocardium healing were examined. Compared to MI mice, early reperfusion (1, 2 and 4h I/R) completely prevented cardiac rupture, while delayed reperfusion (12h and 24h I/R) significantly reduced incidence of cardiac rupture to 5.7% and 8.6%, respectively. In the acute phase, prolonged ischemia increased infarct size, myocyte apoptosis, and both systemic and regional inflammatory responses. These changes correspond to enhanced MMP-9 activity and a weakening of the tensile strength of the infarcted myocardium. Following ischemic insult, early reperfusion was associated with less extent of myocardial injury, inflammatory response and adverse cardiac remodeling, whereas, delayed reperfusion and MI groups exhibited severe myocardial damage and remodeling. Furthermore, both early and delayed reperfusion were associated with increased infiltration of type 2 macrophages and proliferation of endothelial cells during the early healing phase, thereby facilitating healing of the infarct myocardium. Delayed reperfusion resulted in a comparable and substantial degree of cardiac remodeling but with a lower risk of cardiac rupture in comparison with MI model. This feature makes it a feasible model for cardiac ischemia research.


Conflict of interest statement

The authors have declared that no competing interests exist.

Figures

Fig 1
Fig 1. Incidence of cardiac rupture, infarct size and myocyte apoptosis in early and delayed reperfusion and MI groups.
(a) Cumulative incidence of cardiac rupture in different groups within 7 days after surgery. (b) Time distribution of cardiac rupture occurrence. (c) Representative images of cardiac rupture. (d) Quantitative data to show percentages of the area at risk (AAR) to total LV area in sham, I/R and MI groups at day 3 after surgery, n = 6–9 per group. (e) Quantitative data to show percentages of infarct size to AAR in sham, I/R and MI groups at day 3 after surgery, n = 6–9 per group, *P < 0.05 vs. 1h I/R. †P < 0.05 vs. 2h I/R. (f) Representative LV section stained by Evans blue and TTC to depict the size of infarcted myocardium. The area where the myocardium turned pale is the infarct area (yellow line). Red and pale color areas indicate AAR and the nonischemic myocardium is blue. (g) Representative images of TUNEL staining at day 3 after surgery. Overlapping (pink color) of blue-stained DAPI and TUNEL-positive nuclei (red color) indicate apoptotic cells. The inset shows the enlarged image of typical TUNEL-positive stained nuclei. Scale bar = 50 μm. (h) Quantitative data to show percentages of TUNEL-positive stained nuclei among the total number of nuclei cells, n = 5 per group, *P < 0.05 vs. sham. †P < 0.05 vs. 1h I/R. ‡ P < 0.05 vs. 4h I/R.
Fig 2
Fig 2. Hematological profile, plasma levels of inflammatory cytokines, Ly-6Chigh monocyte populations from peripheral blood in different groups at 72 h after surgery.
(a) Counts of white blood cells (WBC) in peripheral blood. n = 5-7 per group. (b) Counts of monocytes in peripheral blood. n = 5-7 per group. (c) Counts of neutrophils in peripheral blood. n = 5-7 per group. (d) Counts of lymphocytes in peripheral blood. n = 5-7 per group. (e) Plasma levels of IL-1β. n = 5-8 per group. (f) Plasma levels of MMP-9. n = 5-8 per group. (g) Representative scatter plots of Ly-6Chigh monocytes from peripheral blood. (h) Quantification of Ly-6Chigh monocytes from peripheral blood. n = 7-13 per group. *P < 0.05 vs. sham. †P < 0.05 vs. 1h I/R. ‡ P < 0.05 vs. 4h I/R.
Fig 3
Fig 3. Gene expression of inflammatory cytokines and regional leukocyte infiltration in different groups at 72 h after surgery.
(a) mRNA levels of interleukin-6 (Il6) in the infarct tissue. n = 5-6 per group. (b) mRNA levels of Il1β in the infarct tissue. n = 5-6 per group. (c) mRNA levels of monocyte chemoattractant protein-1 (Mcp1) in the infarct tissue. n = 5-6 per group. (d) mRNA levels of macrophage migration inhibitory factor (Mif) in the infarct tissue. n = 5-6 per group. (e) mRNA levels of matrix metalloproteinase-9 (Mmp9) in the infarct tissue. n = 5-6 per group. (f) mRNA levels of Il10 in the infarct tissue. n = 5-6 per group. Data are expressed as fold change compared with sham group. (g) Representative images of CD45 positive stained cells in the infarct region. The pink colour indicates overlap of CD45 staining (red) with DAPI (blue) staining for nuclei. The inset shows the enlarged image of CD45 positive stained cells. Scale bar = 50 μm. (h) Quantification of leukocytes (CD45 positive cells) number. Data were expressed as the number of CD45 positive cells per mm2. n = 4 per group. *P < 0.05 vs. sham. †P < 0.05 vs. 1h I/R. ‡ P < 0.05 vs. 4h I/R.
Fig 4
Fig 4. The tensile strength of myocardium and matrix metalloproteinase (MMP-9 and −2) activity in different groups at 72 h after surgery.
(a) Changes of tensile strength of myocardium. n = 13 for sham group, n = 25-43 per ischemic group. (b) Representative images of gelatine zymography demonstrating changes of active and latent MMP-9 and MMP-2. (c) Quantitative analyses of active MMP-9 by zymography in the infarct tissue. n = 3-4 per group. (d) Quantitative analyses of latent MMP-9 by zymography in the infarct tissue. n = 3-4 per group. Data are expressed as fold change compared with sham group. *P < 0.05 vs. sham. †P < 0.05 vs. 1h I/R. ‡ P < 0.05 vs. 4h I/R.
Fig 5
Fig 5. Echocardiographic analysis for influence of different ischemic protocols in cardiac remodeling and dysfunction.
(a) Representative B-mode views of long-axis at the left ventricular end-diastole (LVED) from different groups at 4 weeks after surgery. (b) Representative M-mode views of short-axis at the LVED from different groups at 4 weeks after surgery. Horizontal scale bar = 100 ms and vertical scale bar = 2 mm. (c) Changes in LV end-diastolic diameter (LVEDD) at baseline, 1 and 4 weeks after surgery. (d) Changes in LV end-systolic diameter (LVESD) at baseline, 1 and 4 weeks after surgery. (e) Changes in LV end-diastolic volume (LVEDV) at baseline, 1 and 4 weeks after surgery. (f) Changes in LV end-systolic volume (LVESV) at baseline, 1 and 4 weeks after surgery. (g) Changes in fractional shortening (FS) at baseline, 1 and 4 weeks after surgery. (h) Changes in ejection fraction (EF) at baseline, 1 and 4 weeks after surgery. (i) Changes in anterior wall thickness at the diastole (Awd) at baseline, 1 and 4 weeks after surgery. (j) Changes in LV mass index (LVMI) at baseline, 1 and 4 weeks after surgery. n = 8–12 per group. *P < 0.05, 24h IR and MI vs. baseline at same time point. †P < 0.05, 24h IR and MI vs. 1h and 4h IR at same time point. ‡ P < 0.05 24h IR, MI vs. 1h, 4h IR and 12h IR at same time point. § P < 0.05 1w vs. 4w time point in 24h IR and MI groups.
Fig 6
Fig 6. Change of infarct wall thickness at 1 week after surgery and fibrosis at 4 weeks after surgery in different groups.
(a) Quantification of infarct wall thickness. n = 4-5 per group. (b) Representative LV cross-sections stained with Sirius red at 1 week after surgery. (c) Quantification of fibrosis. Data are expressed as a percentage within the infarct area. n = 8-12 per group. (d) Representative LV cross-sections stained with Sirius red for scar tissue (fibrosis) at 4 weeks after surgery. *P < 0.05 vs. sham. †P < 0.05 vs. 1h I/R. ‡ P < 0.05 vs. 4h I/R.
Fig 7
Fig 7. The changes of the total cell number and the size of coagulative necrotic myocardium in the infarct region from different groups at 5, 7 and 10 days after surgery.
(a) Representative images of HE stained left ventricular (LV) sections. Scale bar = 50 μm. (b) Quantification of total cell counting. Data were expressed as number of nuclei per mm2. (c) Changes in the size of the coagulative necrotic myocardium. Data were expressed as a percentage of the entire infarct region. n = 4 per group. *P < 0.05 12h, 24h IR and MI vs. 1h and 4h IR at same time point. †P < 0.05 12h and 24h IR groups vs. sham at same time point. ‡ P < 0.05 MI group vs. sham at same time point.
Fig 8
Fig 8. Densities of type 2 and non-type 2 macrophages and endothelial cells in different groups at 5, 7, 10 days after surgery.
(a) Representative images of type 2 macrophages (CD68 and CD206 double-immunofluorescent staining) in the infarct region. The yellow or orange colour (arrows) indicates overlap of CD68 (red) and CD206 (green) positive staining. Two amplified images (inset) show a typical overlap staining. Scale bar = 50 μm. (b) Quantification of the type 2 macrophages. Data were expressed as a percentage of the number of total cells. (c) Quantification of the non-type 2 macrophages (most were type 1 macrophages). Data were expressed as a percentage of the number of total cells. (d) Representative images showing endothelial cells density in the infarct region. IB4 (red) staining for endothelial cells and WGA (green) staining for myocardial cells. Scale bar = 50 μm. (e) Quantification of the endothelial cells numbers. Data were expressed as the number of the endothelial cells per mm2. n = 3-4 per group. *P < 0.05 1h and 4h IR vs. sham at same time point. †P < 0.05, 12h and 24h IR vs. sham at same time point. ‡ P < 0.05 MI vs. sham at same time point. § P < 0.05 MI vs. 1h, 4h, 12h, 24h IR groups at the same time point.

Similar articles

References

    1. Mathur R, Lakhawat V, Kesarwani V, Sarda P, Baroopal A. Study of mechanical complications in patients with acute ST-segment elevated myocardial infarction. Indian Heart J. 2024;76(1):60–2. doi: 10.1016/j.ihj.2024.01.015 - DOI - PMC - PubMed
    1. Rehan R, Virk S, Wong CCY, Passam F, Layland J, Keech A, et al. Intracoronary thrombolysis in ST-elevation myocardial infarction: a systematic review and meta-analysis. Heart. 2024;110(15):988–96. doi: 10.1136/heartjnl-2024-324078 - DOI - PMC - PubMed
    1. Scheldeman L, Sinnaeve P, Albers GW, Lemmens R, Van de Werf F. Acute myocardial infarction and ischaemic stroke: differences and similarities in reperfusion therapies-a review. Eur Heart J. 2024;45(30):2735–47. 10.1093/eurheartj/ehae371 - DOI - PubMed
    1. Stougiannou TM, Christodoulou KC, Dimarakis I, Mikroulis D, Karangelis D. To Repair a Broken Heart: Stem Cells in Ischemic Heart Disease. Curr Issues Mol Biol. 2024;46(3):2181–208. doi: 10.3390/cimb46030141 - DOI - PMC - PubMed
    1. Damluji AA, van Diepen S, Katz JN, Menon V, Tamis-Holland JE, Bakitas M, et al. Mechanical complications of acute myocardial infarction: a scientific statement from the American Heart Association. Circulation. 2021;144(2):e16–35. - PMC - PubMed

Publication types

MeSH terms

Substances

LinkOut - more resources