. 2025 Aug 22;11(34):eadt4814.
doi: 10.1126/sciadv.adt4814. Epub 2025 Aug 22.

An alternative cytoplasmic SFPQ isoform with reduced phase separation potential is up-regulated in ALS

Affiliations

An alternative cytoplasmic SFPQ isoform with reduced phase separation potential is up-regulated in ALS

Jacob Neeves et al. Sci Adv. .

Abstract

Splicing factor proline- and glutamine-rich (SFPQ) is an RNA binding protein that broadly regulates RNA metabolism. Although its nuclear roles are well studied, evidence of SFPQ's cytoplasmic functionality is emerging. Altered expression and nuclear-to-cytoplasmic redistribution of SFPQ have been recognized in amyotrophic lateral sclerosis (ALS) pathology, yet the mechanistic bases for these phenomena remain undetermined. We identified altered SFPQ splicing in ALS, increasing the expression of an alternative mRNA isoform lacking a nuclear localization sequence, which we termed "altSFPQ." We find that altSFPQ mRNA contributes to SFPQ autoregulation and is highly unstable yet exhibits context-specific translation with cytoplasm-predominant localization. Notably, reduced canonical SFPQ coincides with increased altSFPQ transcript expression in familial and sporadic ALS models, providing a mechanistic basis for SFPQ nuclear-to-cytoplasmic redistribution in patients with ALS. Last, we observe that the altSFPQ protein has reduced phase separation potential and differential protein binding compared to its canonical counterpart, providing insight into its mechanistic relevance to physiology and ALS pathogenesis.


Figures

Fig. 1.
Fig. 1.. AltSFPQ is an NMD target and contributes to SFPQ autoregulation.
(A) Mean percentage splicing (PSI) for each of the three splicing events across six stages of neuronal differentiation (see fig. S1C) in either nuclear or cytoplasmic fractions derived from four healthy hiPSC lines. (B) RNA expression (qPCR) relative to time point 0 when DRB treatment was administered, normalized at each time point over GAPDH, in HEK293T cells (n = 3). (C) WtSFPQ and altSFPQ mRNA levels (qPCR) normalized over GAPDH and POLR2B, in SMG1 inhibitor (SMG1i) and mock-treated HEK293T cells (n = 3; unpaired t tests). (D) Representative images of BaseScope RNA-FISH on untreated and SMG1i-treated HEK293T cells, probed for either wtSFPQ or altSFPQ. (E) Quantification of BaseScope SFPQ RNA puncta per cell in untreated (UT) and SMG1i-treated HEK293T cells (n = 3; average of ≥4 fields per replicate; unpaired t tests). (F) Ratio between altSFPQ and wtSFPQ transcript expression as measured by qPCR in SFPQ siRNA-treated hiPSC-derived DIV3 motor neurons (n = 3; unpaired t test). (G) WtSFPQ and altSFPQ mRNA expression levels (qPCR) normalized over GAPDH and POLR2B, in the HA-wtSFPQ plasmid (pSFPQ) and control plasmid (pEV) transfected HeLa cells (n = 3; unpaired t tests). (H) WtSFPQ and altSFPQ mRNA expression levels (qPCR) normalized over GAPDH, in wtSFPQ-T2A-mAPPLE and mAPPLE control lentiviral transduced DIV14 (day 11 posttransduction) i3Neurons (n = 3; unpaired t tests). Graphs are presented as means ± SEM. HKGs, housekeeping genes.
Fig. 2.
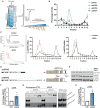
Fig. 2.. AltSFPQ encodes a previously unidentified SFPQ protein.
(A) Polysome profiling schema, with example absorbance profile. RNP, ribonucleoprotein. (B) Analysis of SFPQ transcripts and GAPDH mRNA by qPCR from hiPSC-derived NPCs (DIV7), plotted as the percentage of total (n = 3; one cell line derived from a healthy donor and two cell lines derived from a patient with VCP-ALS). (C) Polysome profiles obtained from hiPSC-derived DIV14 NPCs with (red) or without (black) EDTA treatment; EDTA treatment caused substantial loss of polysomes. Analysis (right) of wtSFPQ or altSFPQ mRNA expression by qPCR from each fraction, plotted as the percentage of total (n = 3; two cell lines from healthy donors and one cell line from a patient with VCP-ALS). (D) Schematic depiction of SFPQ isoforms and antibodies used for IP and immunoblotting. One antibody recognizes an epitope common to both proteins (“N”-term SFPQ antibody), whereas a C-terminally targeting antibody recognizes only wtSFPQ (“C”-term SFPQ antibody). RRMs, RNA recognition motifs. (E) Western blot showing the altSFPQ isoform expression in SMG1i-treated HEK293T cells; n = 3, stars demarcate the proteins. (F) AltSFPQ mRNA levels (qPCR, normalized over GAPDH) in nontargeting control ASO (NTC)–treated and ASO20-treated HEK293T cells (n = 3; unpaired t test). (G) Representative Western blot of the endogenous SFPQ protein expression in NTC-treated or ASO20-treated HEK293T cells; relates to (F). Initial IP using ab177149 (C terminus targeting) SFPQ antibody removes wtSFPQ and enables visualization of the altSFPQ protein in “cleared” fractions (using N-terminal SFPQ antibody). An 8-μg input was loaded along with increasing amounts of cleared lysate; an input equivalent amount of the bead eluate was loaded. (H) Quantification of altSFPQ (normalized over vinculin) in (G), using the highest-quantity cleared lysate within each replicate (n = 3; unpaired t test). Graphs are presented as means ± SEM.
Fig. 3.
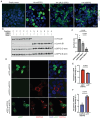
Fig. 3.. AltSFPQ encodes a cytoplasm-predominant protein, which attenuates subcellular distribution of DBHS proteins.
(A) Representative immunofluorescence images showing the subcellular localization of HA-tagged recombinant SFPQ proteins in transfected HEK293T cells. (B) Western blot of nuclear-cytoplasmic fractionated SMG1i-treated HEK293T cells; vinculin and lamin B1 act as subcellular markers. (C) Quantification of the nuclear-cytoplasmic ratio of SFPQ proteins in fractionated SMG1i Western blots; the C-term SFPQ antibody signal is used to quantify wtSFPQ, and the N-term antibody is used to quantify the smaller visible SFPQ protein (i.e., altSFPQ); n = 3; one-way ANOVA, Tukey’s multiple comparisons. (D) HEK293T cells were transfected with 100 ng of eGFP-wtSFPQ (+100 ng of EV plasmid), 100 ng of mAPPLE-wtSFPQ (+100 ng of EV plasmid), or 100 ng of each tagged SFPQ protein; representative zoomed-in images are displayed (arrowheads show co-localized cytoplasmic eGFP and mAPPLE signals; stars show the nuclei exhibiting both eGFP and mAPPLE signal). (E) Image analysis quantification relating to (D), measuring the nuclear-cytoplasmic ratio (using a 20-μm perinuclear ring region) of the eGFP signal (reflecting the eGFP-wtSFPQ protein) in eGFP-wtSFPQ transfected versus eGFP-wtSFPQ/mAPPLE-altSFPQ cotransfected cells (n = 3; each data point represents the average across ≥5 fields of view for each replicate; unpaired t test). a.u., arbitrary units. (F) As for (E) but assessing the nuclear-cytoplasmic ratio of the mAPPLE signal (reflecting the mAPPLE-altSFPQ protein) (n = 3; each data point represents the average of ≥5 fields of view for each replicate; unpaired t test).
Fig. 4.
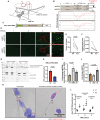
Fig. 4.. AltSFPQ exhibits reduced phase separation compared to wtSFPQ and is up-regulated during neuronal stress.
(A) AlphaFold-predicted wtSFPQ protein structure showing the isoform-specific low-complexity C-terminal region (red). (B) Schematic depiction of wtSFPQ and altSFPQ protein domains and IUPred disorder prediction graphs. aa, amino acids. (C) SFPQ protein purification strategy for LLPS assays. (D) Representative images of the eGFP-(wt/alt)SFPQ protein homotypic liquid droplet formation through increasing PEG and fixed protein (3 μM) concentrations, in 150 mM salt buffer; zoomed insets demonstrate spherical forms. (E) Quantification of the LLPS droplet number for 3 μM eGFP-(wt/alt)SFPQ proteins in 150 mM salt buffer and 1% PEG (n = 3; unpaired t test). (F) Ratio of GFP intensity inside/outside LLPS droplets for 3 μM eGFP-(wt/alt)SFPQ proteins in 150 mM salt buffer and 1% PEG (n = 3; unpaired t test). (G) Representative image of the sedimentation assay, gel loaded with supernatant and pellet fractions of TEV cleaved eGFP-SFPQ proteins ± PEG. (H) Quantification of the pellet/supernatant ratio of cleaved eGFP-SFPQ proteins, for samples processed without PEG (n = 3; unpaired t test). (I) AltSFPQ expression (qPCR) in nuclear fractions of motor neurons (DIV6) in response to sorbitol-induced osmotic (OSM) and sodium arsenite–induced oxidative (OX) stresses, normalized over Nit1 and NFX1 fraction housekeeping genes (Frac_HKGs). Data are expressed as FC over untreated samples per line and presented as means ± SEM from three control lines; ANOVA with Dunnett’s multiple comparisons. (J) As for (I) but in cytoplasmic fractions. (K) Representative images of untreated and sodium arsenite–treated motor neurons (DIV6), with BaseScope altSFPQ RNA-FISH, DAPI, and bright-field differential interference contrast (DIC) overlay; arrowheads show RNA puncta within axons. (L) Quantification of BaseScope RNA-FISH puncta per cell in untreated versus sodium arsenite–induced oxidative stress condition in motor neurons (DIV6); data points reflect fields of view (n = 5 to 7), multiple unpaired t tests.
Fig. 5.
Fig. 5.. Altered C terminus drives differential protein binding partners for altSFPQ.
(A) RIP performed on whole-cell lysates from N2A cells expressing HA-SFPQ variants or an EV as a negative control. Levels of associated mRNAs were assessed by qPCR using primers against the indicated targets and expressed as the percentage of total input (n = 3; data represent means ± SEM). (B) Three-way Venn diagram showing numbers of proteins significantly bound by WT-SFPQ, ALT-SFPQ, and NLS-SFPQ proteins over the EV condition (EV; log2FC > 0.5, P < 0.05) from affinity purification proteomics data from untreated cells. (C) ORA of 808 SFPQ-bound proteins (subsetted based on >0.3 positive correlation with the bait HA-proteins) comparing ALT versus WT binding enrichment from untreated cells (top 10 gene ontology pathways and Kyoto Encyclopedia of Genes and Genomes terms displayed). (D) As for (C) but for terms associated with increased ALT-SFPQ over NLS-SFPQ protein binders. (E) As for (B) but from oxidative-stressed cells. (F) As for (C) in oxidative-stressed cells. (G) As for (D) but from oxidative-stressed cells. Some GO terms are shortened.
Fig. 6.
Fig. 6.. AltSFPQ mRNA is up-regulated in familial and sporadic ALS iPSMNs.
(A) Line graph showing the mean delta PSI value (VCP mutant–control) for wtSFPQ and altSFPQ splicing events across six stages of neuronal differentiation in either nuclear (left) or cytoplasmic (right) fractions derived from four control and four VCP mutant hiPSC lines. (B) Bar graphs showing SFPQ exon 9 to 11 splicing levels analyzed by qPCR for NPC nuclear and cytoplasmic fractions from control and VCP mutant samples. Splicing was measured by normalizing target expression over the gene expression (constitutive exon) level for each line (left). The right panel depicts the same but for transcript abundance (target normalized over NIT1 and NFX1 fraction housekeeping genes). Data expressed as FC over controls and presented as means ± SEM from four lines per group, with data points representing the mean value for each biological line across two technical replicates; unpaired t tests. (C) Violin plots showing CTRL-FUS delta PSI values (y axis) for SFPQ splicing events (wtSFPQ/exon 9 to 10 in red; altSFPQ/exon 9 to 11 in blue) in FUS R521G mutant motor neurons versus controls (55). (D) As for (C) in SOD1 A4V mutant motor neurons versus controls (56). (E) Violin plots showing PSI values (y axis) for SFPQ splicing events (wtSFPQ/exon 9 to 10 in red; altSFPQ/exon 9 to 11 in blue) in >200 sporadic ALS iPSMNs and >50 control samples (57, 58).
Fig. 7.
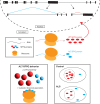
Fig. 7.. Proposed model of SFPQ protein redistribution in ALS.
Under control conditions, the SFPQ gene expresses at least two splicing isoforms; wtSFPQ (red RNA) encodes a nuclear predominant protein, the other (altSFPQ; blue RNA) is largely degraded but encodes a primarily cytoplasmic protein. The altSFPQ protein exhibits reduced phase separation propensity and partially distinct protein interactome, including translation-associated machinery. In ALS models, wtSFPQ is reduced whereas altSFPQ is increased, possibly resulting in reduced nuclear and increased cytoplasmic SFPQ proteins, manifesting as the nuclear-to-cytoplasmic redistribution of total SFPQ protein in disease.

Similar articles

References

    1. Neumann M., Sampathu D. M., Kwong L. K., Truax A. C., Micsenyi M. C., Chou T. T., Bruce J., Schuck T., Grossman M., Clark C. M., McCluskey L. F., Miller B. L., Masliah E., Mackenzie I. R., Feldman H., Feiden W., Kretzschmar H. A., Trojanowski J. Q., Lee V. M., Ubiquitinated TDP-43 in frontotemporal lobar degeneration and amyotrophic lateral sclerosis. Science 314, 130–133 (2006). - PubMed
    1. Kwiatkowski T. J. Jr., Bosco D. A., Leclerc A. L., Tamrazian E., Vanderburg C. R., Russ C., Davis A., Gilchrist J., Kasarskis E. J., Munsat T., Valdmanis P., Rouleau G. A., Hosler B. A., Cortelli P., de Jong P. J., Yoshinaga Y., Haines J. L., Pericak-Vance M. A., Yan J., Ticozzi N., Siddique T., McKenna-Yasek D., Sapp P. C., Horvitz H. R., Landers J. E., Brown R. H. Jr., Mutations in the FUS/TLS gene on chromosome 16 cause familial amyotrophic lateral sclerosis. Science 323, 1205–1208 (2009). - PubMed
    1. Vance C., Rogelj B., Hortobágyi T., De Vos K. J., Nishimura A. L., Sreedharan J., Hu X., Smith B., Ruddy D., Wright P., Ganesalingam J., Williams K. L., Tripathi V., Al-Saraj S., Al-Chalabi A., Leigh P. N., Blair I. P., Nicholson G., de Belleroche J., Gallo J.-M., Miller C. C., Shaw C. E., Mutations in FUS, an RNA processing protein, cause familial amyotrophic lateral sclerosis type 6. Science 323, 1208–1211 (2009). - PMC - PubMed
    1. Tyzack G. E., Luisier R., Taha D. M., Neeves J., Modic M., Mitchell J. S., Meyer I., Greensmith L., Newcombe J., Ule J., Luscombe N. M., Patani R., Widespread FUS mislocalization is a molecular hallmark of amyotrophic lateral sclerosis. Brain 142, 2572–2580 (2019). - PMC - PubMed
    1. Luisier R., Tyzack G. E., Hall C. E., Mitchell J. S., Devine H., Taha D. M., Malik B., Meyer I., Greensmith L., Newcombe J., Ule J., Luscombe N. M., Patani R., Intron retention and nuclear loss of SFPQ are molecular hallmarks of ALS. Nat. Commun. 9, 2010 (2018). - PMC - PubMed

MeSH terms

LinkOut - more resources