. 2025 Aug 22;11(34):eady3349.
doi: 10.1126/sciadv.ady3349. Epub 2025 Aug 22.

Light-triggered molecular mechanotherapy of tumor using membrane-mimicking conjugated oligoelectrolytes

Affiliations

Light-triggered molecular mechanotherapy of tumor using membrane-mimicking conjugated oligoelectrolytes

Peirong Zhou et al. Sci Adv. .

Abstract

A class of light-mediated mechanotherapeutic agents was developed on the basis of conjugated oligoelectrolytes (COEs), which mimic the topology of lipid membranes and intrinsically exhibit excellent biocompatibility. Low-dose white light irradiation (20 milliwatts per square centimeter for 10 minutes) substantially decreased the half-maximal inhibitory concentration of the optimized COE against A549 cancer cells from more than 256 to 0.6 micromolar. Typical photodynamic and photothermal effects were not responsible for the potent anticancer efficacy. Biophysical and photophysical experiments using vesicle models revealed that COEs can induce mechanical force likely by molecular conformation change within lipid membranes under light exposure, supporting the mechanotherapeutic mechanism by which COEs after excitation can physically disrupt cell membrane. Investigation of two other COEs with similar spectral properties but different backbone architectures revealed that their mechanotherapeutic efficacy is dependent on molecular topology. These results highlight the potential to develop light-responsive mechanotherapeutic agents based on membrane-mimicking COE platform for cancer treatment.


Figures

Fig. 1.
Fig. 1.. Characterizations of photoelectronic properties of COEs.
(A) Chemical structure of COEs and their density functional theory (DFT) optimized backbones. (B) FRET analyses between donor fluorophore Ben and acceptor Nile Red in lipid bilayers. Signal intensity was measured in arbitrary units (a.u.). (C and D) Representative time-evolution snapshots of Ben (C) and S6 (D) in lipid bilayers at 0 (left) and 200 (right) ns, as predicted by MD. (E) Normalized absorption and emission spectra of 10 μM COEs in phosphate-buffered saline (PBS). (F) Cyclic voltammograms of Ben and S6 measured in n-Bu4NPF6 acetonitrile solution (0.1 M); Fc, ferrocene reference; SCE, saturated calomel electrode as the reference electrode. (G) Relative emission intensity of fluorescent probe HPF treated with Ben or S6. Excitation wavelength is 490 nm. FIt/FIt0, fluorescence intensity ratio (at 515 nm) after/before light exposure. (H) Relative absorbance degradation curves of ABDA treated with Ben or S6. The irradiation was performed using white light at 20 mW cm−2. A/A0, absorption value ratio (at 410 nm) after/before light exposure.
Fig. 2.
Fig. 2.. In vitro ROS generation and phototoxicity of COEs.
(A) Intracellular ROS evaluation using DCFH-DA probe for A549 cells treated by 5 μM COEs and white light irradiation (5 min, 20 mW cm−2) with PBS as control. (B) Micrographs of Ben- or S6-incubated A549 cells with or without light treatments, followed by double staining using calcein-AM (for viable cells, presented in green) and propidium iodide (PI; for dead cells, presented in red). Scale bars, 50 μm. (C) Live and dead cell subpopulation analyses using flow cytometry. (D and E) Viability of A549 cells that preincubated with different concentrations of Ben or S6 and treated by white light irradiation at 20 mW cm−2 for 10 min. (F) Photothermal effects of 20 μM Ben or S6 in PBS under 10 min of white light exposure at 20 mW cm−2. Neat PBS was used as control. (G) DFT-evaluated relative potential energy of Ben and S6 backbones along the dihedral between central core and stilbene wing segments, from trans-planar to cis-planar.
Fig. 3.
Fig. 3.. Light-triggered membrane intercalation and disruption of BT.
(A) Chemical structure of BT and its cyclic voltammogram in 0.1 M n-Bu4NPF6 acetonitrile solution. (B) Normalized absorption and emission spectra of 10 μM BT in PBS. (C) Quantitative analysis of LDH release from A549 cells subjected to COE and light treatments (n = 3). (D) Time-lapse micrographs of A549 cells treated with 10 μM BT in PBS. During the observation intervals, cells in the gray box were additionally irradiated by the built-in 514-nm laser using microscope’s bleaching model. Scale bars, 50 μm. (E) Zoom-out micrographs after the bleaching experiments in (D). Scale bars, 100 μm. (F) Relative emission intensity at 650 nm for LUVs (POPC:POPG, 85:15) treated by 10 μM BT in PBS with or without additional 488-nm excitation during detection intervals. I/I0, fluorescence intensity ratio (650 nm) after/before light exposure.
Fig. 4.
Fig. 4.. Membrane permeabilization analysis of COE-treated A549 cells.
Confocal images of COE-treated A549 cells stained by cell-impermeant DNA dye. (A and B) Cells treated with 10 μM BT and (A) exposed to white light irradiation or (B) maintained in the dark, then stained with DAPI. (C) Ben-treated or (D) S6-treated cells following white light irradiation, then stained with PI. Relative to the Dark group, cells in the Light group were exposed to white light at 20 mW cm−2 during observation intervals. Scale bars, 50 μm. Time-dependent fluorescence intensities of DNA dye were presented in the right panel with three cells statistically analyzed.
Fig. 5.
Fig. 5.. Mechanistic investigation of light-triggered mechanical membrane disruption.
(A) Dead cell subpopulation evaluated using flow cytometry for BT-treated A549 cells supplemented by ROS scavengers, including N-acetylcysteine (NAC) or vitamin C (ViC). (B) Calcein leakage experiments for COE-treated LUVs under white light exposure. FIt/FIt0, fluorescence intensity ratio (515 nm) after/before light exposure. (C) Membrane fluidity assessed by measuring the generalized polarization (GP) value using Laurdan indicator for BT-treated LUVs with or without white light irradiation at 20 mW cm−2 (n = 3). LUVs without COE treatment were used as control. (D) Schematic representation of COE-containing multilamellar lipid sample fabricated by drop casting on silicon wafer for XRD characterizations. (E and F) XRD curves of untreated (E) or BT-containing (F) multilamellar lipid sample subjected to white light irradiation for 20 min. (G and H) Evolution of femtosecond transient absorption spectra for BT-containing LUVs following 465-nm excitation. (I) Selected kinetic traces and corresponding fits at 860 and 890 nm. ΔA (mOD), difference in optical density before and after pumping.
Fig. 6.
Fig. 6.. Morphology changes of COE-containing LMVs under laser irradiation.
Time-lapse micrographs of COE-containing LMVs (composed of 20 mM lipids and 20 μM COEs) in PBS. During the observation intervals, LMVs in the yellow box were additionally irradiated by the built-in laser using microscope’s bleaching model. (A) BT-containing LMVs exposure to 514-nm laser (~3 mW), (B) Ben-containing LMVs, or (C) S6-containing LMVs exposure to 405-nm laser (~3 mW). LMVs in the gray box without additional irradiation were used as control. Scale bars, 20 μm.
Fig. 7.
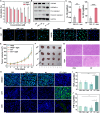
Fig. 7.. Programmed cell death and in vivo therapeutic effect of light-activated BT.
(A) Viability of BT-incubated A549 cancer cells after white light irradiation at 20 mW cm−2 for 10 min. (B) Expression levels of cleaved caspase-1 and GSDMD-N in A549 cells as assessed by Western blot analysis. (C) IL-18 and IL-1β content detected using ELISA for supernatant of BT-treated A549 cell culture after light treatment (n = 3). (D) Representative images of HMGB1 and CRT immunofluorescence staining for A549 cells after BT and irradiation treatments. Scale bar, 50 μm. (E) Tumor volume growing trend within 2 weeks after intratumoral injection of BT, followed by light treatment (n = 4). (F) Photographs of tumors collected from mice after 2 weeks of treatment. (G) Hematoxylin and eosin (H&E)–staining analysis of tumor sections after BT and irradiation treatments. (H) Representative confocal images of HMGB1, CRT, and CD8 levels in 4T1 tumor sections. Scale bars, 50 μm. (I and J) TFN-α and INF-α levels in serum after BT treatment as detected by ELISA (n = 3). Data are presented as means ± SD. *P < 0.05, **P < 0.01, and ***P < 0.001 were determined using one-sample t tests. TNF-α, tumor necrosis factor–α; IFN-γ, interferon-γ.

Similar articles

References

    1. Willyard C., Cancer therapy: An evolved approach. Nature 532, 166–168 (2016). - PubMed
    1. Siegel R. L., Giaquinto A. N., Jemal A., Cancer statistics, 2024. CA Cancer J. Clin. 74, 12–49 (2024). - PubMed
    1. Li J., Zhu L., Kwok H. F., Nanotechnology-based approaches overcome lung cancer drug resistance through diagnosis and treatment. Drug Resist. Updat. 66, 100904 (2023). - PubMed
    1. Zhao Y., Zhang L., Jiang T., Long J., Ma Z., Lu A., Cheng Y., Cao D., The ups and downs of poly(ADP-ribose) polymerase-1 inhibitors in cancer therapy–Current progress and future direction. Eur. J. Med. Chem. 203, 112570 (2020). - PubMed
    1. Zheng X., Song X., Zhu G., Pan D., Li H., Hu J., Xiao K., Gong Q., Gu Z., Luo K., Li W., Nanomedicine combats drug resistance in lung cancer. Adv. Mater. 36, 2308977 (2024). - PubMed

Substances

LinkOut - more resources