. 2025 Aug 22;11(34):eadx5687.
doi: 10.1126/sciadv.adx5687. Epub 2025 Aug 22.

A Dapl1+ subpopulation of naïve CD8 T cells is enriched for memory-lineage precursors

Affiliations

A Dapl1+ subpopulation of naïve CD8 T cells is enriched for memory-lineage precursors

Adam C Lynch et al. Sci Adv. .

Abstract

Memory CD8 T cells provide long-lasting immunity, but their developmental origins remain incompletely defined. Growing evidence suggests that functional heterogeneity exists within the naïve T cell pool, shaping lineage potential before antigen stimulation. Here, we identify a subpopulation of naïve CD8 T cells expressing death-associated protein-like 1 (Dapl1) that contains preprogrammed precursors biased toward memory differentiation. The differentiation of these precursors is independent of Dapl1 but relies on the transcription factor B-cell lymphoma/leukaemia 11b (Bcl11b), resulting in the generation of Dapl1+ central memory-like CD8 T cells after infection and stem-like memory cells in cancer. Dapl1+ naïve T cells originate among mature thymocytes and gradually appear in the periphery postnatally. Peripheral Dapl1+ and Dapl1- populations show limited plasticity, supporting a thymic-imprinting model. These findings reveal a developmentally imprinted subset of naïve CD8 T cells committed to memory fate, uncovering an alternative pathway for memory T cell generation offering new avenues for therapeutic application.


Figures
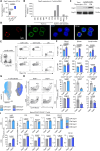
Fig. 1.
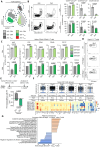
Fig. 1.. Dapl1 expression is restricted to specific T cell populations.
(A) Normalized Dapl1 reads [fragments per kilobase of transcript per million mapped reads (FPKM)] from RNA-seq of WT (gray), Let-7KD (red), and Let-7Tg (blue) CTLs (GSE232541). (B) Normalized Dapl1 expression (DESeq2) in αβ T cell receptor (TCRαβ) T cell subsets, mined from the ImmGen genome browser. DP, double positive; CM, central memory.(C) Dapl1 protein expression [Western blot (WB)] in total thymocytes or CD4 and CD8 T cells from peripheral lymph nodes. (D) Confocal microscopy of CD8 T cells stained for Dapl1 (red), CD8α (green), and 4′,6-diamidino-2-phenylindole (DAPI) (blue). (E) Representative flow cytometry of lymphocytes taken from peripheral lymph nodes of B6 mice and intracellularly stained for Dapl1. PB, Pacific Blue. (F) Dapl1 expression by proportion (top) or mean fluorescence intensity (MFI) (bottom) in CD4 T cells (light blue), CD8 T cells (blue), or CD4CD8 [double negative (DN); gray] cells from the blood (n = 6), spleen (n = 3), or lymph nodes (n = 3) of B6 mice intracellularly stained for Dapl1. (G) UMAP of multicolor flow cytometry data from splenic T cells of B6 mice (n = 3 per group). (H) Flow cytometry analysis of CD122 and CD44 expression on Dapl1+ or Dapl1 splenocytes (left), with summary statistics (right). (I) Surface protein expression on naïve (CD44CD62L+) T cells calculated either as the proportion of Ly6C+ cells or MFI relative to the Dapl1 population (CD5, CD44, CD62L, CD127, and CD122). Statistical analyses were calculated using either an ordinary one-way analysis of variance (ANOVA) using Tukey’s correction [(A) and (F), top], two-tailed unpaired t tests [(F), bottom], or two-tailed paired t tests [(G) and (I)]. All data are representative of three biological replicates from one RNA-seq analysis (A) and two or more independent experiments [(B) to (G)] or are pooled from three biological replicates from two independent experiments [(E) to (I)].
Fig. 2.
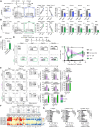
Fig. 2.. Characterization of Dapl1 reporter.
(A) CRISPR-Cas9–mediated Dapl1ZsG reporter gene construct strategy. 5′UTR, 5′ untranslated region. (B) Dapl1 expression in peripheral lymph nodes of Dapl1ZsG/WT mice (n = 3; left), with proportions of Dapl1+ cells and Dapl1+ MFIs of CD4 T cells (light green), CD8 T cells (green), or CD4CD8 cells (DN, gray) (right). (C) WB of Dapl1 and Zap70 expression in cell lysates from CD8 T cells from lymph nodes of WT, Dapl1ZsG/WT, or Dapl1ZsG/ZsG mice. (D) Representative UMAP projection (left) of multicolor flow cytometry data from spleens of Dapl1ZsG/WT mice with ZsG fluorescence. DC, dendritic cell; pDCs, plasmacytoid dendritic cells. (E) ZsG and RFP expression on splenocytes from a Dapl1ZsG/WTFoxp3RFP/RFP mouse. (F to H) Proportion of ZsG expressing cells within (F) spleen, (G) liver, and (H) gut subsets: small intestine intraepithelial lymphocyte (IEL), small intestine lamina propria lymphocyte (LPL), colon IEL, or colon LPL. Statistical analyses were calculated using ordinary one-way ANOVAs with Tukey’s correction for multiple comparisons. Data are representative of more than three independent experiments [(B), (E), and (F)], one experiment [(C) and (D)], three biological replicates from one experiment (G), or at least two biological replicates pooled from three independent experiments (H).
Fig. 3.
Fig. 3.. Dapl1 expression marks a distinct subpopulation of naïve CD8 T cells.
(A) Representative UMAP projection of multicolor flow cytometry data from splenic T cells of Dapl1ZsG/WTFoxp3RFP/RFP mice. (B) CD122 and CD44 expression on ZsG or ZsG+ splenocytes (left), with summary statistics (right). (C) Surface marker expression on naïve (CD44lowCD62Lhigh) T cells, calculated either as the proportion of Ly6C+ cells or MFI relative to the ZsG population (CD5, CD44, CD62L, and CD127). (D) ZsG expression among circulating WT Dapl1ZsG/WT, Dapl1ZsG/WTP14+Rag2−/−, or Dapl1ZsG/WTOT-I+Rag2−/− CD8 T cells. (E) ZsG expression in CD45.2+ CD8 T cells 30 days post–adoptive transfer of sorted ZsG or ZsG+ CD45.2+ CD8 T cells into CD45.1 hosts. (F) scRNA-seq analysis of naïve CD8 T cells from P14+Rag2−/−, OT-I+Rag2−/−, or WT datasets (GSE131847, GSE199563, GSE213470, GSE221969, GSE181784, and GSE186839), consisting of (top) violin plots representing Dapl1 heterogeneity, (middle) descriptions of the datasets, and (bottom) a heatmap of DEGs consistent among datasets. FC, fold change. (G) Pathway enrichment analysis denoting significantly different pathways between Dapl1+ and Dapl1 naïve CD8 T cells. JAK, Janus kinase; STAT, signal transducers and activators of transcription. Statistical analysis for (B) and (C) was calculated via two-tailed paired t tests for difference [(B) and (C)] or two-way ANOVA (E). All data are pooled from three biological replicates from at least two independent experiments [(A) to (C)], or representative of at least three independent experiments [(D) and (G)].
Fig. 4.
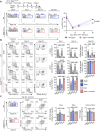
Fig. 4.. Biased differentiation of Dapl1+ CD8 T cells.
(A) Schematic of P14+Rag2−/− CD8+ T cell differentiation into CTLs, with Dapl1 expression, CD62L+Tim-3 and CD62LTim-3+ proportions, and relative surface marker expression (MFI fold change) in Dapl1+ versus Dapl1 subsets (n = 3). Irr.Spln, irradiated splenocytes. (B) ZsG expression in CTLs from P14+Dapl1ZsG/WTRag2−/− mice, with CD62L+Tim-3 and CD62LTim-3+ subset proportions and surface marker expression in ZsG versus ZsG+ cells (n = 3). (C) Proportions of ZsG+ CTLs after dimethyl sulfoxide or rapamycin supplementation of medium for 48 hours after activation (n = 3). (D) Schematic of LMGP33 infection and adoptive transfer, with ZsG expression in CD8 T cells from the blood (days 7 and 14) or spleen (≥day 30) (n = 8). (E) KLRG1 versus CD127 and CD62L versus CD44 expression in CD8 T cells over time, with summary (n = 8). INT, intermediate. (F) Public scRNA-seq datasets from LCMV or influenza A virus (IAV)-induced memory CD8 T cells, with Dapl1 heterogeneity (violin plots), dataset details (table), and shared DEGs (heatmap). d, day. (G) Fold changes in Dapl1+ and subset frequencies after retroviral-induced transcription factor (TF) overexpression (n = 3). Statistical analysis was calculated using two-tailed paired t tests [(A) and (B)], a two-tailed unpaired t test (C), ordinary two-way ANOVA with false discovery rate (FDR) correction (D), or ordinary one-way ANOVAs using multiple comparison corrections [(E) and (G)]. Data are representative of two or more independent experiments [(A) to (D)] or are pooled from three independent experiments (G).
Fig. 5.
Fig. 5.. Role of Dapl1 expression in differentiation of CD8 T cells.
(A) Schematic of LMGP33 infection and adoptive transfer, with ZsG or Dapl1 expression in CD8 T cells from blood (days 7 and 14) or spleen (≥day 30). (B) KLRG1 versus CD127 and CD62L versus CD44 expression in CD8 T cells over time, with summary. (C) TNFα and IFN-γ expression in day 30+ memory CD8 T cells 4 hours poststimulation with ionomycin and phorbol 12-myristate 13-acetate (PMA) (left), with quantification (right). Summary plots are pooled from 12 (WT) and 13 (Dapl1ZsG/ZsG) biological replicates at days 7 and 14 and 8 biological replicates at day 30+ for both groups from three independent experiments [(A) and (B)] or 8 (WT) or 6 (Dapl1ZsG/ZsG) biological replicates pooled from two independent experiments (C). Statistical analyses were conducted via ordinary two-way ANOVA with FDR correction (A), Brown-Forsythe and Welsh ANOVA tests (B), or a mixed-effects analysis with Šidák’s correction (C).
Fig. 6.
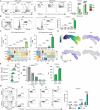
Fig. 6.. Dapl1+ naïve T cells originate from mature thymocytes.
(A) Foxp3 and ZsG expression on splenocytes from 1-day-old (n = 4), 1-week-old (n = 4), or 1-month-old (n = 3) Dapl1ZsG/WTFoxp3RFP/RFP mice (left), with quantification of ZsG expression among CD4 (light green), CD8 (dark green), and Treg cell (red) subsets (right). (B) Expression of ZsG in Dapl1ZsG/WT mice on mature thymic CD4 and CD8 populations, as marked by TCRβ (left), with summary (right). ISP, immature single positive. (C) Dapl1 expression by RNA-seq of thymic subsets sorted by maturity (top; GSE148973), with heatmaps of defining characteristics by subset (bottom). n.s., not significant. (D) UMAP plots regenerated from a single-cell multimodal thymocyte dataset (GSE186078) denoting pseudotime, Cd4, Cd8, and Dapl1 expression. (E) Surface CD24 expression in CD8 T cells from the thymus (Thy) or lymph nodes (LN) of Dapl1ZsG/WT mice stratified by ZsG expression (left), with summary (right). (F) ZsG MFI in CD8 T cells from the thymus or lymph nodes of Dapl1ZsG/WT mice (n = 3). (G) ZsG expression in thymocytes from Dapl1ZsG/WT mice treated with daily intraperitoneal injections of either ethanol (n = 2) or FTY720 (n = 3), with summary of replicates (right). All data are representative of two to four biological replicates from one experiment [(A) and (G)] or are representative of at least two independent experiments [(B), (E), and (F)]. Statistical analysis was conducted using either an ordinary two-way ANOVAs using Tukey’s correction [(A) and (G)], matched one-way ANOVA with Geisser-Greenhouse correction (B), DESeq2 (C), one-way Welsh’s ANOVA (E), or two-tailed unpaired t test (F).

References

    1. Blackburn S. D., Shin H., Freeman G. J., Wherry E. J., Selective expansion of a subset of exhausted CD8 T cells by αPD-L1 blockade. Proc. Natl. Acad. Sci. U.S.A. 105, 15016–15021 (2008). - PMC - PubMed
    1. Chang J. T., Wherry E. J., Goldrath A. W., Molecular regulation of effector and memory T cell differentiation. Nat. Immunol. 15, 1104–1115 (2014). - PMC - PubMed
    1. Gebhardt T., Park S. L., Parish I. A., Stem-like exhausted and memory CD8+ T cells in cancer. Nat. Rev. Cancer 23, 780–798 (2023). - PubMed
    1. Geiger R., Rieckmann J. C., Wolf T., Basso C., Feng Y., Fuhrer T., Kogadeeva M., Picotti P., Meissner F., Mann M., Zamboni N., Sallusto F., Lanzavecchia A., L-arginine modulates T cell metabolism and enhances survival and anti-tumor activity. Cell 167, 829–842.e13 (2016). - PMC - PubMed
    1. Huang A. C., Postow M. A., Orlowski R. J., Mick R., Bengsch B., Manne S., Xu W., Harmon S., Giles J. R., Wenz B., Adamow M., Kuk D., Panageas K. S., Carrera C., Wong P., Quagliarello F., Wubbenhorst B., D’Andrea K., Pauken K. E., Herati R. S., Staupe R. P., Schenkel J. M., McGettigan S., Kothari S., George S. M., Vonderheide R. H., Amaravadi R. K., Karakousis G. C., Schuchter L. M., Xu X., Nathanson K. L., Wolchok J. D., Gangadhar T. C., Wherry E. J., T-cell invigoration to tumour burden ratio associated with anti-PD-1 response. Nature 545, 60–65 (2017). - PMC - PubMed

MeSH terms

LinkOut - more resources