. 2025 Aug 22;11(34):eadv6937.
doi: 10.1126/sciadv.adv6937. Epub 2025 Aug 22.

AKR1B10 dictates c-Myc stability to suppress colorectal cancer metastasis via PP2A nitration

Affiliations

AKR1B10 dictates c-Myc stability to suppress colorectal cancer metastasis via PP2A nitration

Xiaoxue Wu et al. Sci Adv. .

Abstract

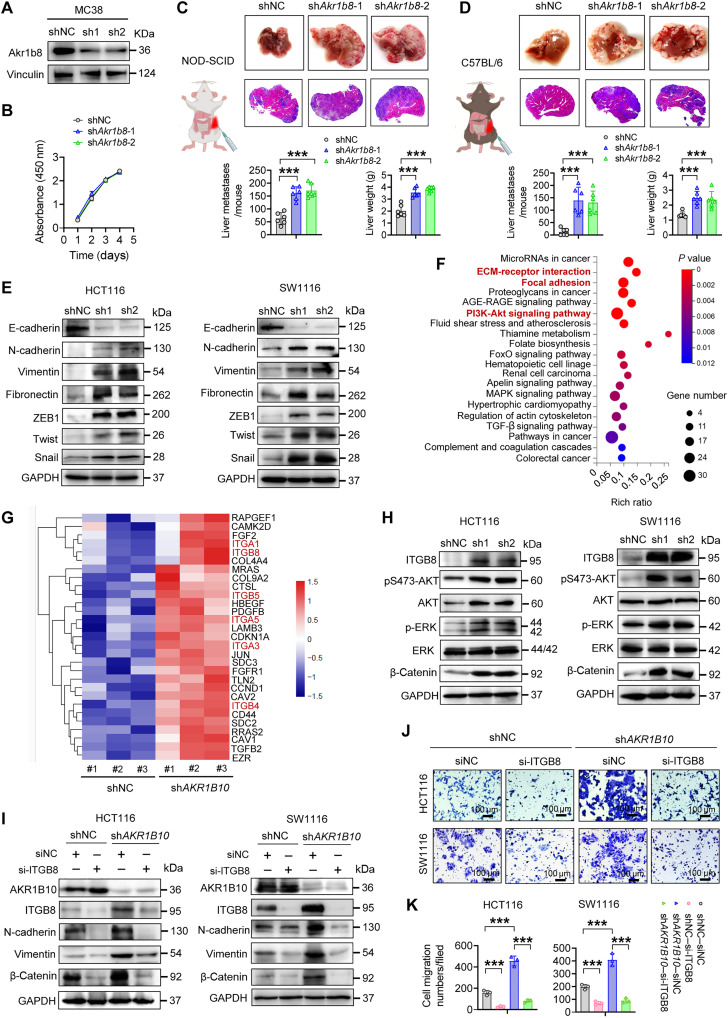
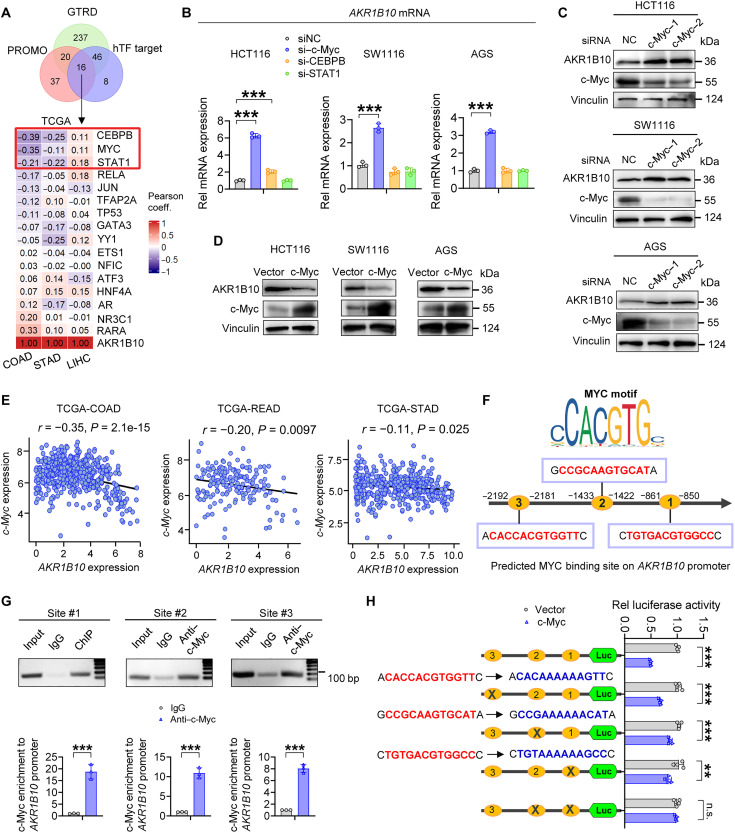
Metabolic enzymes, critical for cellular homeostasis, are frequently co-opted in a disease-specific manner to drive cancer progression. Here, we identify aldo-keto reductase family 1 member B10 (AKR1B10), down-regulated in gastrointestinal cancers, as a pivotal metastasis suppressor correlating with improved colorectal cancer (CRC) prognosis. Mechanistically, AKR1B10 activates protein phosphatase 2A (PP2A) by preventing redox-regulated nitration of its B56α subunit, preserving holoenzyme assembly and enabling c-Myc dephosphorylation at serine-62. Loss of AKR1B10 disrupts this pathway, stabilizing c-Myc, which drives integrin signaling and metastatic dissemination in CRC. We further demonstrate that lysine-125 of AKR1B10 is essential for its interaction with PP2A-Cα and B56α nitration, thereby attenuating CRC metastatic aggressiveness. Pharmacological restoration of PP2A activity effectively mitigates metastasis associated with AKR1B10 loss. In addition, c-Myc transcriptionally represses AKR1B10, establishing a feedback loop that sustains its down-regulation and enhances metastatic progression. This study uncovers an antimetastatic mechanism involving AKR1B10-mediated PP2A activation and highlights its potential as a biomarker and therapeutic target.


Figures

Fig. 1.
Fig. 1.. AKR1B10 down-regulated in CRC correlates with poor prognosis.
(A) Paired analysis of AKR1B10 mRNA expression in adjacent normal tissues versus primary tumor samples from TCGA colon adenocarcinoma (COAD; n = 41), rectum adenocarcinoma (READ; n = 9), and liver HCC (LIHC; n = 49) database. FPKM, fragments per kilobase of exon model per million mapped fragments. (B) Protein expression of AKR1B10 in COAD tissues compared to paired normal tissues based on cProSite database (n = 96). (C) Quantitative polymerase chain reaction (qPCR) analysis of AKR1B10 mRNA expression in paired CRC (n = 30)/GC (n = 21) tissues and adjacent normal tissues from SYSU-FAH. (D) Western blot analysis of AKR1B10 protein expression in 14 paired adjacent normal tissues (N) and CRC tissues (T) from SYSU-FAH. Rel, relative. (E and F) Representative IHC staining (E) and quantification (F) of AKR1B10 expression in CRC tumor microarrays (TMAs). Scale bars, 50 μm. (G to J) Analysis of AKR1B10 protein expression in CRC TMAs stratified by T stages (G), National Comprehensive Cancer Network stages (H), lymph node metastases (I), and distant metastases (J). n.s., not significant. (K and L) Kaplan-Meier overall survival curves of patients with low versus high AKR1B10 expression, derived from TCGA-COAD (n = 430)/READ (n = 154) databases (K), and IHC analysis of patients with CRC from SYSU-FAH (L) (n = 93). Data are analyzed with unpaired Student’s t test (F and H to J), paired Student’s t test (A to D), and log-rank test (K and L).
Fig. 2.
Fig. 2.. AKR1B10 curbs CRC metastasis in vitro and in vivo.
(A) Western blot analysis of AKR1B10 protein levels in human CRC (hCRC) cell lines. (B) Validation of AKR1B10 knockdown efficiency in HCT116 and SW1116 cells via Western blot and assessment of cell proliferation with Cell Counting Kit-8 (CCK-8) assays (n = 4). (C) Verification of AKR1B10 overexpression in LoVo cells by Western blot, with corresponding CCK-8 proliferation analysis (n = 4). (D and E) Representative images (D) and statistical analysis (E) of xenograft tumor volumes in nude mice implanted with HCT116 (shNC&shAKR1B10) cells (n = 5 mice per group). (F and G) Representative transwell assay images (left) and quantification (right) in HCT116/SW1116 cells (F) or LoVo cells after 48 hours (G). (H and I) Representative clonogenic assay images and quantification in HCT116/SW1116 cells (H) or LoVo cells (I). (J) H&E staining of lung metastatic nodules following intravenous injection of LoVo (Ctrl&AKR1B10-OE) cells. Ctrl, control; OE, overexpression. Scale bars, 250 μm. (K and L) Representative images (K) and quantification of lung tumor nodule area per section (L) in nude mice intravenously injected with HCT116 (shNC&shAKR1B10) cells (n = 5 mice per group). (M and N) Representative images and quantification of liver metastatic nodules in nude mice after splenic injection of HCT116 (shNC&shAKR1B10) cells (M), with corresponding H&E staining of liver metastatic lesions (N) (n = 5 mice per group). (O) mRNA expression levels of AKR1B10 in primary tumors (n = 56) and metastases (n = 27; liver = 23, peritoneum = 3, and lung = 1) based on GSE28702. (P and Q) Representative IHC images (P) and quantification (Q) of AKR1B10 in paired primary CRC tissues and liver metastatic lesions from 20 patients. Scale bars, 50 μm. (F to I) n = 3. Data are presented as mean ± SD, with two-way analysis of variance (ANOVA) test in (C) and (E) or unpaired Student’s t test (F to I, L, M, O, and Q). *P < 0.05, **P < 0.01, and ***P < 0.001.
Fig. 3.
Fig. 3.. AKR1B10 suppresses EMT by down-regulating integrin signaling.
(A) Western blot analysis of Akr1b8 knockdown efficiency in MC38 cells. (B) Cell proliferation rates of MC38 (shNC and shAkr1b8) cells assessed using the CCK-8 assay (n = 4). (C) Representative images of liver metastatic nodules in NOD-SCID mice on day 15 following splenic injection of MC38 shNC and shAkr1b8 cells. Liver weight and the number of metastases were quantified (n = 6 mice per group). (D) Representative images of liver metastatic nodules in C57BL/6 mice on day 18 following splenic injection of MC38 (shNC and shAkr1b8) cells. Liver weight and the number of metastases were quantified (n = 6 mice per group). (E) Western blot analysis of EMT markers and EMT-related TFs in HCT116 and SW1116 cells. GAPDH, glyceraldehyde-3-phosphate dehydrogenase. (F) Kyoto Encyclopedia of Genes and Genomes (KEGG) pathway enrichment analysis of the top 20 up-regulated biological processes in shAKR1B10 cells based on RNA sequencing (RNA-seq). PI3K, phosphatidylinositol 3-kinase; MAPK, mitogen-activated protein kinase; TGF-β, transforming growth factor–β; AGE-RAGE, Advanced Glycation End products–Receptor for Advanced Glycation End products; FoxO, Forkhead box O. (G) Heatmap depicting mRNA levels of genes from selected KEGG pathways. (H) Western blot analysis of ITGB8 protein and its downstream factors in HCT116 and SW1116 cells. p-ERK, phosphorylated ERK. (I) Western blot analysis of ITGB8 protein and its downstream EMT markers in HCT116 and SW1116 cells after ITGB8 silencing. (J and K) Representative images (J) and quantification (K) of transwell assays in HCT116 and SW1116 cells after ITGB8 silencing. (C, D, and K) n = 3. Data are presented as mean ± SD, with two-way ANOVA test (B) or unpaired Student’s t test (C, D, and K). ***P < 0.001.
Fig. 4.
Fig. 4.. AKR1B10 destabilizes c-Myc to repress integrin transcription.
(A) The Venn diagram showing three TFs capable of binding to integrin gene promoter regions in HCT116 cells and to the ITGB8 promoter region in various cancers, based on the ChIP-Atlas database. (B) Western blot analysis of c-Myc, RUVBL2, and MAX protein expression in HCT116 and SW1116 (shNC&shAKR1B10) cells. (C) qPCR analysis of integrin mRNA expression in HCT116 and SW1116 cells after c-Myc silencing. (D) Western blot analysis of ITGB8 protein and its downstream EMT markers in HCT116 and SW1116 cells after c-Myc silencing. (E and F) Representative images (E) and quantification (F) of transwell assay in HCT116 and SW1116 cells after c-Myc silencing. (G and H) Representative images (G) and quantification (H) of spheroid formation assays in HCT116 and SW1116 cells after c-Myc silencing. Scale bars, 50 μm. (I) Western blot analysis of c-Myc expression in HCT116 and SW1116 (shNC&shAKR1B10) cells after treatment with MG132 (10 μM for 8 hours). c-Myc protein levels were quantified and normalized to loading control (vinculin). (J) Detection of c-Myc protein turnover in HCT116 and SW1116 cells by Western blot after CHX (100 μg/ml) treatment and quantified by ImageJ software. h, hours. (C, F, H, and J) n = 3. Data are presented as mean ± SD, with unpaired Student’s t test (C, F, and H) or with two-way ANOVA test (J). **P < 0.01 and ***P < 0.001.
Fig. 5.
Fig. 5.. Targeting AKR1B10 enhances c-Myc stability by disrupting PP2A assembly.
(A) Western blot analysis of c-Myc protein expression, and its phosphorylation status in HCT116 and SW1116 (shNC&shAKR1B10) cells. (B) IP-MS analysis to identify AKR1B10-interacting kinases and phosphatases. m/z, mass/charge ratio. (C) Co-IP analysis showing the physical interaction of exogenous AKR1B10 with PPP2CA in HCT116 and SW1116 cells. (D) Physical interaction of endogenous AKR1B10 with PPP2CA was detected by Co-IP with anti-AKR1B10 antibody in HCT116 and SW1116 cells. (E) Immunofluorescent staining showing the colocalization of endogenous AKR1B10 with PPP2CA in HCT116 and SW1116 cells. Scale bars, 20 μm. DAPI, 4′,6-diamidino-2-phenylindole. (F) Western blot analysis of PPP2CA and PPP2R5A protein expression in HCT116 and SW1116 (shNC&shAKR1B10) cells. (G) PP2A activity assay in HCT116 and SW1116 (shNC&shAKR1B10) cells (n = 3). (H) Co-IP analysis of HA-PPP2CA in HCT116 cells coexpressing Flag-AKR1B10 with varying plasmid amounts, as indicated. (I) Co-IP analysis of PPP2R5A indicating increased 3-nitrotyrosine (3-NT) levels and reduced PPP2CA interaction in HCT116-shAKR1B10 cells. Pan-Ace, Pan Acetylation. (J and K) Co-IP analysis of PPP2R5A showing reduced 3-NT levels and increased interaction with PPP2CA in the presence of DPI [10 μM for 20 hours (J)] or FeTPPS [10 μM for 3 hours (K)] in HCT116 (shNC&shAKR1B10) cells. (L and M) Representative fluorescence-activated cell sorting (FACS) images (L) and quantification of intracellular reactive oxygen species (ROS) levels, and relative PP2A activities [(M); n = 3] in HCT116 (shNC&shAKR1B10) cells treated with DPI (10 μM for 20 hours). DMSO, dimethyl sulfoxide. (N and O) His-PPP2R5A-WT or His-PPP2R5A-Y238F plasmid was transfected into HCT116-shAKR1B10 cells with or without Flag-AKR1B10. Co-IP analysis showing reduced 3-NT levels of His-PPP2R5A-Y238F (N). Western blot demonstrating decreased total c-Myc, pS62 c-Myc, and reduced ITGB8 expression in the presence of His-PPP2R5A-Y238F (O). Data in (G) and (M) are presented as mean ± SD, with unpaired Student’s t test. **P < 0.01 and ***P < 0.001.
Fig. 6.
Fig. 6.. AKR1B10K125L impedes PP2A assembly to drive CRC metastasis.
(A) Schematic representation of AKR1B10 truncations and Co-IP analysis of Flag-tagged AKR1B10 truncations in HCT116 cells, as indicated. FL, full length. (B) Computational docking model predicting the interaction between AKR1B10 (red) and PP2A (purple) using the Global RAnge Molecular Matching (GRAMM) algorithm. (C) Co-IP analysis showing the interaction between PPP2CA with AKR1B10WT, AKR1B10K125L, AKR1B10P219S, and AKR1B10K263R in HCT116 cells, using an anti-HA antibody. (D and E) Recombinant GST-tagged AKR1B10 (WT or K125L) was incubated with His-PPP2CA (D) or His-PPP2R1A (E). Bound proteins were analyzed by Western blot. Data are representative of three independent experiments. (F) Representative FACS images and quantification of intracellular ROS levels in HCT116 shNC and shAKR1B10 cells expressing mock, AKR1B10WT, AKR1B10K125L, and AKR1B10C299S. (G) Alignment of K125 and C299 amino acid residues in AKR1B10 across multiple species. H. sapiens, Homo sapiens; M. musculus, Mus musculus; R. norvegicus, Rattus norvegicus; P. troglodytes, Pan troglodytes; M. mulatta, Macaca mulatta. (H) Co-IP analysis of PPP2R5A demonstrating increased 3-NT and reduced PPP2CA interaction in AKR1B10K125L and AKR1B10C299S overexpressing HCT116-shAKR1B10 cells. (I) Western blot analysis of c-Myc, phospho-Myc (p-Myc), and ITGB8 protein expression in HCT116 shNC and shAKR1B10 cells expressing mock, AKR1B10WT, AKR1B10K125L, and AKR1B10C299S. (J and K) Representative images (left) and quantification (right) of transwell assay (J), and relative PP2A activity (K) in HCT116 shNC and shAKR1B10 cells expressing mock, AKR1B10WT, AKR1B10K125L, and AKR1B10C299S. (L to O) Representative images (L) and quantification (M) of liver metastatic nodules in nude mice following splenic injection of HCT116 shNC and shAKR1B10 cells expressing mock, AKR1B10WT, and AKR1B10K125L. Representative H&E staining and IHC images of AKR1B10, ITGB8, and c-Myc staining in liver sections (N), with quantified histoscores (O) (n = 5 mice per group). (F, J, and K) n = 3. Data in (F), (J), (K), (M), and (O) are presented as mean ± SD, with unpaired Student’s t test. *P < 0.05, **P < 0.01, and ***P < 0.001.
Fig. 7.
Fig. 7.. PP2A activators counteract AKR1B10 loss–driven metastasis.
(A and B) Representative images (A) and quantification (B) of transwell assay in HCT116 cells treated with DT-061 or FTY-720. (C) Western blot analysis of c-Myc, p-Myc, and ITGB8 protein expression in HCT116 cells treated with DT-061 or FTY-720. (D and E) Intrasplenic injection mouse models treated with DT-061 (SMAP) via gavage at 5 mg/kg on alternate days (n = 5 mice per group). Representative images and quantification of liver metastatic lesions 30 days following HCT116 injection (D). Representative H&E staining of metastatic nodules in the liver (E). (F to J) HCT116 orthotopic implantation mouse models treated with SMAP via gavage at 5 mg/kg on alternate days (n = 8 mice per group). Representative images of primary tumors and liver metastases (F). Quantitative analysis of liver metastasis incidence (G), primary tumor volume and weight (H), number of metastatic nodules (I), and Ki67 IHC staining in primary tumors (J). (K to N) CT26 orthotopic implantation models treated with SMAP via gavage at 5 mg/kg on alternate days (n = 8 to 10 mice per group). Representative images of liver metastases (K). Quantitative analysis of liver metastasis incidence (L), primary tumor volume (M), and number of metastatic nodules (N). Data in (B), (D), (H), (I), (J), (M), and (N) are presented as mean ± SD, with unpaired Student’s t test. *P < 0.05, **P < 0.01, and ***P < 0.001.
Fig. 8.
Fig. 8.. c-Myc suppresses AKR1B10 transcription in gastrointestinal cancers.
(A) Bioinformatics analysis identifying three putative TFs that regulate AKR1B10 expression and show an inverse coexpression pattern with AKR1B10 between gastrointestinal cancer and HCC, based on TCGA database. coeff., coefficient. (B) Quantitative reverse transcription (qRT)–PCR analysis of AKR1B10 mRNA expression in HCT116, SW1116, and AGS cells transfected with small interfering RNAs (siRNAs) targeting c-Myc, CEBPB, or STAT1. (C and D) Western blot analysis of AKR1B10 protein expression in HCT116, SW1116, and AGS cells after c-Myc knockdown (C) or overexpression (D). (E) Correlation between AKR1B10 and c-Myc mRNA levels in human COAD (n = 494), READ (n = 173), and stomach adenocarcinoma (STAD; n = 405) tissues, based on TCGA database. (F) Identification of putative c-Myc binding sites within the AKR1B10 gene promoter region using the JASPAR database. (G) ChIP-qPCR analysis depicting the binding sites of c-Myc within the AKR1B10 promoter region in HCT116 cells. (H) Dual-luciferase reporter assay showing that mutations at both site 1 (−850 ~ −861) and site 2 (−1422 ~ −1433) abrogated c-Myc–mediated repression of AKR1B10 promoter activity. Luc, luciferase. Data in (B), (G), and (H) are presented as mean ± SD (n = 3), with unpaired Student’s t test. ***P < 0.001.
Fig. 9.
Fig. 9.. Dysregulation of the AKR1B10–c-Myc–ITGB8 axis drives CRC progression.
(A and B) Representative H&E and IHC images (A) and quantification (B) of AKR1B10, ITGB8, and c-Myc staining in paired primary CRC tissues and liver metastatic lesions from 20 patients. (C and D) Representative IHC images (C) and histoscore (D) of AKR1B10, ITGB8, and c-Myc staining in primary tumors and liver sections from the HCT116 orthotopic implantation mouse model (n = 6). (E) Correlation analysis of IHC scores between AKR1B10 and ITGB8 or c-Myc in CRC TMAs. (F and G) Kaplan-Meier survival curves of patients with CRC stratified by high or low c-Myc/ITGB8 expression levels (F) and AKR1B10/ITGB8 or AKR1B10/c-Myc expression levels (G) from CRC TMAs. (H) Schematic diagram illustrating how down-regulated AKR1B10 accelerates CRC metastasis. Ub, ubiquitin. Data are presented as mean ± SD, with paired (B) or unpaired (D) Student’s t test or log-rank test (G).

Similar articles

References

    1. Siegel R. L., Miller K. D., Fuchs H. E., Jemal A., Cancer statistics, 2022. CA Cancer J. Clin. 72, 7–33 (2022). - PubMed
    1. Cañellas-Socias A., Sancho E., Batlle E., Mechanisms of metastatic colorectal cancer. Nat. Rev. Gastroenterol. Hepatol. 21, 609–625 (2024). - PubMed
    1. Biller L. H., Schrag D., Diagnosis and treatment of metastatic colorectal cancer: A review. JAMA 325, 669–685 (2021). - PubMed
    1. Arnold M., Sierra M. S., Laversanne M., Soerjomataram I., Jemal A., Bray F., Global patterns and trends in colorectal cancer incidence and mortality. Gut 66, 683–691 (2017). - PubMed
    1. Chowdhury D., Keogh M.-C., Ishii H., Peterson C. L., Buratowski S., Lieberman J., γ-H2AX dephosphorylation by protein phosphatase 2A facilitates DNA double-strand break repair. Mol. Cell 20, 801–809 (2005). - PubMed

MeSH terms

LinkOut - more resources