. 2025 Aug 22;10(110):eadt6660.
doi: 10.1126/sciimmunol.adt6660. Epub 2025 Aug 22.

HIV broadly neutralizing antibody precursors to the Apex epitope induced in nonhuman primates

Affiliations

HIV broadly neutralizing antibody precursors to the Apex epitope induced in nonhuman primates

Krystal M Ma et al. Sci Immunol. .

Abstract

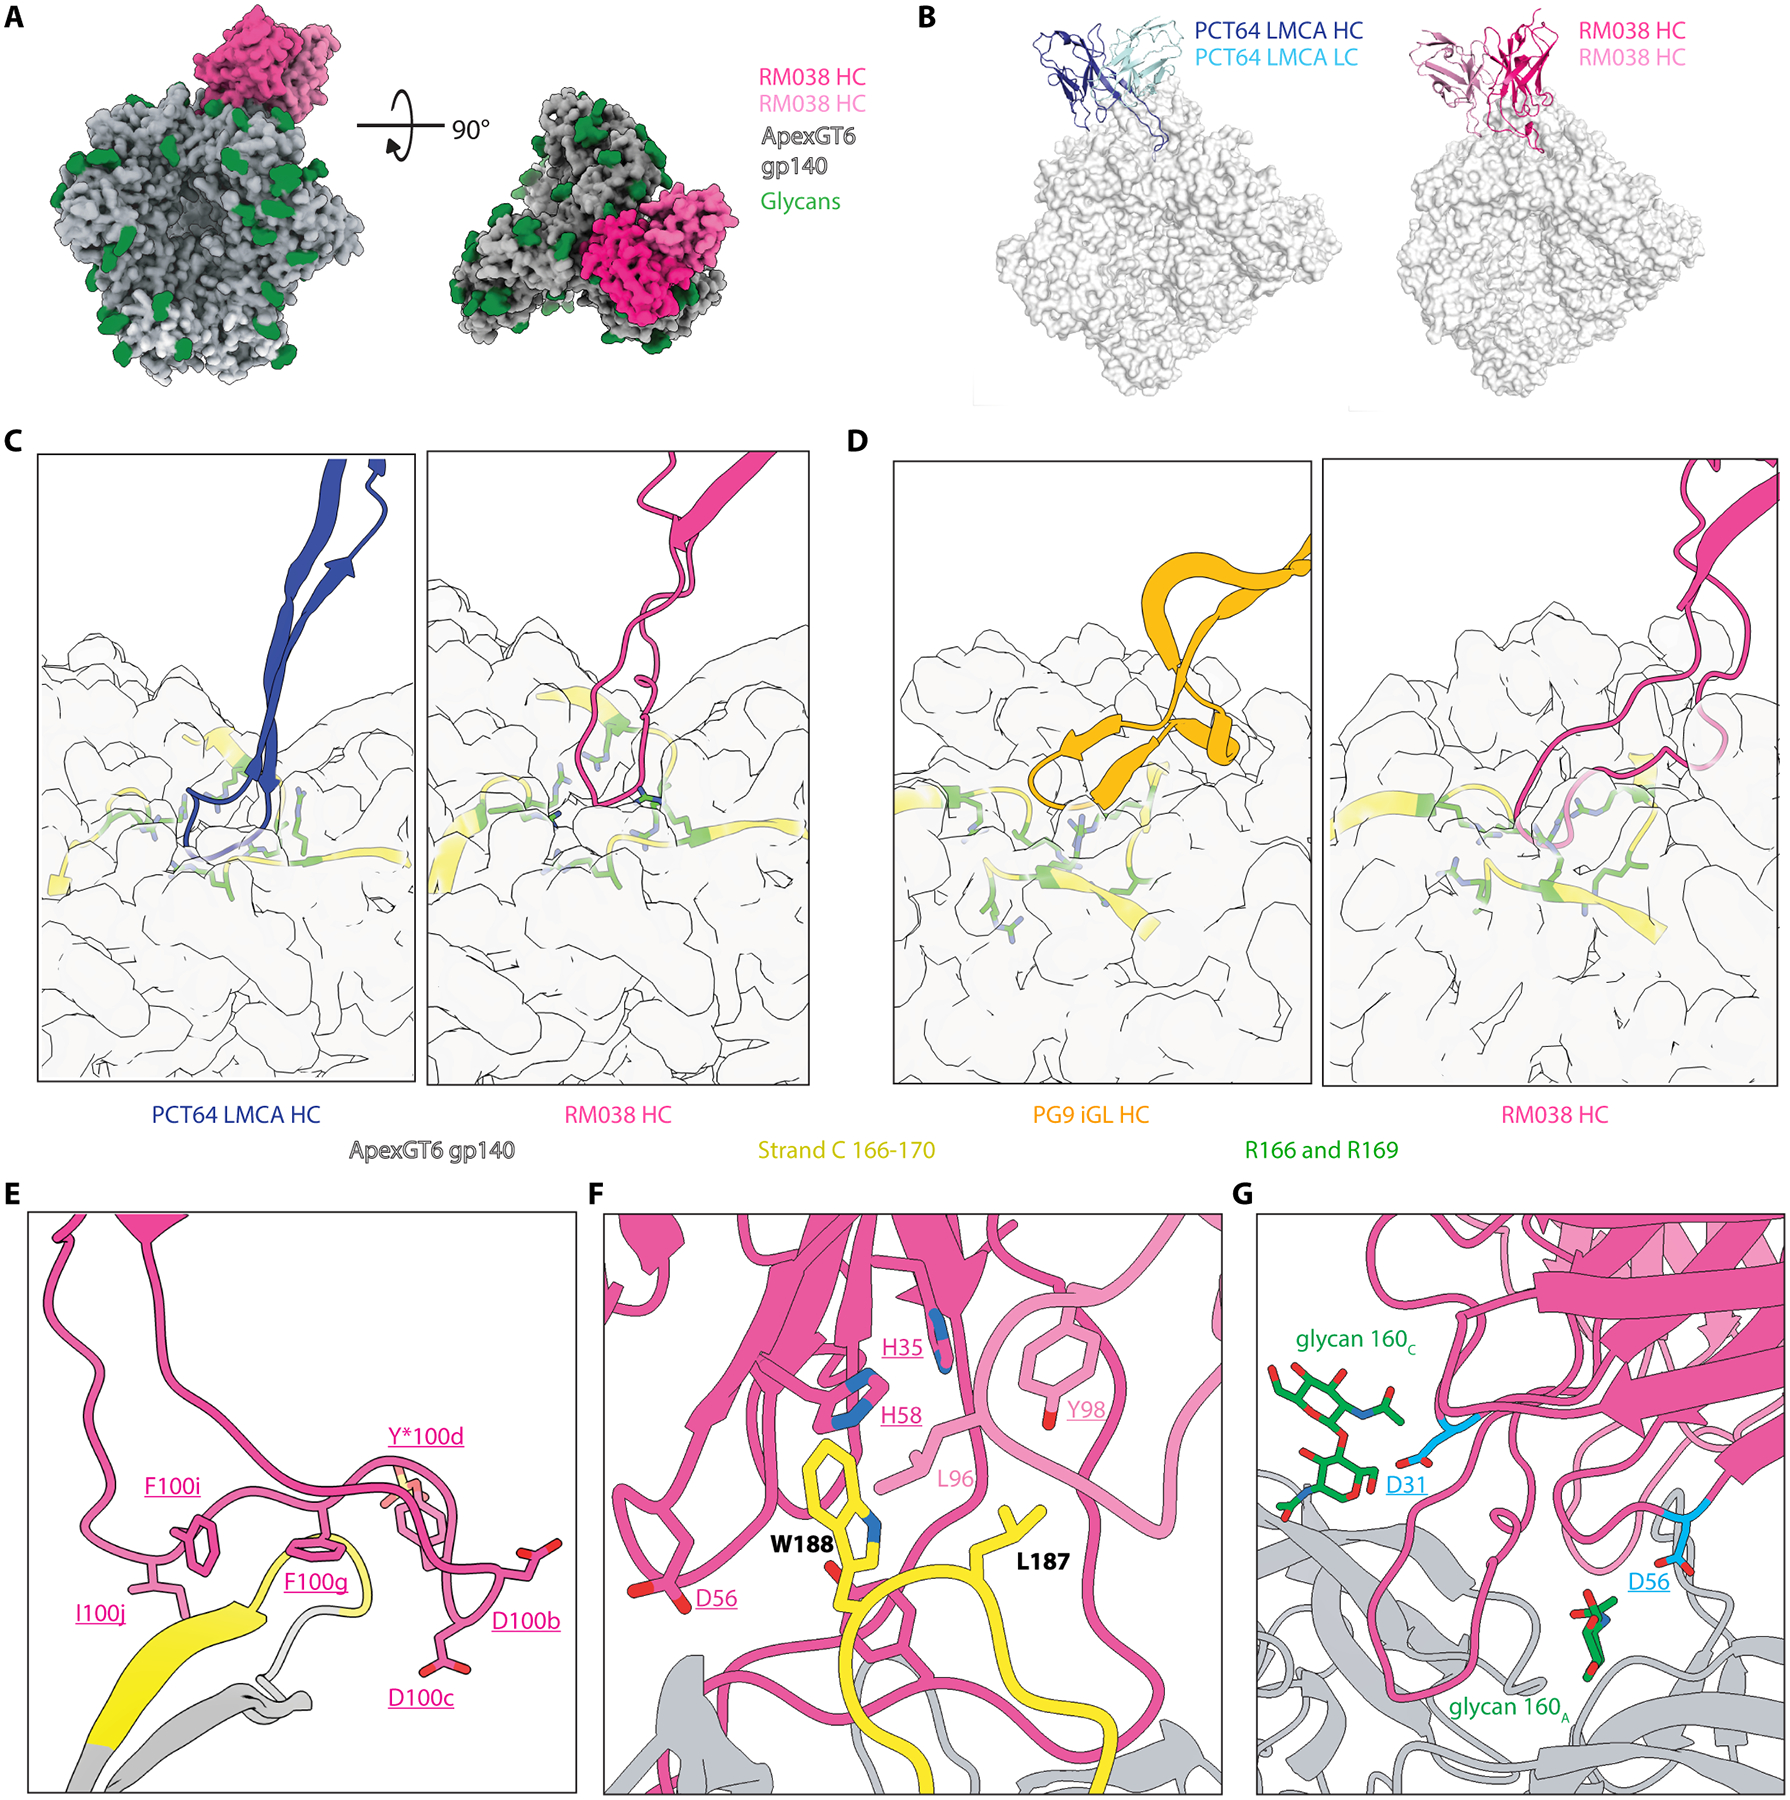
An effective prophylactic HIV vaccine will likely need to induce broadly neutralizing antibodies (bnAbs). bnAbs to the Apex region of the HIV envelope glycoprotein (Env) are promising targets for vaccination because of their relatively low somatic hypermutation compared with other bnAbs. Most Apex bnAbs engage Env using an exceptionally long heavy-chain complementarity-determining region 3 (HCDR3) containing specific binding motifs, which reduces bnAb precursor frequency and makes priming of rare bnAb precursors a likely limiting step in the path to Apex bnAb induction. We found that adjuvanted protein or mRNA lipid nanoparticle (LNP) immunization of rhesus macaques with ApexGT6, an Env trimer engineered to bind Apex bnAb precursors, consistently induced Apex bnAb-related precursors with long HCDR3s bearing bnAb-like sequence motifs. Cryo-electron microscopy revealed that elicited Apex bnAb-related HCDR3s had structures combining elements of several prototype Apex bnAbs. These results achieve a critical HIV vaccine development milestone in outbred primates.


Conflict of interest statement

Competing interests: K.M.M., J.M.S., and W.R.S. are inventors on patent applications related to immunogens in this manuscript filed by Scripps and IAVI. X.H., M.S., S.H., and W.R.S. are employees and shareholders of Moderna, Inc. D.J.I. and S.C. are inventors on patent No. 11,547,672 held by the Massachusetts Institute of Technology that covers SMNP adjuvant. D.R.B. is a paid consultant of IAVI.

Figures

Fig. 1.
Fig. 1.. Structure-guided directed evolution produced ApexGT6 candidate immunogens to prime Apex bnAb-like precursor responses.
(A) Somatic hypermutation of bnAbs versus their HCDR3 length. Somatic hypermutation was calculated by combining the number of mutations on the heavy and light chain variable regions (VH and Vκ/λ), then dividing by their combined length. All calculations were based on aa mutations. Each dot represents a bnAb target, colored by its directed epitope. (B) The immunogen design pathway starting with previously designed ApexGT trimers to ApexGT6 congly gp140 and ApexGT6 L14 gp151. The libraries were designed using the high-resolution cryoEM structure of ApexGT2.2MUT (displayed as a grey surface) in combination with PCT64 LMCA (depicted as a red cartoon). The mutations from each library are represented by blue ribbons or spheres. The enriched mutations were combined to produce ApexGT6 (surface representation, gp120 is colored orange, gp41 is taupe, and glycans are depicted as beige spheres). (C) Surface plasmon resonance (SPR) KDs for MD39 and ApexGT trimer analytes binding to PCT64 and PG9 variants as IgG ligands. Pre.15 is a PG9-like NGS precursor and Pre.7 is a PCT64-like NGS precursor. Both precursors were designed by incorporating an NGS-derived HCDR3 into the corresponding inferred germlines (iGLs). The data were fit using a 1:1 binding model. NB, no binding, is the highest concentration (approximately 10 μM) tested. (D) Alignment of RM IGHD3–41 alleles, human IGHD3–3, and HCDR3 sequences for one inferred germline (iGL.1) and one mature (PCT64.35S) of PCT64. The FWS motif are highlighted in yellow. (E) The frequency of PCT64-like HC sequences in 14 human donors and 60 RMs. Median was plotted across all donors. (F) Alignment of RM IGHD3–15 and HCDR3 sequences for RHA1 (labelled as RHA1.V2.01), two mature PCT64s (PCT64.35S and PCT64.35M) and PGDM1401. The DDY motif are highlighted in cyan. (G) Zoomed-in views of PCT64 (cyan) and RHA1 (red) HCDR3s buried within the ApexGT2 and BG505 DS-SOSIP trimers, respectively. The DDY motifs are shown as sticks. (H) The frequency of Apex bnAb-like heavy chain (HC) sequences (with a DDY motif around the middle of the long HCDR3) in 14 human donors and 60 RMs. Median was plotted across all donors. Source data can be found in Data file S4.
Fig. 2.
Fig. 2.. ApexGT6 adjuvanted-protein immunizations elicited strong Apex epitope-specific responses.
(A) Experimental schematic of ApexGT6 bolus priming in RMs. The trimer cartoon represents protein immunogen (n=6), and the cartoon of nucleotide surrounded with LNP represents mRNA immunogen (n=6). (B) ELISA quantification of ApexGT6 epitope-specific binding serum IgG titers from experimental RMs (n=6) prior to immunization (baseline) and at 10 weeks after first immunization (week 10). dAUC was calculated by AUC (area under the curve) of ApexGT6-binding subtracted by AUC of ApexGT6.KO-binding. Wilcoxon matched-pairs signed rank test, n = 6. *P < 0.05. (C) Summary of week 10 polyclonal plasma IgGs binding to ApexGT6 congly soluble protein trimer detected by nsEMPEM (n=6). (D) Composite figures from nsEMPEM analysis of polyclonal responses at week 10, with animal IDs displayed below each figure. Antibodies are colored according to their targeted epitope clusters, as shown in Fig. 2C (i.e., V1/V2 binders are green, base binders are purple, V5/C3 binders are blue); ApexGT6 congly antigen is represented in gray. (E) ApexGT6++ BGC cells as a percentage of total B cells. Gated on CD20+ CD38 cells. Median and interquartile range are plotted depending on the scale in all figures unless otherwise stated. Dunn’s multiple comparisons test. **P < 0.01. (F) Epitope-specific BGC cells as a percentage of ApexGT6++ BGC cells. Median and interquartile range are plotted depending on the scale in all figures unless otherwise stated. Dunn’s multiple comparisons test. (G) ApexGT6++ Bmem cells as a percentage of total B cells. Gated on CD20+IgD cells. Median and interquartile range are plotted depending on the scale in all figures unless otherwise stated. Dunn’s multiple comparisons test. ***P < 0.001. (H) Epitope-specific Bmem cells as a percentage of ApexGT6++ Bmem cells. Median and interquartile range are plotted depending on the scale in all figures unless otherwise stated. Dunn’s multiple comparisons test. **P < 0.01. Data points represent biological replicate. Source data can be found in Data file S4.
Fig. 3.
Fig. 3.. ApexGT6 adjuvanted-protein immunizations induced Apex bnAb-like precursor responses in all animals.
(A) HCDR3 aa length distribution of BCRs in the lymph node. Lengths ≥ 22 aa are highlighted with a red shadow. (B) Frequency comparison of RM IGHD3–15 (represented in red) among two BCR datasets. Left: epitope-specific GC B cells with long HCDR3s (≥ 24 amino acids) sorted and sequenced from ApexGT6 soluble protein immunized RMs. Right: BCRs with long HCDR3s (≥ 24 amino acids) from a RM naïve BCR dataset (25). (C) The percentages of Apex bnAb-like precursor BCRs among ApexGT6++ GC BCRs increased over time. Each point represents the percentage from a specific RM, colored according to the legend. Medians are indicated by horizontal lines. (D) The percentages of Apex bnAb-like precursor BCRs among ApexGT6++ memory BCRs increased over time. Each point represents the percentage from a specific RM, colored according to the legend in Fig. 3C. Medians are indicated by horizontal lines. (E) Alignment of IGHD3–15 and representative HCDR3 of distinct Apex bnAb-like precursor lineages from the ApexGT6 adjuvanted-protein group. Sequences are aligned based on the HCDR3 length (labeled on the right) and the position of the DDY motif (highlighted in yellow). The sequence names include the animal IDs and timepoints of isolation. Source data can be found in Data file S4.
Fig. 4.
Fig. 4.. membrane-bound ApexGT6 mRNA-LNP induced robust Apex bnAb-like precursor memory responses in all immunized animals.
(A) ELISA quantification of ApexGT6 epitope-specific binding serum IgG titers from experimental RMs (n=6) prior to immunization (baseline) and at 10 weeks after first immunization (week 10). dAUC was calculated by AUC of ApexGT6-binding subtracted by AUC of ApexGT6.KO-binding. Wilcoxon matched-pairs signed rank test, n = 6. *P < 0.05. (B) ELISA quantification of the percentages of ApexGT6-binding serum IgG that are epitope-specific at week 10 of protein and mRNA groups. Medians are indicated by horizontal lines. Mann-Whitney test, compare ranks. **P < 0.01. (C) Composite figures from nsEMPEM analysis of polyclonal responses at week 10, with animal IDs displayed below each figure. Antibodies are colored according to their targeted epitope clusters, as shown in Fig. 2C; ApexGT6–5CC antigen is represented in gray. (D) ApexGT6++ Bmem cells as a percentage of total B cells. Gated on CD20+IgD cells. Median and interquartile range are plotted depending on the scale in all figures unless otherwise stated. Dunn’s multiple comparisons test. **P < 0.01. (E) Epitope-specific Bmem cells as a percentage of ApexGT6++ Bmem cells. (F) Frequency of RM IGHD3–15 (represented in red) among epitope-specific memory BCRs with long HCDR3s (≥ 24 amino acids) sorted and sequenced from ApexGT6 membrane-bound mRNA immunized RMs. (G) Alignment of IGHD3–15 and representative HCDR3 of distinct Apex bnAb-like precursor lineages from the ApexGT6 mRNA-LNP group. Sequences are aligned based on the HCDR3 length (labeled on the right) and the position of the DDY motif (highlighted in yellow). The sequence names include the animal IDs and timepoints of isolation. (H) Comparison of the percentages of Apex bnAb-like precursor BCRs among total Bmem cells at week 10 between mRNA and protein immunizations. Medians are indicated by horizontal lines. Mann-Whitney compare ranks test. ns > 0.05. (I) Comparison of the percentages of ApexGT6++ Bmem among total Bmem cells at week 10 between mRNA and protein immunizations. Medians are indicated by horizontal lines. (J) Comparison of the percentages of Apex bnAb-like precursor BCRs among ApexGT6++ BCRs at week 10 between mRNA and protein immunizations. Medians are indicated by horizontal lines. Mann-Whitney compare ranks test. *P < 0.05. (K) Percentages of BCRs with very long HCDR3s (≥ 26 aa) among epitope-specific BCRs from each immunized macaque. Medians are plotted as bars. Data points represent biological replicate. Source data can be found in Data file S4.
Fig. 5.
Fig. 5.. Induced Apex bnAb-like precursor antibodies gained somatic hypermutation over time and acquired enhanced affinity for native-like Apex.
(A) Somatic hypermutation (SHM) of Apex epitope-specific GC BCRs at sampled timepoints. SHM is calculated by combining the number of mutations on VH and Vκ/λ, then dividing by their combined length. All calculations are based on aa. Thick lines indicate median values, and dash lines indicate 25 and 75% quantiles. (B) SHM of Apex epitope-specific memory BCRs at sampled timepoints. Calculated in the same manner as panel 5A. (C) Comparison of the median values of SHM of Apex bnAb-like precursor memory BCRs from each animal at week 10 between the mRNA and protein groups. Floating bars indicate minimum and maximum, with lines indicating median values. Mann-Whitney compare ranks test. ns > 0.05. (D) SPR affinity measurement of mAbs derived from representative Apex bnAb-like precursor GC BCRs isolated at different timepoints and their inferred germlines (iGLs) binding to ApexGT6 and ApexGT6.KO. Lines indicate median values and 25 and 75% quantiles. Dunn’s multiple comparisons test. *P < 0.05. (E) SPR affinity measurement of mAbs derived from representative Apex bnAb-like precursor GC BCRs with HCDR3 lengths of 22 to 23 aa (labeled as 22 aa GC) or 24 aa and longer (labeled as 24 aa GC), as well as their inferred germlines (labeled as 22 aa iGL and 24 aa iGL, respectively) binding to ApexGT6. Lines indicate median values and 25 and 75% quantiles. Dunn’s multiple comparisons test. ns > 0.05. (F) SPR affinity measurement of mAbs derived from representative Apex bnAb-like precursor memory BCRs isolated from mRNA or protein group at week 10 or week 17 binding to ApexGT6 and ApexGT6.KO. Lines indicate median values and 25 and 75% quantiles. Dunn’s multiple comparisons test. ns > 0.05. (G) Frequency of different V2b loop features on Envs across HIV strains from the Los Alamos database. (H) Frequency of different aa combinations at position 167 and 169 on Envs across HIV strains from the Los Alamos database. (I) SPR affinity measurement of Apex bnAb-like precursor mAbs (iGLs and week 12 GC BCRs from protein group, week 10 memory BCRs from protein and mRNA-LNP groups) binding to ApexGT6-V2b. Lines indicate median values and 25 and 75% quantiles. (J) SPR affinity measurement of Apex bnAb-like precursor mAbs (iGLs and week 12 GC BCRs from protein group, week 10 memory BCRs from protein and mRNA-LNP groups) binding to ApexGT6-DK. Lines indicate median values and 25 and 75% quantiles. Dunn’s multiple comparisons test. ns > 0.05, ***P < 0.001. (K) Cell surface antigenic profile assay for membrane-bound ApexGT6 and its DK and V2b loop variants. DNA-expressed membrane-anchored trimers binding to selected IgGs. Mean-fluorescence intensity (MFI) via fluorescence-activated cell sorting (FACS) binding was normalized to PGT121 binding with error bars representing standard deviation (n = 2). Data points represent technical replicate. All trimers are based on the same design in ref (18). Apex trimers contain mutations described in the text. Source data can be found in Data file S4.
Fig. 6.
Fig. 6.. ApexGT6 induced mAbs possessed structural features similar to PCT64.
(A) Top-down and side views of RM017 (purple) binding at the trimer 3-fold axis of ApexGT6 (grey). Glycans are colored as green spheres. (B) RM017 (right side: heavy chain: dark purple, light chain: light purple) employs an extended HCDR3 for binding at the trimer 3-fold axis of ApexGT6 (white surface), aligned to PCT64 LMCA (left side: heavy chain: blue, light chain: cyan) binding to ApexGT2.2MUT (white surface), but with flipped heavy and light chain. Two liganded structures were aligned using gp120A of each ApexGT trimer. (C) Zoomed-in views of PCT64 LMCA (blue) and RM017 (fuchsia) HCDR3s interact to the center of Apex (white surface), respectively. (D) Zoomed-in views of the DDY motif of PCT64 LMCA (blue sticks) interacting to the 3-fold axis of ApexGT2.2MUT (grey cartoon). T123 and P124 at the 3-fold axis depicted as salmon sticks. (E) Zoomed-in views of the DDY motif of RM017 (purple sticks) interacting to the 3-fold axis of ApexGT6 (grey cartoon). T123 and P124 at the 3-fold axis depicted as salmon sticks. (F) Side view of the VL gene segment of PCT64.LMCA (cyan cartoon) interacting with the N160 glycan (green sticks) on the trimer apex of ApexGT2.2MUT (grey). (G) Side view of the VL gene segment of RM017 (light purple cartoon) interacting with the strand C of the trimer apex of ApexGT6 (grey cartoon). (G) Zoomed-in view shows the hydrophobic pocket (with residues displayed as sticks) formed by HCDR2, the heavy and light chain interface, and the 17-amino-acid LCDR1 of RM017 interacting with the engineered hydrophobic V2b loop (shown as a yellow cartoon, with hydrophobic mutations as sticks).
Fig. 7.
Fig. 7.. ApexGT6 induced mAbs exhibited hybrid structural features of PCT64 and PG9.
(A) Top-down and side views of RM038 (pink) binding at the trimer 3-fold axis of ApexGT6 (grey). Glycans are colored as green spheres. (B) RM038 (right side; heavy chain: fuchsia, light chain: pink) employs an extended HCDR3 for binding at the trimer 3-fold axis of ApexGT6 (white surface), aligned to PCT64 LMCA (left side; heavy chain: blue, light chain: cyan) binding to ApexGT2 (white surface), but with flipped heavy and light chain. Two liganded structures were aligned using gp120A of each ApexGT trimer. (C) Zoomed-in views of PCT64 LMCA (blue) and RM038 (fuchsia) HCDR3s interact to the center of Apex (white surface), respectively. 166–170 residues on the strand C colored as yellow with R166 and R169 shown as green sticks. (D) 90° rotation view of 6C showing the second lobe of RM038 (fuchsia) HCDR3 bind to strand C of ApexGT6, similar to PG9 iGL (orange) binding to ApexGT3. (E) Side view of the HCDR3 of RM038 and strand C (166–170 residues colored as yellow) on gp120A of ApexGT6, illustrating the hybrid features of PCT64 and PG9, with key residues depicted as sticks. (F) Zoomed-in view of the hydrophobic pocket (residues showed as sticks) interactions with the engineered hydrophobic V2b loop (highlighted as yellow cartoon, with hydrophobic mutations depicted as sticks). (G) Acidic SHMs (cyan) on HCDR1 and HCDR2 may enhance binding to the N160 glycans (green).
Fig. 8.
Fig. 8.. ApexGT6 induced mAbs showed similar structural features of CH01–04.
(A) Top-down and side views of RM018 (blue) binding at the trimer 3-fold axis of ApexGT6 (grey). Glycans are colored as green spheres. (B) Zoomed-in view of the hydrophobic pocket (residues showed as sticks) interactions with the engineered hydrophobic V2b loop (highlighted as yellow cartoon, with hydrophobic mutations depicted as sticks). (C) Side view of the HCDR3 of RM018 (blue) and strand C (166–170 residues colored as yellow) on gp120A of ApexGT6, illustrating the CH04-like feature, with key residues depicted as sticks. (D) Side view of the HCDR3 of CH04 (red, PDB:5ESZ) and strand C (166–170 residues colored as yellow) on the V1V2 scaffold, with key residues depicted as sticks. (E) Superimposed liganded structures of RM018 and CH04. The structures were aligned using residues 156–174 on strand C, with ApexGT6 showed as white surface. (F) Side view of the VH gene segment of RM018 (blue cartoon) interacting with the N160 glycan (green sticks) on the trimer apex of ApexGT6 (grey). (G) Side view of the VH gene segment of CH04 (red cartoon) interacting with the N160 glycan (green sticks) on the trimer apex of ApexGT6 (grey).

References

    1. Anklesaria P, Russell ND, Iterative hypothesis testing in HIV vaccine research: moving towards success. J Int AIDS Soc 26, e26102 (2023). - PMC - PubMed
    1. Haynes BF, Wiehe K, Alam SM, Weissman D, Saunders KO, Progress with induction of HIV broadly neutralizing antibodies in the Duke Consortia for HIV/AIDS Vaccine Development. Curr Opin HIV AIDS 18, 300–308 (2023). - PMC - PubMed
    1. Martin TM, Robinson ST, Huang Y, Discovery medicine - the HVTN's iterative approach to developing an HIV-1 broadly neutralizing vaccine. Curr Opin HIV AIDS 18, 290–299 (2023). - PMC - PubMed
    1. Govindan R, Stephenson KE, HIV Vaccine Development at a Crossroads: New B and T Cell Approaches. Vaccines (Basel) 12, (2024). - PMC - PubMed
    1. Xiao X, Chen W, Feng Y, Dimitrov DS, Maturation Pathways of Cross-Reactive HIV-1 Neutralizing Antibodies. Viruses 1, 802–817 (2009). - PMC - PubMed

MeSH terms