

Triglycerides and T Cells in Cardiovascular Risk: Inflammatory Transcriptomic Profile in Hypertriglyceridemia Patients' T Cells
- PMID: 40845480
- PMCID: PMC12398211
- DOI: 10.1016/j.jacbts.2025.101359
Triglycerides and T Cells in Cardiovascular Risk: Inflammatory Transcriptomic Profile in Hypertriglyceridemia Patients' T Cells
Abstract
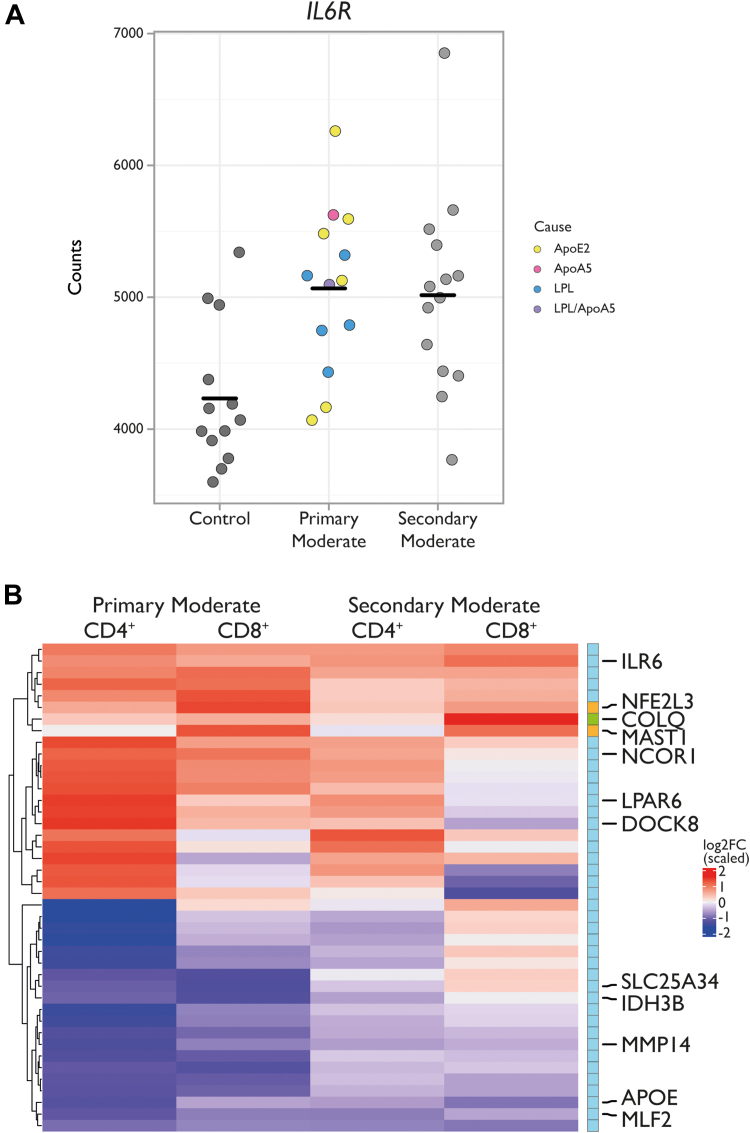
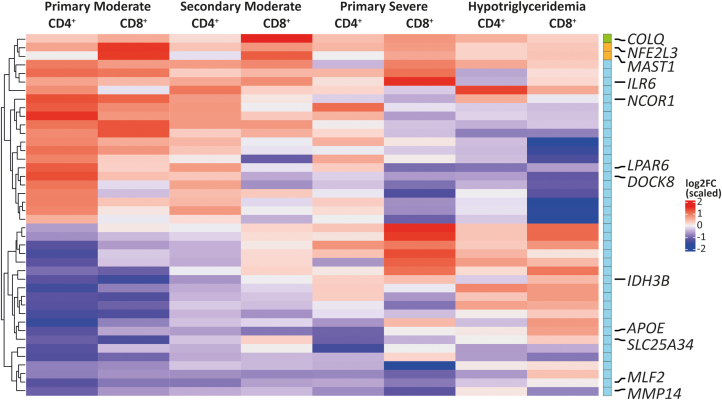
Triglycerides and T cells play a key role in atherosclerosis, the leading cause of cardiovascular disease (CVD). Moderately elevated triglycerides have emerged as a causal risk factor, and T cells are a prominent component of atherosclerotic plaques. This cross-sectional study examined transcriptomic differences in T cells among patients with varying triglyceride levels via RNA sequencing. We analyzed CD4+ and CD8+ T cells from 49 participants, including those with primary (genetic) and secondary moderate hypertriglyceridemia, severe hypertriglyceridemia, and hypotriglyceridemia. Patients with primary moderate hypertriglyceridemia exhibited a proinflammatory transcriptomic profile, including increased interleukin-6 receptor (IL6R) expression, which is implicated in CVD risk. Similar patterns appeared in CD8+ T cells and, to a lesser extent, in secondary moderate hypertriglyceridemia patients. Conversely, transcriptomic differences were reversed in hypotriglyceridemia and absent in severe hypertriglyceridemia patients. These findings suggest that elevated triglycerides may contribute to CVD by promoting a proinflammatory transcriptomic profile in T cells.
Keywords: T cells; atherosclerosis; hypertriglyceridemia; hypotriglyceridemia; transcriptomics; triglycerides.
Copyright © 2025 The Authors. Published by Elsevier Inc. All rights reserved.
Conflict of interest statement
Funding Support and Author Disclosures The authors’ work is supported by the Dutch CardioVascular Alliance (The Dutch Heart Foundation, Dutch Federation of University Medical Centers, the Netherlands Organization for Health Research and Development, and the Royal Netherlands Academy of Sciences) for the GENIUSII project (Generating the Best Evidence-Based Pharmaceutical Targets for Atherosclerosis) (CVON2017-20). Dr Roeters van Lennep’s department has received an investigator-initiated research grant from Novartis. Dr Jukema’s department has received research grants from and/or he was the speaker (with or without lecture fees) on a.o. (CME accredited) meetings sponsored/supported by Abbott, Amarin, Amgen, Athera, Biotronik, Boston Scientific, Dalcor, Daiichi Sankyo, Edwards Lifesciences, GE Healthcare, Johnson and Johnson, Lilly, Medtronic, Merck-Schering-Plough, Novartis, Novo Nordisk, Pfizer, Roche, Sanofi Aventis, Shockwave Medical, the Netherlands Heart Foundation, CardioVascular Research the Netherlands (CVON), the Netherlands Heart Institute, and the European Community Framework KP7 Programme; and has received payments to the institution for participation on a Data Safety Monitoring Board of Tirzepatide programme of Lilly. Dr Heijmans has received scientific support from National Institutes of Health and GlaxoSmithKline; and has received travel support from Epigenomics of Common Diseases 2022 and 2023. All other authors have reported that they have no relationships relevant to the contents of this paper to disclose.
Figures


Similar articles
-
Prescription of Controlled Substances: Benefits and Risks.2025 Jul 6. In: StatPearls [Internet]. Treasure Island (FL): StatPearls Publishing; 2025 Jan–. 2025 Jul 6. In: StatPearls [Internet]. Treasure Island (FL): StatPearls Publishing; 2025 Jan–. PMID: 30726003 Free Books & Documents.
-
Elevated plasma triglycerides increase the risk of psoriasis: a cohort and Mendelian randomization study.Br J Dermatol. 2024 Jul 16;191(2):209-215. doi: 10.1093/bjd/ljae089. Br J Dermatol. 2024. PMID: 38411598
-
Comprehensive single-cell chromatin and transcriptomic profiling of peripheral immune cells in nonsegmental vitiligo.Br J Dermatol. 2025 Jun 20;193(1):115-124. doi: 10.1093/bjd/ljaf041. Br J Dermatol. 2025. PMID: 39888372
-
Smoking cessation for secondary prevention of cardiovascular disease.Cochrane Database Syst Rev. 2022 Aug 8;8(8):CD014936. doi: 10.1002/14651858.CD014936.pub2. Cochrane Database Syst Rev. 2022. PMID: 35938889 Free PMC article.
-
Dietary fibre for the primary prevention of cardiovascular disease.Cochrane Database Syst Rev. 2016 Jan 7;2016(1):CD011472. doi: 10.1002/14651858.CD011472.pub2. Cochrane Database Syst Rev. 2016. PMID: 26758499 Free PMC article.
References
LinkOut - more resources
Full Text Sources
Research Materials
