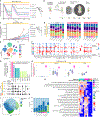
. 2025 Nov 10;43(11):2069-2088.e11.
doi: 10.1016/j.ccell.2025.07.021. Epub 2025 Aug 21.

Genome-wide CRISPR screens identify critical targets to enhance CAR-NK cell antitumor potency

Affiliations

Genome-wide CRISPR screens identify critical targets to enhance CAR-NK cell antitumor potency

Alexander Biederstädt et al. Cancer Cell. .

Abstract

Adoptive cell therapy using engineered natural killer (NK) cells is a promising approach for cancer treatment, with targeted gene editing offering the potential to further enhance their therapeutic efficacy. However, the spectrum of actionable genetic targets to overcome tumor and microenvironment-mediated immunosuppression remains largely unexplored. We performed multiple genome-wide CRISPR screens in primary human NK cells and identified critical checkpoints regulating resistance to immunosuppressive pressures. Ablation of MED12, ARIH2, and CCNC significantly improved NK cell antitumor activity against multiple treatment-refractory human cancers in vitro and in vivo. CRISPR editing augmented both innate and CAR-mediated NK cell function, associated with enhanced metabolic fitness, increased secretion of proinflammatory cytokines, and expansion of cytotoxic NK cell subsets. Through high-content genome-wide CRISPR screening in NK cells, this study reveals critical regulators of NK cell function and provides a valuable resource for engineering next-generation NK cell therapies with improved efficacy against cancer.

Keywords: CAR-NK cell therapy; adoptive cell therapy; functional perturbomics; genome-wide CRISPR screens; metabolic reprogramming; multiplexed cellular engineering; natural killer cells; precision gene editing; solid tumors; tumor microenvironment.


Conflict of interest statement

Declaration of interests R.B., N.U., May Daher., H.R., P.B., S.A., M.S., Paul Lin., Y.L., E.L., E.J.S., K.R., and The University of Texas MD Anderson Cancer Center have an institutional financial conflict of interest with Takeda Pharmaceuticals. R.B., S.A., E.L., E.J.S., K.R. and The University of Texas MD Anderson Cancer Center have an institutional financial conflict of interest with Affimed. K.R. participates on the Scientific Advisory Board for Avenge Bio, Virogin Biotech, Navan Technologies, Caribou Biosciences, Bit Bio Limited, Replay Holdings, oNKo Innate, The Alliance for Cancer Gene Therapy ACGT, Innate Pharma and Shinobi Therapeutics. K.R. is the scientific founder of Syena. May Daher participates on the Scientific Advisory Board of Cellsbin. E.J.S. participates on the Scientific Advisory Board for Adaptimmune Limited, Axio Research, Celaid Therapeutics, FibroBiologics, Navan Technologies, New York Blood Center, and Zelluna Immunotherapy. The remaining authors declare no competing interests.

Figures
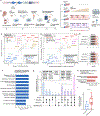
Figure 1.
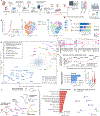
Figure 1.. Pooled CRISPR screening in primary human NK cells enables massively parallel interrogation of genomic perturbations.
(A) Conceptual of the sgRNA transfer plasmid used for retroviral library delivery (See also Figure S1). (B) Schematic representing the gene editing pipeline for pooled CRISPR screening in primary human NK cells employed for the four targeted CRISPR knockout (KO) screens using a transcription factor (TF) sgRNA library. (C and D) TF library CRISPR screens (targeting 1,632 genes with 11,364 unique sgRNAs) in primary human NK cells (n=2 human CB donors) revealed shared and context-specific genes governing transcriptional regulation associated with NK cell function including under feeder cell-enabled high-fold in vitro expansion (C) and repeated pancreatic tumor challenge (D). Depicted are z-transformed log2 fold changes (LFC ZS) comparing relative sgRNA abundance at T12 vs. T0 across indicated screening conditions for both donors. Significantly enriched (FDR<0.05, LFC ZS>|1.5|) and depleted (FDR<0.05, LFC ZS>|3|) non-essential genes are labeled; color-coding indicates shared and screen-exclusive hits (See also Figure S1). (E) Enrichment of individual sgRNAs targeting PRDM1 and RUNX3 depicted as log2 fold changes (FC) (T12/T0) across four CRISPR screen conditions (n=2 human NK cell donors). (F) Shown are the top 10 enriched Reactome pathways among significantly depleted non-essential genes (FDR<0.05, LFC |ZS|>3) delineating functional programs indispensable for NK cell survival and fitness. Essential genes specific for NK cells were determined by adjusting screen dropouts for inferred common essential genes (DepMap, Broad 24Q2 Public Dataset). (G) Overlap analysis (Upset plot) of top 50 most highly enriched TFs across investigated selective pressures. Bar height represents the number of overlaps; the bottom panel indicates the overlapping screening conditions. Identified targets with 3 and 4 overlaps are labeled; top hits (LFC ZS >1.5) are indicated in bold. Significant screen hits without intersections are omitted (See also Figure S1). (H) Enriched Reactome pathways among significantly enriched TF screen hits (FDR<0.05; |ZS|>1.5). (I) Interrogation of single cell transcriptomes of tumor-infiltrating and circulating peripheral blood (PB)-NK cells from patients with pancreatic cancer (n=16) compared to healthy donor controls (n=5) investigating a gene signature comprising the top two overlapping screen hits (PRDM1, RUNX3). Data represented as box-and-whiskers plots; box limits represent quartiles (IQR), whiskers indicate minimum and maximum values, the horizontal solid line represents the median; *p< 0.05; Mann Whitney U Test). Also see Figure S1 and Table S1.
Figure 2.
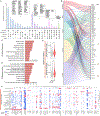
Figure 2.. Genome-wide CRISPR screens in primary human NK cells decipher modulators mediating enhanced antitumor potency under repeated tumor challenge.
(A) Schematic of high-content genome-wide CRISPR screens to identify regulators of NK cell functional resilience under repeated tumor pressure (See also Figure S2). (B) NK cell:Capan-1 pancreatic cancer xCELLigence in vitro killing assay (E:T=1:1) assessing NK cell antitumor potency after two rounds of Capan-1 tumor challenge (NK + 3x PDAC; red) compared to PDAC-naïve controls (NK + 1x PDAC; light green); shown is the mean normalized tumor growth of n=2 independent human NK cell donors. Error bars (SD) are represented as shaded area (p value computed using ratio paired t test of the reciprocal of the area under the tumor growth curve; **p< 0.01; see also Figure S2B for AUC statistics). (C and D) Optimized t-Distributed Stochastic Neighbor Embedding (opt-SNE) plots depicting NK single cell projections before (NK only; blue) and after one (NK + 1x PDAC; green) or three (NK + 3x PDAC; red) rounds of Capan-1 pancreatic cancer (PDAC) challenge (E:T=1:1) (C), and overlaid with FlowSOM metaclusters (D), as assessed by spectral flow cytometry; n=2 CB donors (See also Figures S2C–S2E). (E) Bar chart depicting the changes in relative cluster composition across the different experimental groups (n=2 human NK cell donors). (F) Heatmap of z-transformed median surface marker expression (indicated by color) and percentage expression (indicated by circle size) for metaclusters. Columns are clustered using 1-Pearson correlation distance and average linkage. (G) Genome-wide CRISPR screens in primary human NK cells (n=2 donors) identifying positive (FDR<0.05; LFC |ZS|>1.5) and negative (FDR<0.05; LFC |ZS|>5) regulators of NK cell fitness under repeated pancreatic cancer challenge. Hits color-coded by molecular function and cellular localization (See also Figure S2). (H) Integrated analysis of the genome-wide NK cell degranulation and NK:Capan-1 re-challenge screens reveals recovery of the majority of screen hits (FDR<0.05) identified in the NK cell re-challenge screen among top enriched genes (≥95th quantile LFC ZS) in the NK cell degranulation screens. (I) Reactome pathway analysis of significantly depleted non-essential genes (FDR<0.05; LFC ZS>|3|). (J) Single-cell transcriptomic data of tumor-infiltrating and peripheral blood (PB)-NK cells in pancreatic cancer (n=16) and across 19 cancer types (n=217), evaluating a gene signature comprising the top 5 hits compared to healthy controls (n=5). Data represented as box-and-whiskers plots; box limits represent quartiles (IQR), whiskers indicate minimum and maximum values, horizontal solid line represents the median; p values computed using Mann-Whitney U test; *p<0.05 (See also Figure S2S and S2T). (K) Genome-wide screens in primary human NK cells independently identified multiple components of integral cellular regulatory nodes as projected by protein-protein interaction mapping of screen hits (FDR<0.05) by STRING database. (L) Gene ontology (GO) term analysis of positive hits (FDR<0.05, LFC ZS>1.5) delineates cellular localization and functional context (See also Figures S2W and S2X). (M) Top enriched hits (rank≤50) were analyzed using TRANSFAC and JASPAR databases to identify TF binding motifs and infer regulatory networks with shared binding to promoter regions of identified screen hits. Also see Figure S2 and Table S2.
Figure 3.
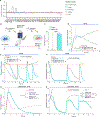
Figure 3.. Genome-wide CRISPR screens in primary human NK cells identify targets shielding NK cells from immunosuppressive pressures in the TME.
(A) Schematic portraying the immunosuppressive pressures encountered by tumor-infiltrating NK cells in the TME. (B) Conceptual depicting the genome-wide CRISPR screen pipeline to systematically identify immunosuppressive resistance targets. (C) Expanding primary human NK cells in the presence of transforming growth factor β1 (TGFβ1; 500ng/mL), L(+) lactic acid (5mM) or hypoxic stress (1% O2) severely blunts NK cell proliferation compared to metabolite-free controls (data presented as fold change expansion, T19 NK cell counts normalized to T13; mean±SD of n=2 human NK cell donors; **p<0.01, ****p<0.0001; one-way ANOVA followed by Dunnett’s test) (See also Figure S3B). (D) NK cell cytotoxicity as assessed by Incucyte® in vitro killing assays against K562 targets ± different immunosuppressive pressures including transforming growth factor β1 (TGFβ1; 100ng/mL), L(+) lactic acid (7.5mM) or previous expansion under hypoxic conditions (1% O2). (n=2 human NK cell donors; mean (line) ±SD (shaded in grey); p values computed for the normalized NK cell killing capacity as assessed by one minus scaled area under the tumor growth curve using one-way ANOVA; *p<0.05, **p<0.01; K562 killing for metabolite-challenged NK cells was normalized to NK cell killing under normal conditions; see also Figures S3C–S3F). (E, F and G) Enriched NK cell regulators and depleted non-essential genes across multiple immunosuppressive pressure screens (500ng/mL TGFβ1, 5mM L(+) lactic acid and 4% hypoxia) and the NK:Capan-1 re-challenge screens. Shown are z-transformed log2 fold changes (LFC ZS) of relative guide abundance at T14 vs T0. Significantly enriched top hits (FDR<0.05, LFC ZS>|2|) and depleted non-essential gene programs (FDR<0.05, LFC ZS>|5|) are labeled and color-coded according to their overlap/exclusivity across indicated screen conditions. Shared hits between the genome-wide TME immunosuppression screens and the Capan-1 re-challenge screens are indicated in bold (n=2 independent human NK cell donors). Also see Figure S3.
Figure 4.
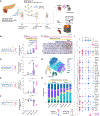
Figure 4.. Integrated analysis reveals shared targets shielding NK cell from diverse clinically relevant pressures.
(A) Top shared screen hits (rank≤100) across 5 genome-wide CRISPR KO screens in primary human NK cells with 2 (blue), 3 (purple), 4 (pink) and 5 (green) overlaps. Bar height represents the number of shared targets across screens indicated by dots in the lower panel. Enriched genes with LFC ZS>2 in all screens labeled in bold. Significant screen hits without intersections are omitted (n=2 human CB donors). (B) Shared NK cell targets modulating resistance against multiple selective pressures including pancreatic cancer re-challenge (NK:Capan-1), TME-induced immunosuppression (TGFβ1, hypoxia, lactic acid) and ex vivo feeder cell-enabled high-fold expansion (NK:uAPC). (C and D) Cellular localization and functional annotation of shared top hits (Rank≤100, ≥2 overlaps) by gene ontology (GO) term analysis. (E) Expression of significantly enriched targets (FDR<0.05; LFC |ZS|>1.5) from the genome-wide CRISPR tumor re-challenge screen (top) and overlapping screen hits (rank<100; ≥4 overlaps; bottom) in bone marrow-isolated primary human NK cells from patients with AML and healthy controls (n=8 healthy human NK cell donors and n=8 donors with AML; ****p<0.0001; Mann-Whitney U test). (F) Heatmap depicting the z-transformed relative expression of overlapping enriched screen hits (rank<100; ≥2 overlaps across 5 genome-wide CRISPR screens in primary human NK cells) in tumor-infiltrating NK cells (TiNKs) across 17 cancer types compared to healthy donor peripheral blood (PB) NK cells as surveyed by scRNA-seq data. Healthy donor (n=5); CLL, chronic lymphocytic leukemia (n=1); esophageal cancer (n=11); ALL, acute lymphocytic leukemia (n=2); HNSCC, head and neck squamous cell carcinoma (n=33); colorectal cancer (n=15); HCC, hepatocellular carcinoma n=8); BC, breast cancer (n=39); RCC, renal cell carcinoma (n=27); lung cancer (n=54); melanoma (n=10); pancreatic cancer (n=18); gastric cancer (n=10); thyroid cancer (n=9); multiple myeloma (n=8); NPC, nasopharyngeal carcinoma (n=10); ovarian cancer (n=2); prostate cancer (n=1). Color and circle size indicate z-transformed pseudobulk expression per gene. Also see Figure S5.
Figure 5.
Figure 5.. MED12 ablation confers exhaustion resistance and tunes NK cells for enhanced antitumor function.
(A) Mediator complex essentiality signature showing mean log2 fold-change (±SD) in sgRNA abundance from genome-wide NK cell Capan-1 re-challenge screens (n=2 CB donors). Functional domains are color-coded. (B) Schematic depicting the CRISPR-RNP-mediated disruption of the Mediator complex kinase module (CKM). (C) MED12 editing efficiency in CRISPR-RNP-edited NK cells measured by indel frequency (Tracking of Indels by DEcomposition [TIDE]; n=6 CB donors; ****p<0.0001, paired t-test) compared to mock controls. (D) NK cell killing of PATC148 pancreatic cancer cells upon MED12 deletion assessed by xCELLigence assay (n=3 CB donors; mean normalized PATC148 tumor growth ±SD (shaded in grey); **p<0.01 for the reciprocal of the scaled area under the tumor growth curve for corresponding donors, unpaired t-test; AUC summary statistics in Figure S7A). (E and F) Incucyte® killing assay of MED12-ablated NK cells, repeatedly challenged with MM1S multiple myeloma cells (E) or MOLM-14 acute myeloid leukemia cells (F). Data depicted as mean normalized tumor growth ±SD (shaded in grey) (n=2 CB donors; *p<0.05; unpaired t-test of the reciprocal of the scaled area under the tumor growth curve; AUC summary statistics shown in Figures S7B and S7C) (G and H) Antigen-specific cytotoxicity of MED12-ablated CAR-NK cells targeting TROP2 and CD70, assessed by xCELLigence (PATC148; n=1 donor) and Incucyte (THP-1; n=2 donors) assays. Data depicted as mean normalized tumor growth ±SD (shaded in grey; *p<0.05; unpaired t-test of the reciprocal scaled area under the tumor growth curve; AUC and CAR constructs in Figures S7D–S7F). Also see Figure S7.
Figure 6.
Figure 6.. Multiplexed ARIH2/CCNC editing augments CAR-NK cell metabolic fitness and enhances tumor clearance.
(A) Western blot analysis of ARIH2, CCNC, and beta-Actin in CRISPR-edited NT-NK and CAR-NK cells (TROP2CAR/IL-15 or CD27CAR/IL-15; n=2 human CB donors; see also Figures S7G–S7I). (B) In vitro PATC148 re-challenge assay of ARIH2 and CCNC-deficient NK cells (xCELLigence; E:T=4:1; n=1 human CB donor; AUC shown in Figure S7J). (C) In vitro tumor killing assay of ARIH2 and CCNC-deficient NK cells co-cultured with Karpas-299 human T cell non-Hodgkin’s lymphoma cells as assessed by Incucyte® (E:T=2:1; n=1 human CB donor; AUC shown in Figure S7K). (D) In vitro killing assays of ARIH2, CCNC and ARIH2/CCNC dual KO NK cells co-cultured with CFPAC human pancreatic cancer cells (E:T=1:1), OVCAR5 human gastrointestinal cancer cells (E:T=4:1) and PATC148 human pancreatic cancer cells (E:T=4:1) as assessed by xCELLigence real-time cell analysis. Dashed lines indicate non-transduced NK cells; solid lines represent NK cells expressing a TROP2CAR/IL-15; color coding denotes CRISPR perturbations versus wildtype (WT) controls. Data represented as mean±SEM (SEM shaded in light grey) for n=2 human NK cell donors (CFPAC, OVCAR5, WiDr) and n=3 (PATC148); AUC summary statistics shown in Figure S7N) (E) In vitro killing assays of ARIH2, CCNC and ARIH2/CCNC dual KO NK cells co-cultured with WiDr human colorectal cancer cells (E:T=1:1) as assessed by xCELLigence real-time cell analysis. Dashed lines indicate non-transduced NK cells; solid lines represent NK cells expressing a CD70-directed natural ligand CD27 CAR molecule with IL-15 armoring; color coding denotes CRISPR perturbations versus wildtype (WT) controls. (n=2 human CB donors; data represented as mean±SEM (shaded in light grey); AUC summary statistics shown in Figure S7N, right). (F and G) Representative images (F) and killing kinetics (G) of 3D spheroid killing assays of CRISPR-perturbed TROP2CAR/IL-15-NK cells co-cultured with BCX010 and PATC148 cancer spheroids as assessed by Incucyte® live cell imaging. Effector-to-target (E:T) ratios were 3:1 (BCX010) and 1.25:1 (PATC148); data presented as mean normalized tumor growth ±SEM (tumor only, red; WT, grey; ARIH2 KO, blue; CCNC KO purple; ARIH2/CCNC DKO, pink; NT-NK conditions, dashed lines; CAR-NK conditions, solid lines; SEM shaded in light grey) (G); n=3 human NK cell donors (see also Figure S7Q). (H and J) Representative oxygen consumption rate (OCR) trace of ARIH2, CCNC and ARIH2/CCNC KO NT-NK (H) and TROP2CAR/IL-15-NK cells (J) under resting and challenge conditions as assessed by Seahorse analysis. Addition of oligomycin, carbonyl cyanide-4 (trifluoromethoxy) phenylhydrazone (FCCP) and rotenone + antimycin A (R + A) is indicated by arrows (n = 2 human NK cell donors in 4 replicates; mean±SD; OCR traces are representative results from two independent human NK cell donors). (I and K) Basal, maximum and spare normalized oxygen consumption rate (OCR) of ARIH2, CCNC and ARIH2/CCNC KO NT-NK (I) and TROP2CAR/IL-15-NK cells (K) (n = 2 donors; 4 technical replicates; symbol shapes indicate independent biological NK cell donors; normalized to maximum metabolic rate). Data represented as box-and-whiskers plot; box limits represent quartiles, whiskers indicate minimum and maximum values, the horizontal solid line represents the median OCR. (Two-way ANOVA corrected for multiple comparisons by Tukey test; ns, not significant; **p< 0.01, ****p < 0.0001). (L, M and N) High-dimensional phenotypic characterization of CRISPR-edited NK cells as assessed by mass cytometry, see also Figure S8A. (L) Opt-SNE map of CRISPR-perturbed primary human NK cells before and after PATC148 tumor co-culture, overlayed with FlowSOM clusters. (M and N) Contour plots indicating single cell projections for NT-NK vs. TROP2CAR/IL-15-NK cells (M) before or after challenge with PATC148 pancreatic cancer cells (N). (O and P) Bar charts depicting FlowSOM cluster composition in primary human NT-NK and TROP2CAR/IL-15-NK cells upon ablation of ARIH2, CCNC and ARIH2/CCNC before (O) and after (P) PATC148 challenge (FlowSOM clusters: (1) green, (2) cyan, (3) light blue, (4) purple, (5) rose, (6) magenta; see also Figures S8B – C). (Q) Heatmap indicating z-transformed median expression per channel and percentage marker expression of gene-edited NK cells across FlowSOM clusters. Also see Figures S7 and S8.
Figure 7.
Figure 7.. Multiplexed CRISPR editing boosts CAR-NK cell potency in vivo.
(A) Schematic depicting an in vivo study assessing antitumor efficacy of ARIH2 KO, CCNC KO and ARIH2/CCNC DKO TROP2CAR/IL-15-NK cells in an orthotopic pancreatic cancer mouse model (n=5 NSG mice per condition; see also Figures S9A–S9D). (B) Flow cytometry-based analysis of CRISPR-edited TROP2CAR/IL-15-NK cells circulating in the peripheral blood on d10 post injection. Data represented as truncated violin plots (bold line represents median, dashed lines represents interquartile range; symbols represent number of mice per group; plots truncated at minimum and maximum values); one-way ANOVA; ns, not significant; ***p < 0.001. (C, D, E and F) Immunohistochemical (IHC) analysis of NK cell tumor infiltration (C and D), assessed by hCD45 positive cells, intratumoral Granzyme B staining (C and E) and assessment of hematoxylin positive, hCD45 negative tumor cells (F); data represented as truncated violin plots (bold line, median; dashed lines, interquartile range; symbols, number of mice per group; plots truncated at minimum and maximum values); one-way ANOVA; ns, not significant; *p < 0.05, ****p < 0.0001. (C) Representative IHC image of an orthotopic tumor specimen stained for hCD45 (top) and Granzyme B (bottom). (G) Mass cytometry-enabled phenotypic profiling of gene-edited NK cells represented as Opt-SNE map overlaid with FlowSOM metaclusters (See also Figures S9E–S9G). (H) Bar chart depicting the alterations in FlowSOM cluster composition induced by targeted ARIH2, CCNC and ARIH2/CCNC editing in TROP2CAR/IL-15-NK cells derived from i.p. fluid and spleens from an orthotopic murine model of human pancreatic cancer (FlowSOM clusters: (1) dark blue, (2) violet, (3) purple, (4) light green, (5) beige, (6) cyan, (7) dark green; see also Figures S9E–S9G). (I) Heatmap depicting the relative and percentage marker expression per FlowSOM metacluster. Color indicates z score-normalized median expression per channel, circle size indicates percentage expression. Also see Figure S9.
Figure 8.
Figure 8.. ARIH2 and CCNC KO synergize to augment NK cell proliferation, activation, interleukin signaling and interferon gamma response.
(A) In vitro tumor re-challenge assay of CRISPR-edited NK cells deficient for ARIH2, CCNC, ARIH2/CCNC, CISH, or MED12, co-cultured with PATC148 human pancreatic cancer cells as assessed by xCELLigence real-time cell analysis. Data represented as mean±SEM (shaded in light grey); NK cell killing normalized to timepoint 0 and tumor. (E:T=6:1; n=2 human NK cell donors; one-way ANOVA for area under the PATC148 growth curve; **p< 0.01, ***p<0.001, ****p < 0.0001) (See also Figures S10A and S10B). (B and C) Conceptual depicting the orthotopic pancreatic cancer mouse model to assess the in vivo antitumor efficacy of CRISPR-engineered TROP2CAR/IL-15-NK cells. (D) PATC148 tumor growth (mean bioluminescent radiance) in orthotopic pancreatic cancer-bearing mice infused with ARIH2 KO, CCNC KO, ARIH2/CCNC DKO, CISH KO or MED12 KO TROP2CAR/IL-15-NK cells (n=4 per condition; one-way ANOVA for day 35 mean radiance (ns, not significant, *p<0.05, **p<0.01). (See also Figures S10C and S10D) (D, E and F) Deep phenotypic profiling of gene-edited TROP2CAR/IL-15-NK cells by mass cytometry. (D) Opt-SNE projection of CRISPR-edited NK cells at baseline and after one and two PATC148 tumor challenges, overlayed with FlowSOM metaclusters. (E) Bar charts depicting dynamic regulation of NK cells clusters in CRISPR-edited TROP2CAR/IL-15-NK cells at baseline (left) and after one (middle) and two (right) challenges with PATC148 pancreatic cancer cells. (F) Heatmap depicting z-transformed median expression per channel and percentage surface marker expression of CRISPR-perturbed NK cells across FlowSOM metaclusters. (G) UpSet plot showing the number of independent experiments, demonstrating cooperative protein induction for NK cell activating markers in ARIH2/CCNC DKO CAR-NK cells compared to expected additive effects from ARIH2 or CCNC single KOs (pseudo-Loewe sum analysis; n=7 CB donors). (H) Bar charts depicting median expression of CD25, NKG2D, Ki67 and CD69 by infused CRISPR-KO TROP2CAR/IL-15-NK cells harvested from the i.p. fluid of tumor-bearing (PATC148) mice, as assessed by mass cytometry (n=4 per condition; grey, WT control; blue, ARIH2 KO; purple, CCNC KO; pink, ARIH2/CCNC DKO). (I, J, and K) scRNA-seq studies of CRISPR-edited NK cells deficient for ARIH2, CCNC, ARIH2/CCNC, CISH, or MED12, co-cultured with PATC148 cells. (I) UMAP projection of gene-edited NK cells, overlayed with Seurat clusters. (J) Bar charts depicting Seurat NK cell cluster composition in CRISPR-edited TROP2CAR/IL-15-NK cells after tumor challenge. (K) Heatmap depicting significantly enriched pathways in CRISPR-edited CAR-NK cells compared to non-edited controls. Top annotation bars indicate experimental conditions and corresponding Seurat-defined NK cell clusters. Also see Figure S10.

References

    1. Liu E, Marin D, Banerjee P, Macapinlac HA, Thompson P, Basar R, Nassif Kerbauy L, Overman B, Thall P, Kaplan M, et al. (2020). Use of CAR-Transduced Natural Killer Cells in CD19-Positive Lymphoid Tumors. N Engl J Med 382, 545–553. 10.1056/NEJMoa1910607. - DOI - PMC - PubMed
    1. Marin D, Li Y, Basar R, Rafei H, Daher M, Dou J, Mohanty V, Dede M, Nieto Y, Uprety N, et al. (2024). Safety, efficacy and determinants of response of allogeneic CD19-specific CAR-NK cells in CD19(+) B cell tumors: a phase 1/2 trial. Nat Med 30, 772–784. 10.1038/s41591-023-02785-8. - DOI - PMC - PubMed
    1. Liu E, Tong Y, Dotti G, Shaim H, Savoldo B, Mukherjee M, Orange J, Wan X, Lu X, Reynolds A, et al. (2018). Cord blood NK cells engineered to express IL-15 and a CD19-targeted CAR show long-term persistence and potent antitumor activity. Leukemia 32, 520–531. 10.1038/leu.2017.226. - DOI - PMC - PubMed
    1. Li Y, Hermanson DL, Moriarity BS, and Kaufman DS (2018). Human iPSC-Derived Natural Killer Cells Engineered with Chimeric Antigen Receptors Enhance Anti-tumor Activity. Cell Stem Cell 23, 181–192.e185. 10.1016/j.stem.2018.06.002. - DOI - PMC - PubMed
    1. Li L, Mohanty V, Dou J, Huang Y, Banerjee PP, Miao Q, Lohr JG, Vijaykumar T, Frede J, Knoechel B, et al. (2023). Loss of metabolic fitness drives tumor resistance after CAR-NK cell therapy and can be overcome by cytokine engineering. Sci Adv 9, eadd6997. 10.1126/sciadv.add6997. - DOI - PMC - PubMed

MeSH terms

Substances

LinkOut - more resources