Observational Study
. 2025 Sep;13(9):e1591-e1604.
doi: 10.1016/S2214-109X(25)00236-0.

Evidence-based decision making for malaria elimination applying the Freedom From Infection statistical framework in five malaria eliminating countries: an observational study

Affiliations
Observational Study

Evidence-based decision making for malaria elimination applying the Freedom From Infection statistical framework in five malaria eliminating countries: an observational study

Gillian Stresman et al. Lancet Glob Health. 2025 Sep.

Abstract

Background: Routine surveillance is a pillar of malaria programmes, and the primary source of data used for decision making. However, any inference when relying on routine data to inform decision making is limited by how effective the system is at measuring the actual malaria burden. Here, we aimed to extend the Freedom From Infection (FFI) framework to produce species-specific estimates of surveillance system sensitivity and probability of freedom from malaria, combine multiple surveillance components including community case management and active case detection, and apply the FFI model in five malaria eliminating settings.

Methods: Monthly routine data on Plasmodium falciparum and Plasmodium vivax and health system factors were collected from 1515 facilities across five countries. Additionally, data from 12 community health workers and from 10 767 individuals from cross-sectional surveys (active case detection) were available. The data were analysed using FFI models accounting for multiple malaria species and surveillance components. The primary outcomes were the sensitivity of the surveillance system and the probability of malaria freedom.

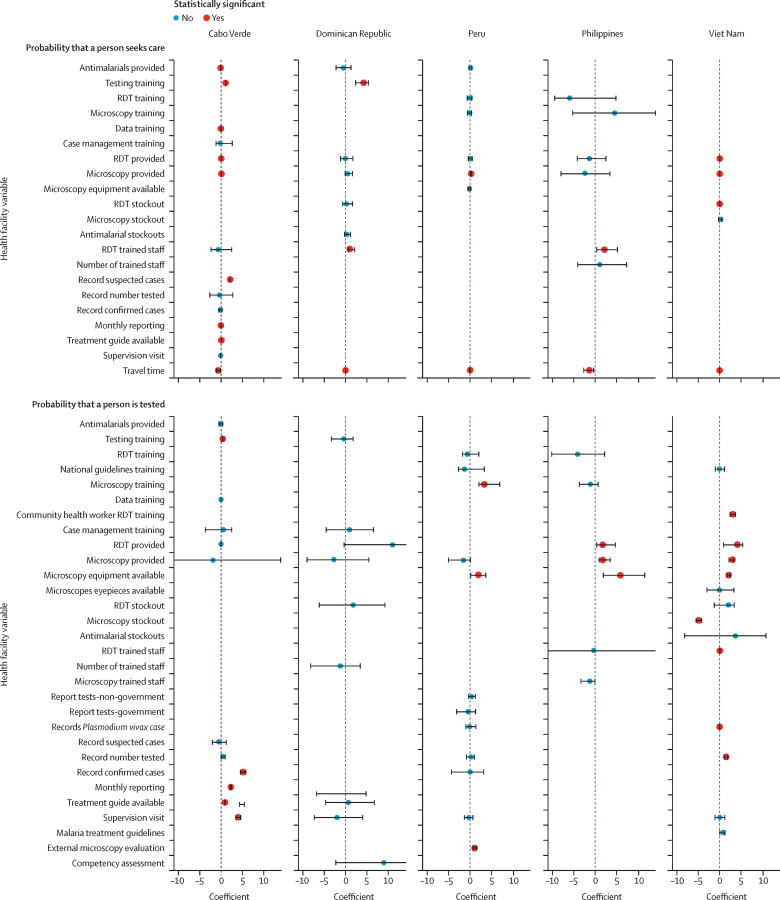
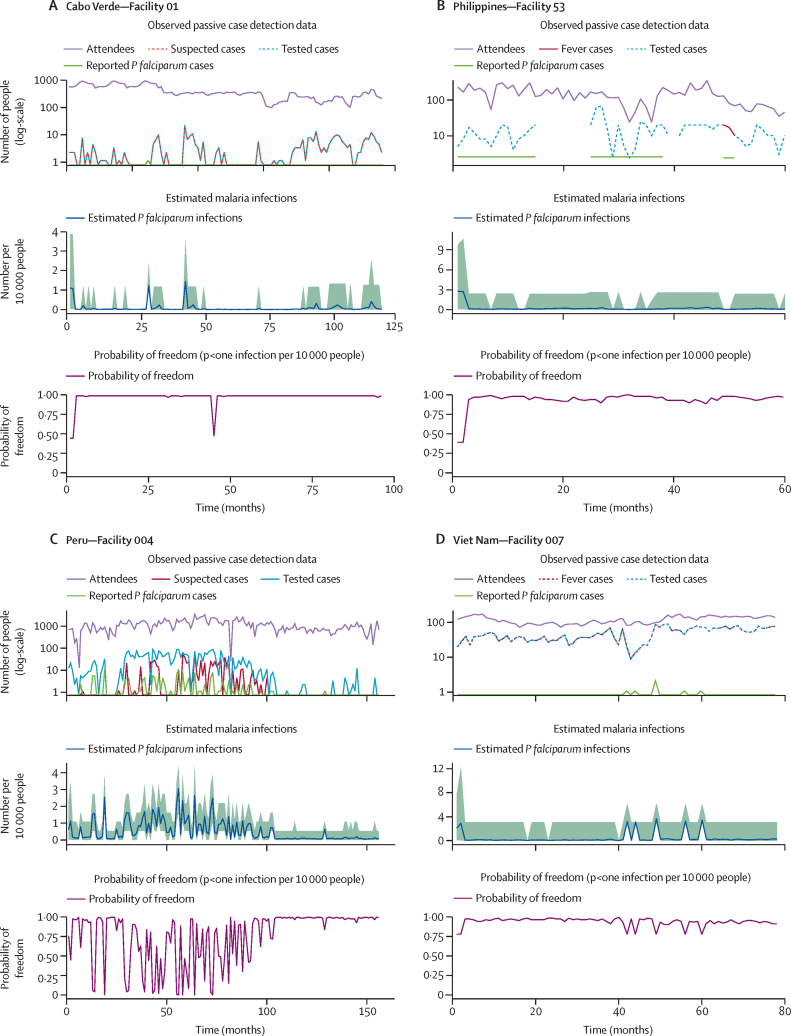
Findings: Strong surveillance systems were characterised by access to testing and treatment supplies, training on diagnostics and case management within the previous 12 months, and shorter estimated travel times to facilities. Only half of the facilities (841 of 1515 facilities for P falciparum and 771 of 1455 facilities for P vivax) had sufficient sensitivity to achieve and maintain a high probability of freedom, consistent with having achieved malaria elimination, with either passive case detection data alone or when combined with active case detection.

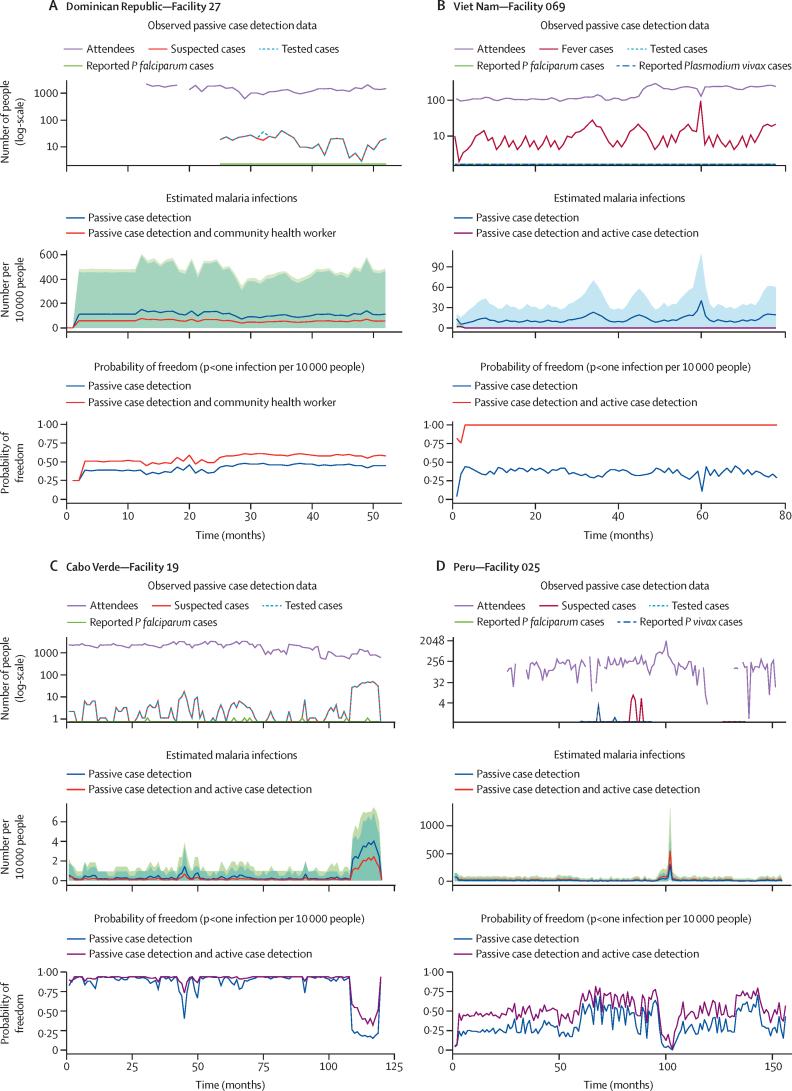
Interpretation: Applying the FFI model framework to malaria surveillance data can provide programmes with information to support decision making, specific to malaria species. When routine malaria surveillance systems are strong, they are sufficient to achieve and maintain a high probability of freedom. Including additional surveillance components such as community case management and active case detection with multiple diagnostic tools can help improve estimates for which routine malaria data alone are not sufficient to ensure confidence in elimination.

Funding: The Bill and Melinda Gates Foundation, the Global Institute for Disease Elimination, and the Carter Center.


Conflict of interest statement

Declaration of interests We declare no competing interests.

Figures

Figure 1
Figure 1
Results of models to estimate the probability of seeking care and the probability that a person is tested for malaria Results of the models per country are shown in the columns. The specific variables included in the models are listed on the y axis with the corresponding coefficient value on the x axis. The estimated coefficient value (point) and associated 95% credible interval (black horizontal lines) are shown per variable. Red and blue coloured points represent the variables that were and were not statistically significant (p<0·05), respectively. The extreme values of select credible intervals for some values for the probability that a person is tested for malaria were cut off and included as text annotation for visualisation purposes. RDT=rapid diagnostic test.
Figure 2
Figure 2
Examples of surveillance system sensitivity results and the corresponding probability of freedom for Plasmodium falciparum elimination in selected facilities For each country, the top plot shows the raw data collected at each health facility over the study period. The purple line represents the number of people attending the facility, the red dotted line denotes the number of people with suspected malaria, the blue dotted line shows the number of people tested for malaria, and the green line provides the number of reported P falciparum malaria cases reported. The middle plot shows the estimated number of cases in the community that could be present, that the surveillance system should be sufficiently sensitive enough to detect if they exist. This is represented by the blue line: the expected number of cases reflects the ability of the surveillance system to detect infections and is not a prediction of malaria trends in the community. The shaded green area reflects the 95% credible interval around the estimated number of malaria cases per month. The bottom plot for each facility shows the probability of achieving malaria freedom, defined as there being fewer than one case per 10 000 people in the population: when the estimated probability of freedom is 0·95 or higher and zero cases are reported at a health facility, this provides strong evidence of having achieved malaria elimination. The highlighted facilities show that routine malaria surveillance systems alone can achieve and maintain a high probability of freedom if the system capacity and data availability are good.
Figure 3
Figure 3
Examples of surveillance system sensitivity results and the corresponding probability of freedom for Plasmodium falciparum elimination in selected facilities where active case detection was conducted to supplement information from routine malaria surveillance Results show the different ways to use data collected as part of active case detection to supplement the model and boost the surveillance system and probability of freedom estimates. For each example from a specific facility, the top graph shows the monthly routine malaria surveillance data with the middle showing the estimated surveillance system, and the bottom graph showing the estimated probability of freedom over the observation period. In this case, the second and third plots show the results for two different scenarios: estimates based on the passive case detection data alone and the estimates when the passive case detection and active case detection data are combined. The routine malaria data (top plot) include the number of people attending the facility (purple line), the number of suspected malaria cases (red line), the number of people tested for malaria (blue dotted line), and the number of reported Plasmodium falciparum cases (green line). Next, the middle plot shows the results of the estimated number of malaria infections for passive case detection data alone (blue dashed line and blue shaded area depicting the 95% credible interval) and when passive case detection and active case detection data are combined (purple dashed line and greed shaded area for the 95% credible interval). The probability of freedom estimates (bottom plot) are shown for passive case detection data only (blue line) and for passive case detection and active case detection data combined (red line). Different types of active case detection tailored to the epidemiology of each country are shown. (A) Depicts a facility in the Dominican Republic where data from community health workers where populations are screened for malaria monthly improve the overall surveillance system and the probability of freedom. (B) Results are from a health facility in Viet Nam where the active case detection data consist of a household cross-sectional survey using measures of recent (ie, within the previous 12 months) and historical malaria exposure. (C) A facility in Cabo Verde showing the effect of conducting risk-targeted sampling whereby the sample was designed to oversample people who had visited the African continent within the previous 30 days, a population that is 3 times more likely to have malaria exposure compared with non-travellers, strengthening the inference possible in confirming elimination. (D) The example of the health facility in Peru shows the case where the active case detection was designed to target populations less likely to attend the facility given the large distance to seek care, which translated to an overall boost in the probability of freedom by supplementing the available information.
Figure 4
Figure 4
Examples of the Freedom From Infection model results These results show how the model responds when species-specific data are available to generate species-specific estimates. The same series of figures is shown with added lines depicting the Plasmodium falciparum and Plasmodium vivax specific results. The routine malaria data are shown in the top plot and include the number of fever cases (dark red line), the number people tested for malaria (blue line), the number of reported P falciparum cases (green line), and the number of reported P vivax cases (purple dotted line). The resulting number of malaria cases potentially present as estimated by the model (middle plot) is shown with the estimated P falciparum infections shown with the blue line and the corresponding 95% credible interval with the blue shaded area, whereas the estimated P vivax infections are shown with the red line and the corresponding 95% credible interval with the yellow shaded area. The corresponding probability of freedom estimates per species are shown in the final plot with results for P falciparum represented by the blue line and P vivax by the red line. Examples of two facilities in the Philippines are shown applying the PCD-only model and generating P falciparum and P vivax specific results for the surveillance system sensitivity and probability of malaria freedom (A and B). These plots show that the results reflect the different data reported, showing the case for which a P vivax case was reported which, is reflected in the probability of malaria freedom estimate for that species only and the case for which a P falciparum case was reported with no impact on the P vivax estimates. Similarly, facilities in Peru (C) and Viet Nam (D) show the case where species-specific information on recent exposure within the past 12 months and historical exposure to each species collected during ACD activities were available for both species. As shown in both examples, when the species-specific ACD data are combined with that from PCD (green dotted lines for P falciparum and purple dotted lines for P vivax) the estimates of surveillance system sensitivity become more precise and the probability of malaria freedom increases compared with the case if only PCD data were available (blue dotted lines for P falciparum and red dotted lines for P vivax). ACD=active case detection. PCD=passive case detection.
Figure 5
Figure 5
Probability of freedom from Plasmodium falciparum in Viet Nam Results are shown for each of the catchment areas of the 921 facilities included in the three study regions in Viet Nam: Northern (A and B), Central (C and D), and the Central Highlands (E and F), with the location of each study region within the country shown in the inset map to the left of the panel. The figures on the left (A, C, and E) show the probability of malaria freedom estimate per catchment area at the final month of observation with the darker the blue showing the higher the estimated probability of freedom. The series of maps on the right (B, D, and F) show how many months from the final timepoint that each facility was able to maintain a probability of malaria freedom greater than 0·95, with the facilities in the teal to blue end of the spectrum meeting the WHO criteria for maintaining zero cases and a strong surveillance system for at least 36 months. Facilities with a probability of malaria freedom <0·95 represent those where there is high uncertainty in the data available and those with <0·50 meaning transmission and elimination are equally likely outcomes.

References

    1. WHO . World Health Organization; Geneva, Switzerland: 2018. Malaria surveillance, monitoring & evaluation: a reference manual.
    1. Mkali HR, Lalji SM, Al-Mafazy A-W, et al. How real-time case-based malaria surveillance helps Zanzibar get a step closer to malaria elimination: description of operational platform and resources. Glob Health Sci Pract. 2023;11 - PMC - PubMed
    1. Epstein A, Namuganga JF, Nabende I, et al. Mapping malaria incidence using routine health facility surveillance data in Uganda. BMJ Glob Health. 2023;8 - PMC - PubMed
    1. WHO . World Health Organization; Geneva, Switzerland: 2024. World malaria report 2024: addressing inequality in the global malaria response.
    1. WHO . World Health Organization; Geneva, Switzerland: 2020. Preparing for certification of malaria elimination.

Publication types

MeSH terms

LinkOut - more resources