. 2025 Aug 22;16(1):7853.
doi: 10.1038/s41467-025-61788-w.

Prolonging lung cancer response to EGFR inhibition by targeting the selective advantage of resistant cells

Affiliations

Prolonging lung cancer response to EGFR inhibition by targeting the selective advantage of resistant cells

Lisa Brunet et al. Nat Commun. .

Abstract

Non-small cell lung cancers (NSCLCs) treated with tyrosine kinase inhibitors (TKIs) of the epidermal growth factor receptor (EGFR) almost invariably relapse in the long term, due to the emergence of subpopulations of resistant cells. Through a DNA barcoding approach, we show that the clinically approved drug sorafenib specifically abolishes the selective advantage of EGFR-TKI-resistant cells, while preserving the response of EGFR-TKI-sensitive cells. Sorafenib is active against multiple mechanisms of resistance/tolerance to EGFR-TKIs and its effects depend on early inhibition of MAPK-interacting kinase (MKNK) activity and signal transducer and activator of transcription 3 (STAT3) phosphorylation, and later down-regulation of MCL1 and EGFR. Using different xenograft and allograft models, we show that the sorafenib-EGFR-TKI combination can delay tumor growth and promote the recruitment of inflammatory cells. Together, our findings indicate that sorafenib can prolong the response to EGFR-TKIs by targeting NSCLC capacity to adapt to treatment through the emergence of resistant cells.


Conflict of interest statement

Competing interests: Z.K. reports financial support from DeuterOncology NV outside the submitted work. B.C.C. reports stock ownership with TheraCanVac Inc, Gencurix Inc, Bridgebio therapeutics, KANAPH Therapeutic Inc, Cyrus Therapeutics, Interpark Bio Convergence Corp and J INTS BIO; reports participating in an advisory role for KANAPH Therapeutic Inc, Brigebio Therapeutics, Cyrus Therapeutics, Guardant Health and Oscotec; has received consulting fees from Novartis, Abion, BeiGene, AstraZeneca, Boehringer-Ingelheim, Roche, Bristol-Myers Squibb, ONO, Yuhan, Pfizer, Eli Lilly, Janssen, Takeda, MSD, Janssen, Medpacto, and Blueprint medicines; has received grants or funds from Novartis, Bayer, AstraZeneca, MOGAM Institute, Dong-A ST, Champions Oncology, Janssen, Yuhan, ONO, Dizal Pharma, MSD, Abbvie, Medpacto, GI Innovation, Eli Lilly, Blueprint medicines, and Interpark Bio Convergence Corp; has received royalties from Campions Oncology, Crown Bioscience and Imagen; and is the founder of DAAN Biotherapeutics. A.B.C. has received honorarium for advisory positions, board memberships, lectures, or non-financial support from the following sources: Astra-Zeneca, Roche, MSD, Pfizer, Novartis, Takeda, Janssen, AbbVie, and Amgen. L.G. is inventor of a patent on DNA barcoding issued to Inserm and University of Rouen (WO2017068120A1). S. A. reports personal fees from MSD Italia and a patent (Italian patent application No. 102022000007535) outside the submitted work. A.B. reports receipt of grants/research supports from Neophore, AstraZeneca, Boehringer Ingelheim, and honoraria/consultation fees from Guardant Health. A.B. is stock shareholder of Neophore and Kither Biotech. A.B. is advisory boards member for Neophore. The remaining authors declare no competing interests.

Figures
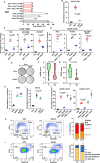
Fig. 1
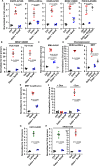
Fig. 1. Sorafenib specifically inhibits the emergence of resistant subpopulations of NSCLC cells induced by EGFR-TKIs.
A Cell viability assay of PC9 cells treated for 5 d with pemetrexed (Pem) and gefitinib (1 µM; Gef). The mean ± SEM of n = 6 is shown (representative of three independent experiments). B PC9 cells containing a pool of EGFR-T790M barcoded cells were treated with gefitinib (1 µM) or pemetrexed (50 nM) for 6 d. The EGFR-T790M mean ± SEM is shown (n = 4; representative of three independent experiments). C PC9, HCC4006 or HCC827 NSCLC cells containing EGFR-T790M barcoded subpopulations were treated with gefitinib (1 µM) or sorafenib (5 µM; Soraf) for 5 d. The EGFR-T790M mean ± SEM is shown (n = 4; representative of three independent experiments). D PC9, H1975, and YU-1150 cells containing EGFR-C797S-barcoded subpopulations were treated with osimertinib (0.1 µM; Osim) alone or with sorafenib (5 µM) for 10 d. The EGFR-C797S mean ± SEM is shown (n = 4; representative of three independent experiments). E PC9 and H1975 cells described in (E) were treated with osimertinib (1 µM or 0.1 µM, respectively) alone or with sorafenib (5 µM) for 20 d or 15 d. The cells were then fixed and stained (n = 3; representative of two and three independent experiments). EGFR-scores of responders (R) and non-responders (NR) from a cohort of renal-cell carcinoma (F) and thyroid cancer patients (G) treated with sorafenib. H H358 cells containing a KRAS-G12D-barcoded subpopulation were treated with sotorasib (10 nM; Sotor) alone or with sorafenib (5 μM) for 12 d. The KRAS-G12D mean ± SEM is shown (n = 4, representative of three independent experiments). p = 0.4857. I Ceritinib-resistant H3122 cells labeled with VIRHD lentivirus were mixed with parental cells (1:50) and treated with ceritinib (50 nM; Cerit) alone or with sorafenib (5 µM) for 7 d. VIRHD-cells mean ± SEM is shown (n = 5, representative of three independent experiments). J EGFR-C797S CRISPR-barcoded PC9 cells were treated with osimertinib (0.1 µM) alone or with sorafenib (5 µM), sunitinib (1 µM; Sun), regorafenib (2 µM; Reg), lenvatinib (1 µM; Lenv), or cabozantinib (5 µM; Cab) for 7 d (left) or 10 d (right). EGFR-C797S mean ± SEM is shown (n = 4–5; representative of three independent experiments). K PC9 cells were treated with sorafenib (5 μM) for 72 h, and cell cycle was analyzed by FACS. The mean ± SEM of four independent experiments is shown. L PC9 cells were treated with sorafenib (5 μM) for 72 h, and percentage of apoptotic cells was measured by annexin V staining. The mean ± SEM of three independent experiments is shown. ns not significant. Statistics are: B, C, D, H, I, J matched Mann-Whitney, two-tailed; F, G matched Student t-test, two-tailed; K, L matched two-way ANOVA with the Tukey correction. N refers to biological replicates. Source data are provided as a Source Data file.
Fig. 2
Fig. 2. Sorafenib specifically abolishes the selective advantage of cancer cells containing different clinically relevant mechanisms of resistance to EGFR inhibition.
A PC9 cells containing subpopulations of EGFR-G724S, ERBB2-ex20ins, KRAS-G12D, BRAF-V600E or PIK3CA-E545K cells were treated as indicated with osimertinib (0,1 μM; Osim), sorafenib (5 μM; Soraf) or trametinib (10 nM; Tram) for 7 d to 20 d. The mean ± SEM of the mutant barcodes is shown (n = 4; representative of three independent experiments). B BRAF-V600E osimertinib-resistant YUX-1024 and YU-1150 cells were mixed with parental cells (1:100) and treated for 7 d with osimertinib (0.1 μM) alone or with sorafenib (5 μM). The BRAF-V600E mean ± SEM is shown (n = 4; representative of three independent experiments). C PC9 cells containing a EML4-ALK-barcoded subpopulation were treated for 10 d with osimertinib (0.1 µM), sorafenib (5 µM), or crizotinib (500 nM; Criz). The EML4-ALK mean ± SEM is shown (n = 5; representative of three independent experiments). D PC9 cells overexpressing ERBB2-ex20ins or MET were mixed with parental cells (1:100) and treated with osimertinib (0.1 μM) alone or with sorafenib (5 μM) for 10 d or 15 d. The mean fraction ± SEM of ERBB2-ex20ins- or MET-overexpressing cells is shown (n = 4; representative of three independent experiments). E Lentiviral-labeled, osimertinib-resistant HCC827-GR6 cells were mixed with parental HCC827 (1:100) and treated for 6 d with osimertinib (0.1 µM) alone or with sorafenib (5 µM). HCC827-GR6 mean fraction ± SEM is shown (n = 4; representative of three independent experiments). F PC9 cells transduced with empty or inducible-SNAI2 vectors were pre-treated with or without doxycycline (1 µg/ml; Dox) for 7 d, mixed with parental PC9 (1:100) and treated for 7 d with osimertinib (0.1 µM) alone or with sorafenib (5 µM). The mean fraction ± SEM of vector-labeled cells is shown (n = 4; representative of three independent experiments). LIM1215 cells containing EGFR-G465R (G) or KRAS-G12D (H) CRISPR-barcodes were treated for 6 d with cetuximab (20 µg; Cetux) or osimertinib (1 µM), alone or with sorafenib (5 μM). The barcode mean fraction ± SEM is shown (n = 3 for EGFR-G465R; n = 4 for KRAS-G12D; representative of three independent experiments). Statistics calculated by Mann–Whitney test, two-tailed. “N” refers to biological replicates. Source data are provided as a Source Data file.
Fig. 3
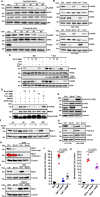
Fig. 3. Sorafenib prevents NSCLC cell resistance to EGFR-TKIs independently of MAPKs by inhibiting MKNK activity, STAT3 phosphorylation, and MCL1 expression.
A PC9 cells were treated with sorafenib (5 µM; Soraf) or trametinib (50 nM; Tram), followed by immunoblot (representative of three independent experiments). B YUX-1024 and YU-1150 PDCs were treated for 2 h with sorafenib (5 µM), osimertinib (0.1 µM; Osim), eFT-508 (1 µM; eFT), or trametinib (50 nM), followed by immunoblot (representative of three independent experiments). C PC9 cells containing inducible constitutively active MKNK2 (CA-MKNK2; Flag-tagged) were pre-treated with or without doxycycline (0.1 μg/ml; Dox) for 12 h, treated for 1 h with sorafenib, eFT-508 (20 μM) or trametinib (1 μM), followed by immunoblot (representative of four independent experiments). D Flag-eIF4E was incubated with recombinant active MKNK2 (rMKNK2) and the indicated inhibitors, followed by immunoblot (representative of three independent experiments). E PC9 cells were treated with sorafenib (5 µM) or trametinib (50 nM) for 6 h, followed by immunoblot (representative of three independent experiments). F PC9 cells were treated with or without sorafenib (5 µM), followed by immunoblot (representative of four independent experiments). G YU-1150 and YUX-1024 PDCs were treated with sorafenib (5 µM) for 3 d, followed by immunoblot (representative of three independent experiments). H PC9 cells were treated with sorafenib (5 µM) in the presence or the absence of cycloheximide (20 µg/mL; CHX) for 1 d, followed by immunoblot (representative of three independent experiments). I PC9 cells were treated with sorafenib (5 µM), chloroquine (50 µM; ChQ) or MG132 (5 µM) for 1 d as indicated, followed by immunoblot (representative of three independent experiments). J EGFR-T790M CRISPR-barcoded PC9 cells were treated for 5 d as indicated with gefitinib (1 µM), sorafenib (5 µM), or a combination (iESM) of napabucasin (0.5 µM), S63845 (0.1 µM), and eFT-508 (1 µM). EGFR-T790M mean ± SEM is shown (n = 5; representative of three independent experiments). K Osimertinib-resistant PC9 cells (EGFR-C797S) containing shMCL1, shSTAT3, and DN-MKNK1 inducible vectors were mixed with parental PC9 (1:100) and treated for 6 d as indicated with osimertinib (100 nM), sorafenib (5 µM), or doxycycline (2 µg/ml). EGFR-C797S mean ± SEM is shown (n = 5, representative of three independent experiments). J, K p values were calculated by Mann–Whitney two-tailed test and “n” refers to biological replicates. Source data are provided as a Source Data file.
Fig. 4
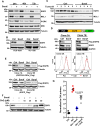
Fig. 4. Lysosomal degradation of EGFR participates in the effects of sorafenib in preventing the emergence of EGFR-TKI-resistant NSCLC cells.
A Time-course effects of sorafenib (5 µM; Soraf) in PC9 cells. Immunoblot was performed using the indicated antibodies (representative of four independent experiments). B YUX-1024 and YU-1150 PDCs were treated with sorafenib (5 µM) for 5 d, followed by immunoblot (representative of three independent experiments). C PC9 cells were injected in the flanks of female SCID mice and, once the tumors reached a mean volume of about 200 mm3, the mice were randomized and treated with control vehicle or sorafenib (60 mg/kg) for 4 d. The mice were then sacrificed, and the tumors dissected. Immunoblot was performed using the indicated antibodies (n = 5 mice). D PC9 cells were transduced with a lentiviral vector containing Flag-tagged EGFR-Ex19Del and the green fluorescent protein (GFP), separated by the T2A self-cleaving peptide and under the control of the PGK promoter. Two different clones were isolated and treated for 3 d in the presence or the absence of sorafenib (5 µM). The expression of EGFR and GFP was measured by immunoblot (upper panel) and FACS (lower panel), respectively. Representative blots and FACS analysis from three independent experiments. E PC9 cells were transduced with lentiviral vectors containing either Ex19Del-mutant or wt Flag-tagged EGFR, and two clones per condition were isolated. The clones were treated with or without sorafenib (5 µM) for 3 d, followed by immunoblot (representative of four independent experiments). F PC9 cells were treated with sorafenib (5 µM) alone or with different concentrations of chloroquine (ChQ) for 3 d, followed by immunoblot (representative of three independent experiments). G PC9 cells containing the EGFR-T790M CRISPR-barcode were treated with gefitinib (1 µM; Gef) alone or in combination with sorafenib (5 µM), with or without chloroquine (20 µM) for 4 d. The EGFR-T790M mean fraction ± SEM is shown (n = 5 biological replicates; representative of three independent experiments). Statistics are Mann–Whitney test, two-tailed. Source data are provided as a Source Data file.
Fig. 5
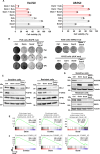
Fig. 5. Effects of sorafenib and osimertinib in osimertinib-sensitive and resistant cells.
A Parental (Par) or osimertinib-resistant (OR) PC9 cells were treated for 5 d as indicated with osimertinib (0,1 µM; Osim), sorafenib (5 µM; Soraf), sunitinib (1 µM; Sun) or cabozantinib (5 µM; Cab). The cell viability mean ± SEM is shown (n = 5 biological replicates; representative of four independent experiments). B Left panel: colony forming assay representative images of parental, gefitinib-resistant/osimertinib-sensitive (GR) or osimertinib-resistant PC9 cells treated for 5 d with osimertinib (1 µM) or sorafenib (5 µM), alone or in combination. Right panel: colony forming assay of H358 cells treated for 8 d with sotorasib (10 nM; Sotor) or sorafenib (5 µM), alone or in combination, or H3122 cells treated for 7 d with ceritinib (50 nM; Cerit) or sorafenib, alone or in combination (n = 3 biological replicates; representative of three independent experiments). Osimertinib-sensitive and resistant PC9 cells were treated for 1 d (C) or 3 d (D) with osimertinib (1 µM), sorafenib (5 µM), or the combination, followed by immunoblot using the indicated antibodies (representative of three independent experiments). E Gene set enrichment analysis (GSEA) of genes up-regulated by EGFR-TKIs in NSCLC cells (KOBAYASHI_EGFR_SIGNALING_24HR_UP signature), performed on gene array data obtained from PC9 cells treated with osimertinib (1 µM) or sorafenib (5 µM), alone or in combination (Combo) for 2 d. Enrichment scores (ES) and p values are reported (two-sided permutation test). F The data described in (E) were analyzed using our osimertinib-sorafenib combination signature (COMBO_UP). Source data are provided as a Source Data file.
Fig. 6
Fig. 6. The emergence of subpopulations of osimertinib-resistant NSCLC cells is inhibited in vivo by sorafenib.
A A PC9 mass population containing small pools (1:1000) of EGFR-C797S (expressing GFP), KRAS-G12D (expressing β-galactosidase), and PIK3CA-E545K (expressing mCherrry) osimertinib-resistant cells was subcutaneously injected in the flanks of female SCID mice. Once the tumors reached a mean volume of ~200 mm3, the mice were sacrificed (Ctrl) or treated for 4 weeks with osimertinib (5 mg/kg; Osim) alone or with sorafenib (60 mg/kg; Combo), followed by 3D-imaging. Images representative of two tumors per condition. The tumors from osimertinib-treated mice were cut in two. Scale bars: 1500 μm. B PC9 cells containing a small pool of EGFR-C797S cells were injected in the flanks of male SCID mice. Once the tumors were palpable (arrow), the mice were randomized and treated with or without osimertinib (5 mg/kg) and sorafenib (60 mg/kg; Soraf), alone or in combination, and tumor volume was measured by caliper. The mean tumor volumes ± SEM are represented (n = 5 mice). Osim vs Combo p-value was calculated at day 91 using two-tailed unpaired t test. C YUX-1024 PDCs containing a 1:200 subpopulation of BRAF-V600E resistant cells expressing GFP were subcutaneously injected in female SCID mice. Once the tumors reached a mean volume of about 200 mm3, the mice were sacrificed (Ctrl) or treated for 4 weeks with osimertinib (10 mg/kg) alone or in combination with sorafenib (60 mg/kg), followed by 3D-imaging. Images representative of two tumors per condition. Scale bars: 1500 μm. D YUX-1024 PDCs containing a pool of BRAF-V600E cells (1:200) were injected in the right and left flanks of female SCID mice. When the tumors reached a mean volume of about 200 mm3, the mice were treated with vehicle, osimertinib (10 mg/kg), sorafenib (60 mg/kg), or the combination. The mean tumor volumes ± SEM are represented (n = 6 mice for vehicle, n = 8 for the other groups); Osim vs Combo p value was calculated at day 83 using two-tailed unpaired t test. E Kaplan–Meier diagram of the experiment illustrated in (D). The mice were sacrificed when the volume of at least one of the tumors exceeded 800 mm3. Osim vs Combo p value was calculated (log-rank Mantel-Cox). Source data are provided as a Source Data file.
Fig. 7
Fig. 7. The osimertinib-sorafenib combination promotes the recruitment of antitumor immune cells and substantially prolongs the response in extremely aggressive models of acquired resistance.
A A PC9 mass population containing small pools of CRISPR-barcoded EGFR-C797S, KRAS-G12D, and PIK3CA-E545K cells or ERBB2-ex20ins overexpressing cells was injected in the flanks of male and female SCID mice. Once the tumors reached a mean volume of about 100 mm3, the mice were randomized and treated with vehicle, osimertinib (5 mg/kg; Osim) alone or with sorafenib (60 mg/kg; Combo). The mean tumor volumes ± SEM are shown (n = 6 mice for vehicle, n = 10 mice for other groups). Osim vs Combo p value was calculated at day 47 using two-tailed unpaired t test. B Kaplan–Meier diagram of the experiment shown in (A). The mice were sacrificed when the volume of at least one of the tumors exceeded 800 mm3. Osim vs Combo p value was calculated (log-rank Mantel-Cox). C GSEA of the genes up-regulated by osimertinib, sorafenib, or the combination in PC9 cells based on an inflammatory response signature. D Mouse BEM-5 cells were injected in the flanks of syngeneic BALB/c mice. When the tumors reached a mean volume of about 50 mm3, the mice were treated for 10 days with vehicle, osimertinib (20 mg/kg), sorafenib (60 mg/kg; Soraf), or the combination, followed by IHC analysis. Images representative of three different tumors/mice per condition. E BEM-5 cells were injected in the right and left flanks of BALB/c mice. Once the tumors reached a mean volume of about 50 mm3, the mice were randomized and treated with vehicle, osimertinib (20 mg/kg), sorafenib (60 mg/kg), or the combination. The mean tumor volumes ± SEM are shown (n = 5 mice for control, n = 6 mice for osimertinib and sorafenib, n = 16 mice for the combination). Osim vs Combo p value at day 57 was calculated using two-tailed unpaired t test. F Kaplan–Meier diagram of the experiment shown in (E). Osim vs Combo p value was calculated (log-rank Mantel-Cox). Source data are provided as a Source Data file.
Fig. 8
Fig. 8. Co-treatment with sorafenib inhibits osimertinib tolerant/persister cells.
A PC9 cells were treated for 1 d with osimertinib (1 µM; Osim) or sorafenib (5 µM; Soraf), alone or in combination (Combo), followed by immunoblot (representative of three independent experiments). B Drug-tolerant expanded persisters (DTEPs) labeled with a control lentivirus were mixed with parental PC9 cells (1:100) and treated for 15 d with osimertinib (0.1 µM) alone or with sorafenib (5 µM) or crizotinib (0.5 µM; Criz). DTEPs mean fraction ± SEM is shown (n = 4 biological replicates; representative of three independent experiments). Mann–Whitney two-tailed test. C PC9 cells stably expression GFP were treated with osimertinib (0,1 µM) or sorafenib (5 µM), alone or in combination for 26 d. The fluorescence from each well was measured every day with an Incucyte imaging system. The mean ± SEM of n = 7 biological replicates is shown (representative of two independent experiments). D PC9 cells containing highly complex CRISPR-barcodes in the AAVS1 locus were treated for 2 weeks with osimertinib (1 µM) and sorafenib (5 µM), alone or in combination (n = 4). Barcodes enriched at least 5-fold over the control in 4 or 3 biological replicates are shown. E Pearson correlation of the barcode distribution in control versus osimertinib or control versus combination. The coefficients of determination (R2) and the p value (Mann–Whitney, two-tailed) are indicated. F Mouse BEM4 cells were injected in the flanks of syngeneic BALB/c mice. Once the tumors reached a mean volume of about 100 mm3, the mice were randomized and treated 3 times a week with vehicle, osimertinib (20 mg/kg), sorafenib (60 mg/kg), or the combination. The mean tumor volumes ± SEM are shown (n = 7 mice for the control, n = 8 mice for the other groups). Osim vs Combo p value at day 64 is shown (two-tailed unpaired t test). G Kaplan–Meier diagram of the experiment shown in (F). Osim vs Combo p value was calculated (log-rank Mantel-Cox). H The indicated blood parameters were measure from the mice in (F) at 10 d and 28 d after the beginning of the treatment. ns not significant (Kruskal–Wallis, two-tailed). Source data are provided as a Source Data file.

References

    1. Peters, S., Mok, T., Passaro, A. & Janne, P. A. The promising evolution of targeted therapeutic strategies in cancer. Cancer Discov.11, 810–814 (2021). - PubMed
    1. Soria, J. C. et al. Osimertinib in untreated EGFR-mutated advanced non-small-cell lung cancer. N. Engl. J. Med.378, 113–125 (2018). - PubMed
    1. Ramalingam, S. S. et al. Osimertinib as first-line treatment of egfr mutation-positive advanced non-small-cell lung cancer. J. Clin. Oncol.36, 841–849 (2018). - PubMed
    1. Passaro, A., Janne, P. A., Mok, T. & Peters, S. Overcoming therapy resistance in EGFR-mutant lung cancer. Nat. Cancer2, 377–391 (2021). - PubMed
    1. Hanna, N. H. et al. Therapy for stage IV non-small-cell lung cancer with driver alterations: ASCO and OH (CCO) joint guideline update. J. Clin. Oncol.39, 1040–1091 (2021). - PubMed

MeSH terms