. 2025 Aug 22;16(1):7858.
doi: 10.1038/s41467-025-61767-1.

Early lineage segregation of primary myotubes from secondary myotubes and adult muscle stem cells

Affiliations

Early lineage segregation of primary myotubes from secondary myotubes and adult muscle stem cells

Gauthier Toulouse et al. Nat Commun. .

Abstract

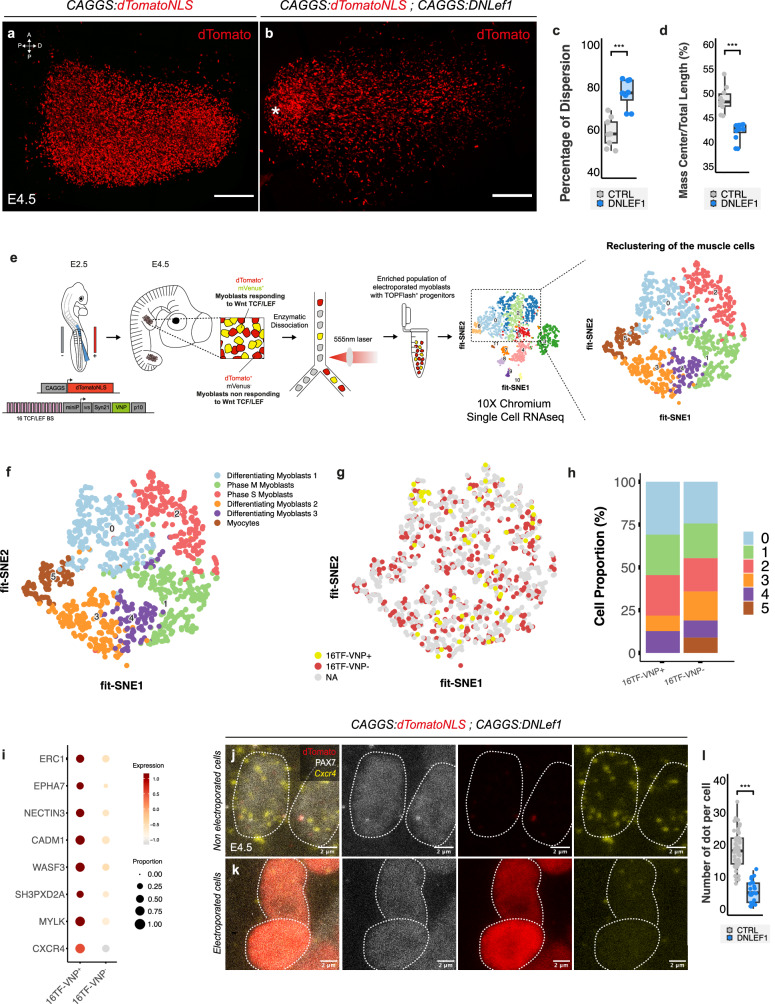
Myogenesis in amniotes occurs in two waves. Primary myotubes express slow myosin (often with fast myosin) and likely act as scaffolds for secondary myotubes, which express only fast myosin. The embryonic origins and relationships of these lineages, and their connection to satellite cells, remain unknown. Here, we combine a TCF-LEF/β-catenin signaling reporter with precise in vivo electroporation in avian embryos to trace limb muscle progenitors from early migration to fetal stages. We identify two distinct progenitor populations that coexist from the onset: reporter-positive cells give rise exclusively to primary myotubes, while reporter-negative cells generate secondary myotubes and satellite cells. We also reveal a previously unrecognized role for TCF-LEF/β-catenin signaling in spatially organizing the primary lineage via Cxcr4-mediated control of myoblast migration. These findings redefine the developmental origin of myogenic lineages, resolve a longstanding question in muscle biology, and provide a molecular framework for investigating how muscle fiber diversity emerges and how distinct lineages contribute to the functional specialization of skeletal muscle.


Conflict of interest statement

Competing interests: The authors declare no competing interests

Figures

Fig. 1
Fig. 1. TCF-LEF/β-catenin dependent signaling is restricted to early limb muscle development.
a Brachial somites were electroporated at E2.5 and embryos were analyzed at indicated timepoints. b Representation of the transcriptional reporter (16TF-VNP) used to monitor TCF/LEF/β-catenin dependent signaling. 16 TCF/LEF binding sites (BS) were placed upstream of a minimal promoter (miniP) driving the expression of a nuclear, destabilized Venus fluorescent protein (VNP); three translational enhancers were added (IVS, Syn21 and p10) to boost protein production. ce Dorsal view of confocal stacks of brachial somites electroporated with a ubiquitously expressed dTomato and the 16TF-VNP, observed at E3 and E3.5. E3 VLL timepoint represents the epithelial electroporated cells still located in the VLL at E3 while E3 Migrat. represents the mesenchymal, migrating electroporated cells at E3. Somite borders are indicated by dotted lines; d is an enlargement of (c). fi Dorsal views of confocal stacks of limb buds observed between E4.5 and E7.5, electroporated with either a ubiquitous TagBFP (fh) or a ubiquitous nuclear dTomato (i), together with the 16TF-VNP. Arrowheads in (i) indicate the last remaining 16TF-VNP+ cells present at E7.5. j Transversal section of E9.5 limb bud electroporated with a ubiquitous nuclear dTomato together with the 16TF-VNP. k Quantification of the percentage of 16TF-VNP+ cells between E3 and E6.5, each dot represents a limb bud (n = 5, 5, 4, 9, 5 and 6 for each time point, respectively). l Schematic representation of 16TF-VNP activity in the myogenic lineage during development. Box plots show the median (center line), 25th and 75th percentiles (box limits), and whiskers extending to the smallest and largest values within 1.5 x IQR. Scale bars: 100 μm (cf) or 200 μm (gj).
Fig. 2
Fig. 2. 16TF-VNP+ cells are early myogenic progenitors.
a Brachial somites were electroporated at E2.5 and embryos were analyzed at indicated timepoints. be Dorsal views of confocal stacks of E4.5 limb buds electroporated at E2.5 with an ubiquitous TagBFP, the 16TF-VNP reporter and immunostained for MYF5 (b, c) or MYOD (d, e). White arrowheads in (c) indicates 16TF-VNP+/MYF5+ cells; yellow arrowheads in (e) indicate some of the few 16TF-VNP+/MYOD+ observed. f, g Quantification of the percentage of 16TF-VNP+ cells positive for MYF5 (e) and MYOD (f) each dot represents a limb bud (n = 5 and 4, respectively). h, i Dorsal view of confocal stacks of E6.5 limb buds electroporated with a ubiquitous TagBFP, the 16TF-VNP reporter, and stained for PAX7 and MYF5 (h) or PAX7 and MYOD (i). The TagBFP channel is not represented. The white arrowheads indicate 16TF-VNP+/PAX7+/MYF5+ cells (g) and 16TF-VNP+/PAX7+/MYOD- ones (i). The yellow arrowhead in (i) indicates a 16TF-VNP+/PAX7+/MYOD+ cell. j, k Quantification of the percentage of 16TF-VNP+ cells positive for PAX7 and MYF5 (j) or PAX7 and MYOD (k), each dot represents a limb bud (n = 5 for both staining). l, m Dorsal view of confocal stacks of E7.5 limb buds electroporated with a ubiquitous nuclear dTomato, the 16TF-VNP reporter, and stained for PAX7. The arrowhead indicates one of the few remaining 16TF-VNP+ cells that also expresses PAX7 (n = 5 embryos). m is an enlargement of (l). Box plots show the median (center line), 25th and 75th percentiles (box limits), and whiskers extending to the smallest and largest values within 1.5 x IQR. Scale bars: 50 μm (h, i, m), 100 μm (be), or 200 μm (l).
Fig. 3
Fig. 3. TCF-Trace, a tool to follow the fate of cells experiencing TCF-LEF/β-catenin dependent signaling.
a, b Schematics of the constructs tested. The three constructs comprise 16 TCF/LEF binding sites upstream of a minimal promoter driving the expression of a rtTA (1) or a rtTA fused with a PEST sequence at its N-terminal part (2) or a rtTA fused with a PEST sequence at its N-terminal part, flanked by translational enhancers (3). All constructs were co-electroporated with a plasmid containing a rtTA-dependent (Tetracycline-Response Element, TRE) CRE recombinase and another plasmid containing a CRE-inducible nuclear dTomato. b Upon a response to TCF/LEF signaling in presence of doxycycline cells are permanently labeled with dTomato. c Embryos were electroporated in the neural tube at E2.5, induced with doxycycline and analyzed one day later. di Dorsal view of confocal stacks of E3.5 neural tube (NT) electroporated with a ubiquitous H2B-TagBFP and the rtTA plasmid (d, e), the destabilized rtTA (f, g) or the destabilized and boosted rtTA (h, i). The dotted lines delineate the electroporated, right side of the neural tube. j Quantification of (di), each dot represents an embryo (n = 4, 4, 4, 5, 4 and 4 for each condition, respectively). Statistical comparison was performed using the non-parametric Kruskal-Wallis test for multiple comparisons, followed by Dunn-Bonferroni post-hoc test. * = p < 0.05. k, m Dorsal view of confocal stacks of E4.5 limb buds electroporated at E2.5 with an ubiquitous mVenus, a ubiquitous rtTA, the CRE and dTomato plasmids, doxycycline was added at E2.5 and E3.5. m Quantification of the percentage of dTomato cells within the mVenus+ population, each dot represents a limb bud (n = 6). Box plots show the median (center line), 25th and 75th percentiles (box limits), and whiskers extending to the smallest and largest values within 1.5 x IQR. Scale bars: 50 μm (di, l) or 100 μm (l).
Fig. 4
Fig. 4. Lineage analysis of TCF-Trace+ and TCF-Trace- populations.
a TCF-Trace was induced with doxycycline during the time period (E4.5-E6.5) in which muscle progenitors respond to TCF/LEF signaling. Brachial somites of E2.5 embryos were electroporated, TCF-Trace was induced 2–4 days later, and embryos were analyzed at various stages from E7.5 to E16.5. b, c Dorsal view of confocal stacks of E7.5 limb bud electroporated with a ubiquitous mVenus, the TCF-Trace lineage tool driving the expression of a nuclear dTomato and stained for PAX7. c is an enlargement of (b). Arrowheads in (c) indicate electroporated TCF-Trace- muscle progenitors d Quantification of the percentage of TCF-Trace- or TCF-Trace+ cells in the PAX7+ electroporated population at E7.5 in the proximal and the distal part of the muscle mass, each dot represent a limb bud. e, f Transverse sections of E9.5 (e) and E12.5 (f) limb buds electroporated with a myofiber-specific dTomato and the TCF-Trace lineage tool driving the expression of eGFP. Arrowheads in (f) indicate electroporated TCF-Trace- myofibers. g Representative example of a TCF-Trace+ myotube surrounded by a smaller TCF-Trace- myotube (white arrowhead). h Quantification of the percentage of TCF-Trace- and TCF-Trace+ myotubes in the MLC+ electroporated population, each dot represents a section, n = 7 limbs for each condition, each dot represents a section, n = 28, 24, and 24 for E9.5, E12.5, and E16.5, respectively. Statistical comparison was performed using the non-parametric, Kruskal-Wallis test for multiple comparisons, followed by Dunn-Bonferroni post-hoc test. NS: p > 0.05, ****: p < 0.0001. i Transverse sections of E16.5 limb buds electroporated with a myofiber-specific dTomato, the TCF-Trace lineage tool driving the expression of eGFP, and immunostained for MYH7. Arrowheads indicate electroporated TCF-Trace+ myofibers expressing MYH7. j Quantification of the percentage of TCF-Trace- or TCF-Trace+ myotubes in the MYH7+ electroporated myotubes, each dot represents a section, n = 6 limbs each dot represents a section (n = 52 sections). k Transverse sections of E16.5 limb buds electroporated with a nuclear Achilles, the TCF-Trace lineage tool driving the expression of a nuclear dTomato and stained for PAX7. Arrowheads indicate electroporated TCF-Trace- muscle progenitors. l Quantification of the percentage of TCF-Trace- or TCF-Trace+ cells in the PAX7+ electroporated population, each dot represents a section, n = 7 limbs, each dot represents a section (n = 25 sections). Box plots show the median (center line), 25th and 75th percentiles (box limits), and whiskers extending to the smallest and largest values within 1.5xIQR. Scale bars: 10 μm (g, i, k), 20 μm (e, f), 50 μm (c), or 200 μm (b).
Fig. 5
Fig. 5. TCF-LEF/β-catenin controls the spatial distribution of primary myotube progenitors via Cxcr4.
a, b Dorsal view of a confocal stack of limbs electroporated with a ubiquitously expressed nuclear dTomato alone (a) or together with DN Lef1 (b). The asterisk in (b) indicates the clump of cell that remains located proximally. c, d Quantifications of the repartition of muscle progenitors in the limb, each dot represents an embryo (n = 9 and 8 for (c) and n = 10 and 12 for (d)). Statistical comparison was performed using the two-sided non-parametric Wilcoxon test. *** = p < 0.001. e Procedure followed to perform scRNAseq on electroporated limb muscle progenitors. f Six distinct clusters were identified within the total population of myoblasts. g, h 16TF-VNP- (red) and 16TF-VNP+ (yellow) distribute in all, but cluster 5. i List of migration-associated genes differentially expressed in the 16TF-VNP+ and 16TF-VNP- populations of myoblasts. j, k HCR FISH to detect Cxcr4 expression in control limb myoblasts (j) or after DN Lef1 over-expression (k). l Quantification of (j, k), 4 limb buds were analyzed and each dot represent a cell (n = 75 cells in total). Statistical comparison was performed using the two-sided non-parametric Wilcoxon test. *** = p < 0.001. Box plots show the median (center line), 25th and 75th percentiles (box limits), and whiskers extending to the smallest and largest values within 1.5xIQR. Scale bars: 100 μm (a, b).

References

    1. Christ, B. & Ordahl, C. Early stages of chick somite development. Anat. Embryol.191, 381–396 (1995). - PubMed
    1. Bryson-Richardson, R. J. & Currie, P. D. The genetics of vertebrate myogenesis. Nat. Rev. Genet. 2008 989, 632–646 (2008). - PubMed
    1. Hirst, C. E. C. E. & Marcelle, C. The avian embryo as a model system for skeletal myogenesis. Results and Problems in Cell Differentiation56, 99–122 (Springer, 2015). - PubMed
    1. Scaal, M. & Marcelle, C. Chick muscle development. Int. J. Dev. Biol.62, 127–136 (2018). - PubMed
    1. Gros, J., Scaal, M. & Marcelle, C. A two-Step mechanism for myotome formation in chick. Dev. Cell6, 875-882 (2004). - PubMed

MeSH terms

LinkOut - more resources