. 2025 Sep;57(9):2192-2202.
doi: 10.1038/s41588-025-02308-w. Epub 2025 Aug 22.

Tamoxifen induces PI3K activation in uterine cancer

Affiliations

Tamoxifen induces PI3K activation in uterine cancer

Kirsten Kübler et al. Nat Genet. 2025 Sep.

Abstract

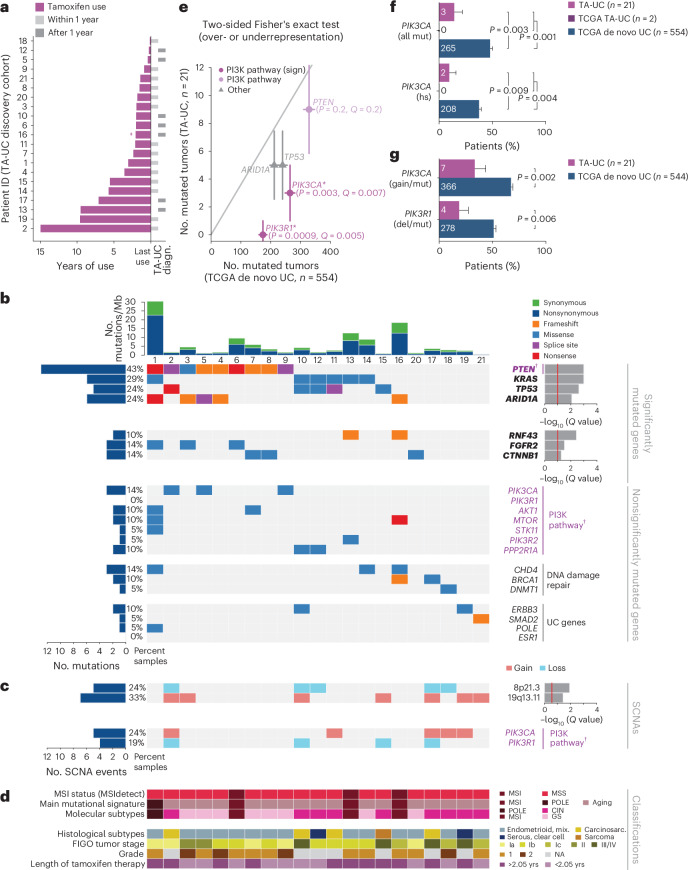
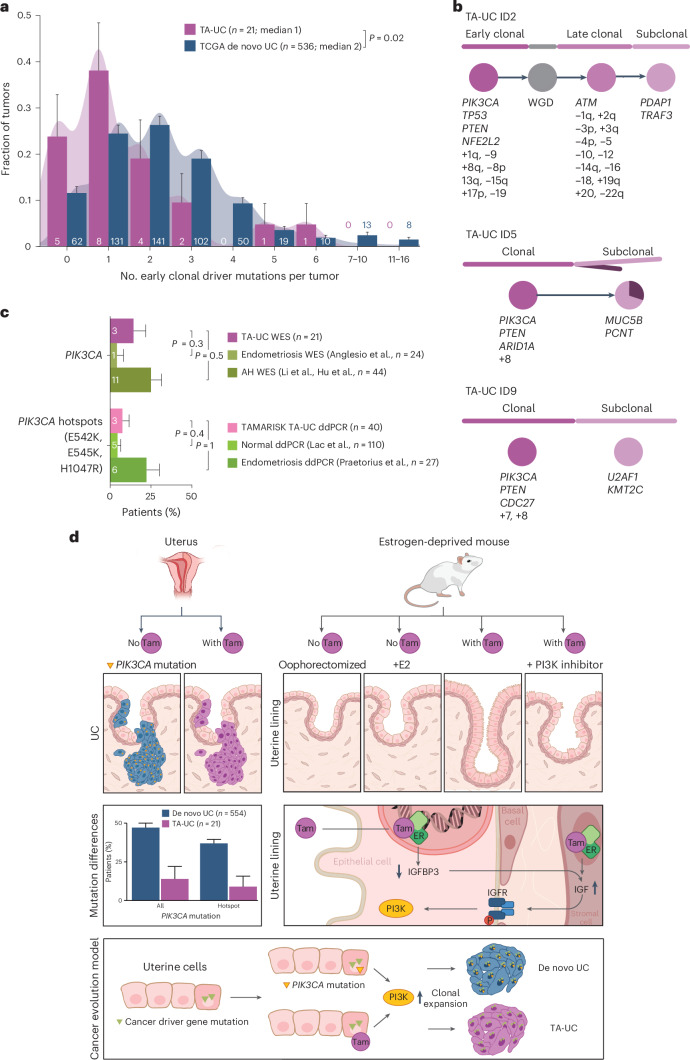
Mutagenic processes and clonal selection contribute to the development of therapy-associated secondary neoplasms, a known complication of cancer treatment. The association between tamoxifen therapy and secondary uterine cancers is uncommon but well established; however, the genetic mechanisms underlying tamoxifen-driven tumorigenesis remain unclear. We find that oncogenic PIK3CA mutations, common in spontaneously arising estrogen-associated de novo uterine cancer, are significantly less frequent in tamoxifen-associated tumors. In vivo, tamoxifen-induced estrogen receptor stimulation activates phosphoinositide 3-kinase (PI3K) signaling in normal mouse uterine tissue, potentially eliminating the selective benefit of PI3K-activating mutations in tamoxifen-associated uterine cancer. Together, we present a unique pathway of therapy-associated carcinogenesis in which tamoxifen-induced activation of the PI3K pathway acts as a non-genetic driver event, contributing to the multistep model of uterine carcinogenesis. While this PI3K mechanism is specific to tamoxifen-associated uterine cancer, the concept of treatment-induced signaling events may have broader applicability to other routes of tumorigenesis.


Conflict of interest statement

Competing interests: G.G. receives research funds from IBM, Pharmacyclics–AbbVie, Bayer, Genentech, Calico, Ultima Genomics, Inocras, Google, Kite and Novartis and is also an inventor on patent applications filed by the Broad Institute related to MSMuTect, MSMutSig, POLYSOLVER, SignatureAnalyzer-GPU, MSEye and MinimuMM-seq, and DLBclass. He is a founder of and a consultant to and holds privately held equity in Scorpion Therapeutics; he is also a founder of and holds privately held equity in PreDICTA Biosciences; and he holds privately held equity in Antares Therapeutics. R.J. received research funding from Lilly, Pfizer and Novartis and serves on an advisory board for GE Healthcare and Carrick Therapeutics. Y.E.M. is a consultant in Foresee Genomics. C.P.P. holds stock and other ownership interests in Xsphera Biosciences and receives honoraria from Bio-Rad and consults or advises for DropWorks and Xsphera Biosciences. C.P.P. also has sponsored research agreements with Daiichi Sankyo, Bicycle Therapeutics, Transcenta, Bicara Therapeutics, AstraZeneca, Intellia Therapeutics, Janssen Pharmaceuticals and Array BioPharma. W.J.G. is a cofounder of and holds equity in Ampressa Therapeutics, is a consultant for and holds equity in inference and has received consulting fees from Boston Clinical Research Institute, Belharra Therapeutics, Faze Medicine and ImmPACT Bio. E.M.V.A. reports an advisory role and/or consulting with Tango Therapeutics, Genome Medical, Invitae, Enara Bio, Janssen, Manifold Bio and Monte Rosa; research support from Novartis and BMS; equity in Tango Therapeutics, Genome Medical, Syapse, Enara Bio, Manifold Bio, Microsoft and Monte Rosa; travel reimbursement from Roche–Genentech and institutional patents filed on chromatin mutations and immunotherapy response and methods for clinical interpretation. W.Z. receives research funding and advises for Astellas Pharma. U.A.M. reports receiving consulting fees received from Merck, Novartis, Blueprint Medicines, AstraZeneca and NextCure as well as participating on a data safety monitoring board or an advisory board for Symphogen and Advaxis. M.J.E.M. receives research funding from W.J. Thijn Stichting. I.L. is a consultant for PACT Pharma and is a board member, scientific advisor and consultant to Ennov1. A.N. is currently employed by AstraZeneca. J.G. and M.R. disclose a financial association with Caris Life Sciences, including full-time employment, travel and/or speaking expenses and stock and/or stock options. The other authors declare no competing interests.

Figures

Fig. 1
Fig. 1. Reduced frequency of PI3K pathway mutations in TA-UC.
a, Time course for each patient shows duration of tamoxifen treatment (colored bars) and periods of UC diagnosis (diagn., gray bars); crossed dagger indicates treatment for at least 2 years, but exact duration is unknown. b, Plot of mutational features for TA-UCs from the discovery cohort, ordered by significantly mutated genes. From top to bottom, subpanels depict number (no.) of mutations per megabase (Mb), sample identifiers, significantly mutated genes (bold; red line, Q < 0.1; top, unrestricted hypothesis testing; bottom, restricted hypothesis testing of known UC driver genes) and nonsignificantly mutated cancer genes (PI3K pathway genes are in violet and annotated with a dagger). c, Plot of SCNAs ordered as in b; top, significant SCNAs (red line, Q < 0.25, from GISTIC); bottom, nonsignificant SCNAs in the PI3K pathway (violet and annotated with a dagger). d, Plot of molecular classifications and mutational processes (MSI, microsatellite instability; MSS, microsatellite stable; CIN, chromosomal instability; GS, genomically stable; POLE, polymerase ε), clinical annotations (mix., mixed; carcinosarc., carcinosarcoma; FIGO, International Federation of Gynecology and Obstetrics; NA, not available) and median length of tamoxifen use in years (yrs); samples ordered as in b. e, UC driver genes powered to detect differences (higher or lower) in mutation frequencies between TCGA de novo UC and TA-UC sample sets (P-value threshold for statistical power analysis at <0.05 after Bonferroni correction for the 49 significant driver genes in de novo UC). Genes are colored by pathway; gray line indicates equal frequencies in both cohorts; data points represent number of mutated tumors; error bars reflect Poisson-based s.d. estimate. Significance analysis by two-sided BH-corrected Fisher’s exact test (Q values added for all Q < 0.1 and/or PI3K pathway genes; * and sign denote significance). f, Bar plot of all (top, all mut) and hotspot (hs, bottom) PIK3CA mutations; bars represent mutation frequencies; error bars reflect s.d. from the β-distribution; significance analysis by two-sided Fisher’s exact test; numbers in bars indicate mutated tumor count per group. g, Bar plot of PI3K pathway alterations including SNVs (mut) and SCNAs (gain or deletion (del)); only TCGA tumors with both data types were considered; genes altered by either type were counted once per tumor; bars represent mutation frequencies; error bars reflect s.d. from the β-distribution; significance analysis by two-sided Fisher’s exact test; numbers in bars indicate mutated tumor count per group.
Fig. 2
Fig. 2. Independent clinical TA-UC cohorts confirm reduced PIK3CA mutation frequency.
a, Bar plot of clinical gene panel sequencing for TA-UC and de novo UC; bars represent PIK3CA mutation frequencies; error bars reflect s.d. from the β-distribution; significance analysis by two-sided Fisher’s exact test; numbers in bars indicate mutated tumor count per group. b, Bar plot of clinical WES data for TA-UC and de novo UC; bars represent PIK3CA mutation frequencies; error bars reflect s.d. from the β-distribution; numbers in bars indicate mutated tumor count per group. Significance analysis by two-sided Fisher’s exact test. c, Bar plot of WES data for TA-UC and de novo UC; bars represent PIK3CA and/or PIK3R1 mutation frequencies; error bars reflect s.d. from the β-distribution; numbers in bars indicate mutated tumor count per group. Significance analysis by two-sided Fisher’s exact test.
Fig. 3
Fig. 3. Tamoxifen affects cell morphology and PI3K signaling in mouse endometrial epithelial cells.
a,b, Representative hematoxylin and eosin (H&E)-stained endometrial sections from oophorectomized mice treated with vehicle, E2 or tamoxifen. Scale bars, 200 μm in a, 20 μm in b. c,d, Quantification of endometrial changes with number of ducts per mouse in c and mean length of luminal epithelial cells in d. Each symbol represents the mean of six sections per biologically independent mouse; sample sizes: vehicle (Veh), n = 2 (small horn size and extensive fibrosis in the region surrounding the horns secondary to the oophorectomy made dissection difficult); E2, n = 3; tamoxifen (Tam), n = 5. Center line depicts median; error bars represent s.e.m.; significance analysis using one-way ANOVA. e, Volcano plot depicts differentially expressed genes identified using DESeq2 by comparing tamoxifen versus vehicle in endometrial epithelial cells (Q < 0.01, BH-corrected two-sided Wald test). Red indicates upregulated (log2 (FC) > 1), blue indicates downregulated (log2 (FC) < −1), and genes not significantly changed are gray. f, Pathway enrichment analysis on the differently expressed genes from e. Bar plot depicts the odds ratio of pathway enrichment of MSigDB oncogenic signatures (gene set names shown on the y axis) in tamoxifen-versus-vehicle upregulated genes (log2 (FC) > 2, Q < 0.01, DESeq2); purple line indicates Q values from BH-corrected two-sided Fisher’s exact tests. g, Differentially expressed genes comparing tamoxifen versus E2 treatment, analyzed as described in e. h, Pathway enrichment analysis of the differently expressed genes from g. Bar plot depicts the odds ratio of pathway enrichment in tamoxifen-upregulated genes when compared to E2 treatment, analyzed as described in f. il, Left: representative immunohistochemistry (IHC) images with H&E counterstaining showing expression (brown) of phospho-insulin receptor (pIR) or IGF1R (Tyr1162/Tyr1163) in i, phospho-AKT (pAKT) (Thr308) in j, pS6 (Ser240/Ser244) in k and Ki-67 in l in the endometrial epithelium from mice treated with vehicle, tamoxifen or tamoxifen plus alpelisib (Tam + Alp). Scale bars, 20 μm. Right: quantification of immunoreactivity shown as H scores (product of percent positive cells × signal intensity in optical density). Each symbol represents the mean of five regions per biologically independent mouse, imaged at 20× magnification; sample sizes: vehicle, n = 2 (small horn size and surrounding fibrosis secondary to oophorectomy made dissection difficult); tamoxifen (i,j,l, n = 3; k, n = 5); tamoxifen and alpelisib (i,k,l, n = 5; j, n = 3). Center line depicts median; error bars represent s.e.m. Significance analysis by one-way ANOVA.
Fig. 4
Fig. 4. Igf1 expression in mouse endometrial stromal cells.
a, Representative RNAscope images of Igf1 expression in mouse uteri (three mice, treated as indicated). Dashed white lines depict the border between the epithelium and the stroma. White foci represent Igf1 mRNA signal (top); merged images (bottom) show 4′,6-diamidino-2-phenylindole (DAPI) (teal) and Igf1 (red). Different contrast settings were used for top and bottom images of the vehicle control. Scale bars, 20 μm. b, Mean Igf1 staining intensity per nucleus across entire uterine tissue areas (epithelium and stroma) per biologically independent mouse (n = 3). Significance analysis by paired two-sided t-test. Center line depicts median; error bars represent s.e.m.
Fig. 5
Fig. 5. Mutations in PIK3CA are early events in tumorigenesis.
a, Density histogram with bars representing fraction of tumors grouped by number of clonal mutations in commonly mutated early driver genes (Supplementary Table 14) per sample; error bars reflect s.d. from the β-distribution; significance analysis by two-sided Wilcoxon test; numbers in or above bars indicate the mutated tumor count per group. b, Estimated phylogenetic trees (top), relative order and molecular timing of events (bottom) in PIK3CA-mutated TA-UC (discovery cohort). Circle plots indicate estimated clonal composition. c, Bar plot of WES and ddPCR data for TAMARISK TA-UC samples, normal endometrial tissue and benign endometrial disease endometriosis, and atypical hyperplasia, (AH); bars represent PIK3CA mutation frequencies; error bars reflect s.d. from the β-distribution; numbers in bars indicate mutated tumor count per group; significance analysis by two-sided Fisher’s exact test. d, Schematic illustration depicting (1) PIK3CA mutations in TA-UC and de novo UC (top two left subpanels; bars represent mutation frequencies; error bars reflect s.d. from the β-distribution), (2) the in vivo mouse model (top right) with cell morphological changes from normal atrophic (no tamoxifen (Tam)) and normal proliferative (+E2) to increased number of ducts and cell hypertrophy (with tamoxifen) and normalized number of ducts and cell length (with tamoxifen and PI3K inhibitor), (3) the model of PI3K signaling induced by tamoxifen (middle right) and (4) the model of UC evolution for de novo UC and TA-UC (bottom).
Extended Data Fig. 1
Extended Data Fig. 1. Absence of tamoxifen-induced mutagenesis in TA-UC.
(a) CONSORT flow diagram depicts allocation of Netherlands Cancer Institute (NKI) patients from the TAMARISK study for our analysis. (b) Bar plot of uterine cancer (UC) cohorts with and without history of tamoxifen (TA); bars represent histological type frequencies (endom., endometrial); error bars reflect standard deviation from the β-distribution; significance analysis by two-sided Fisher’s exact test with Benjamini-Hochberg procedure; numbers in/above bars indicate tumor count per group. (c) Bar plot of TA-UC and de novo UC cases (excluding 7 endometroid and 4 serous endometrial TCGA tumors due to lack of annotation); bars represent molecular subtype frequencies; error bars reflect standard deviation from the β-distribution; numbers in bars indicate tumor count per group. Significance analysis by two-sided Fisher’s exact test with Benjamini-Hochberg procedure (CIN, chromosomal instable; GS, genomically stable; MSI, microsatellite instability; POLE, polymerase ε). (d) MSI scores for each TA-UC sample (dots), generated by MSIDetect (see Methods); corresponding normal samples served as controls; tumors with a higher score than in the normal were classified as MSI cases. (e) Number of non-synonymous mutations per exome (mutations/Megabase, left) and fraction of chromosomal regions affected by ABSOLUTE somatic copy number alterations (SCNAs) out of all measured regions (right); dots represent single samples; horizontal lines indicate group medians. Significance analysis by two-sided Wilcoxon test. (f) Number of non-synonymous mutations grouped by molecular subtype as in c. Individual data points (black) overlay summary statistic boxplots; horizontal center lines indicate median; boxes span the interquartile range (IQR, 25th to 75th percentile); whiskers extend to the most extreme values within 1.5×IQR. Significance analysis by two-sided Wilcoxon test with Benjamini-Hochberg procedure. (g) Number of chromosomal regions affected by somatic copy number alterations (that is, amplifications and deletions; top) or deletions only (bottom), grouped by molecular subtypes as in c. Individual data points (black) overlay summary statistic boxplots; horizontal center lines indicate median; boxes span the interquartile range (IQR, 25th to 75th percentile); whiskers extend to the most extreme values within 1.5×IQR. Significance analysis by two-sided Wilcoxon test with Benjamini-Hochberg procedure.
Extended Data Fig. 2
Extended Data Fig. 2. Mutational alterations in TA-UC.
(a) Mutational matrix of TA-UC (discovery cohort) decomposed into four signatures; colors represent the six base substitution types (top y-axis), further stratified by 5’ and 3’ flanking bases (bottom y-axis). Patterns were matched to COSMIC reference signatures; known etiologies are shown on the right. (b) Mutational signature activity per sample, shown as count (left) and fraction (right) of mutations attributed to each signature (color-coded; identified as in a). (c) Rank order of UC driver genes powered to detect differences (higher or lower) in mutation frequencies (mut freq) between TCGA de novo UC and TA-UC (discovery cohort); lines connect gene ranks between cohorts. (d) UC driver genes powered to detect lower mutation frequencies in TA-UC compared to de novo UC (P-value threshold for statistical power analysis at <0.05, genes mutated in at least 76 de novo UC samples can potentially be considered significantly less mutated in TA-UC). Genes are colored by pathway. Gray line indicates equal frequencies; data points represent number (no) of mutated tumors; error bars reflect Poisson-based standard deviation estimate. Significance analysis by one-sided Fisher’s exact test with Benjamini-Hochberg procedure (Q-values added for all Q < 0.1 and/or PI3K pathway genes; * and sign denote significance). (e) Bar plot of mean gene coverage across samples, ordered high to low; gray line indicates the low-coverage threshold; white crosses indicate presence of a mutation. (f) Integrated plot of PIK3CA mutations in TA-UC samples detected by whole-exome sequencing (WES; blue; cancer cell fraction [CCF] shown) and droplet digital PCR (ddPCR; red; variant allele frequency [VAF; %] shown), ordered top to bottom by protein change (NA, not available). (g) Density histogram showing fraction of tumors grouped by number (no.) of mutations in key PI3K pathway genes per sample; error bars reflect standard deviation from the β-distribution; significance analysis by two-sided Wilcoxon test; numbers in bars indicate mutated tumor counts per group. (h) Violin plots showing timing differences of early clonal driver mutations between TA-UC and TCGA de novo UC; significance values from permutation tests with Benjamini-Hochberg procedure.
Extended Data Fig. 3
Extended Data Fig. 3. Genomic alterations in de novo UC samples from TCGA.
(a) CONSORT flow diagram of de novo UC allocation from the TCGA PanCanAtlas. (b) Plot of genomic features, top panel depicts mutation frequency per megabase (Mb); bottom panel depicts significantly mutated genes detected by MutSig2CV (red line, Q < 0.1), ordered by significance; genes significantly mutated in the TA-UC cohort are shown in bold. (c) Amplifications (left, red) and deletions (right, blue) detected by GISTIC. Chromosomal positions from top to bottom; Q-values from left to right (green line, Q < 0.25). Significant peaks are annotated with chromosomal position and candidate cancer genes, where applicable.
Extended Data Fig. 4
Extended Data Fig. 4. Copy number changes in TA-UC.
(a) TA-UC samples are grouped according to mutated genes in Fig. 1b, with each column representing one tumor. Top: Sample identifiers of the TA-UC discovery cohort; molecular (MSI, microsatellite instability; CIN, chromosomally instability; GS, genomically stable; POLE, polymerase ε) and histological classifications; ABSOLUTE-generated ploidy values; presence of whole-genome doubling (WGD). Middle: ABSOLUTE total copy numbers of individual segments delineated by their genomic position along the 22 chromosomes (top to bottom); colors indicate loss, copy neutral loss-of-heterozygosity (LOH) or gain at genomic loci. Bottom: colored boxes indicate presence of a mutation; bars on the right of the boxes depict cancer cell fraction (CCF); significantly mutated genes are shown in bold as in Fig. 1b; genes of the PI3K pathway are in violet. (b) Amplifications (left, red) and deletions (right; blue) detected by GISTIC in the TA-UC discovery cohort. Chromosomal positions from top to bottom; Q-values from left to right (green line, Q < 0.25). Significant peaks are annotated with chromosomal position and candidate cancer genes, where applicable (black); positions of non-significant genes of the PI3K pathway are also annotated (gray). (c) Bar plot of tumors with genomic alterations in key PI3K pathway genes including single-nucleotide variants (mut) and somatic copy number alterations (gain/deletion); only TCGA tumors with both data types considered; genes altered by either type counted once per tumor; bars represent mutation frequencies, with genes ordered by P-value (top to bottom); error bars reflect standard deviation from the β-distribution; significance analysis by two-sided Fisher’s exact test with and without Benjamini-Hochberg procedure; numbers in bars indicate mutated tumor count per group.
Extended Data Fig. 5
Extended Data Fig. 5. PIK3CA mutation frequencies in de novo UC by body mass.
Bar plots of TCGA (left) and CPTAC (right) de novo UC cohorts; bars represent PIK3CA mutation frequencies across three body mass index (BMI) groups: normal weight (NW, BMI < 25), overweight (OW, BMI 25 – 29.9), and obese (OB, BMI ≥ 30). Error bars reflect standard deviation from the β-distribution; significance analysis by two-sided Fisher’s exact test; numbers in bars indicate mutated tumor count per group.
Extended Data Fig. 6
Extended Data Fig. 6. TA-UC validation cohorts.
(a, d, f) Time course plots for patients in the TAMARISK validation cohort (a), the clinical gene panel sequencing cohort (d), and the clinical whole-exome sequencing (WES) validation cohort (f), showing duration of tamoxifen (TA) treatment (colored bars) and periods of uterine cancer (UC) diagnosis (diagn., gray bars). (b) Integrated plot of PIK3CA and ESR1 hotspot mutations in TA-UC (TAMARISK validation cohort), detected by droplet digital PCR (ddPCR; red; variant allelic fraction [VAF, %] shown); each column represents one tumor (NA, not available). (c, g) CONSORT flow diagrams showing patient allocation (BC, breast cancer; CxCa, cervical cancer; HRD, homologous recombination deficiency; met, metastatic; OvCa, ovarian cancer; synchr, synchronous; UC, uterine cancer; yrs, years) for clinical gene panel sequencing at Dana-Farber Cancer Institute (DFCI; c) and clinical whole-exome sequencing (WES; g). (e, h) Bar plots showing frequencies of histological uterine cancer (UC) types (endom, endometrial) in patients with and without history of tamoxifen (TA) from clinical gene panel sequencing (e) and clinical whole-exome sequencing (WES) compared to SEER9 data (h); error bars reflect the standard deviation from the β-distribution; numbers in/above bars indicate tumor count per group; significance analysis by two-sided Fisher’s exact test with Monte Carlo Benjamini-Hochberg procedure. (i) Bar plot of clinical (clin) whole-exome sequencing (WES) data from patients with de novo UC (endom, endometrial); bars show PIK3CA and PIK3R1 mutation frequencies, grouped by histological subtype; numbers in/above bars indicate number of mutated samples (before the slash) and total number of samples in that subtype (after the slash); error bars reflect the standard deviation from the β-distributions. (j) Bar plot of clinical WES data from breast cancer patients with and without history of tamoxifen (TA); bars show mutation frequencies; error bars reflect the standard deviation from the β-distribution; numbers in bars indicate mutated tumor count per group. Significance analysis by two-sided Fisher’s exact test.
Extended Data Fig. 7
Extended Data Fig. 7. Mouse endometrial epithelial cell purification.
(a) Schematic illustrating the experimental design for the collection of uterine horns, isolation of endometrial epithelial cells and downstream analyses. Uterine horns were used for formalin fixation and paraffin embedding followed by immunohistochemistry (left) and for RNA sequencing (RNA-seq, right) from mice as indicated. (b) Relative quantitative reverse transcription PCR (qRT-PCR) of Epcam and Vim mRNA expression in mouse endometrial cell populations isolated from a tamoxifen-treated mouse (n = 1) to confirm the purity of the isolated cell fractions. Gapdh was used as reference. Each symbol represents a technical replicate; center line depicts mean; error bars represent SEM.
Extended Data Fig. 8
Extended Data Fig. 8. Effects of tamoxifen and E2 in mouse endometrial epithelial cells.
(a) Pathway enrichment analysis on the differently expressed genes identified by DEseq2 from comparing estradiol (E2) versus tamoxifen (Tam) in endometrial epithelial cells (Q < 0.01, Benjamini-Hochberg-corrected two-sided Wald test). Bar plot depicts the odds ratio of pathway enrichment (MSigDB oncogenic signatures); purple line indicates the Q-values from the Benjamini-Hochberg-corrected two-sided Fisher’s exact tests. (b) Venn diagram showing the genes upregulated after tamoxifen treatment compared to vehicle (veh) control, and genes upregulated after E2 compared to veh control (DEseq2, log2FC > 1, Q < 0.01, Benjamini-Hochberg-corrected two-sided Wald test). (ce) Pathway enrichment analysis (MSigDB oncogenic signatures) on: (c) genes upregulated with tamoxifen treatment versus vehicle that are not shared with the E2-upregulated genes (n = 962, as shown in the Venn diagram in b); (d) shared genes upregulated by tamoxifen treatment versus vehicle and E2 treatment versus vehicle; and (e) genes upregulated by E2 treatment versus vehicle but not upregulated by tamoxifen versus vehicle. Bar plots depict the odds ratio of pathway enrichment, Q-values from the Benjamini-Hochberg-corrected two-sided Fisher’s exact tests. (f) Comparison of differentially expressed genes (log2 fold change [FC]) between tamoxifen (tam) over vehicle control (x-axis) and tamoxifen plus alpelisib (y-axis). Genes with FDR < 0.05 (DEseq2) are categorized and color-coded. (g) Representative immunohistochemistry images of ER expression (nuclear brown staining) in epithelial (black arrow) and stromal cells (red arrow) in the uteri from mice treated with vehicle control, estrogen (E2), and tamoxifen. Scale bars: 10μm, H&E counterstaining. Each treatment group represents independently repeated experiments with similar results: vehicle (n = 2 mice), E2 (n = 3 mice), and tamoxifen (n = 5 mice). (h) Heatmap of log2 FPKM expression levels (scale 0-5) of genes related to Igf1r in mouse endometrial epithelial cells from vehicle (Veh), estradiol (E2), tamoxifen (Tam) and tamoxifen plus alpelisib (Tam+Alp) treatment cohorts.

References

    1. Kuijk, E., Kranenburg, O., Cuppen, E. & Van Hoeck, A. Common anti-cancer therapies induce somatic mutations in stem cells of healthy tissue. Nat. Commun.13, 5915 (2022). - PMC - PubMed
    1. Carthew, P. et al. DNA damage as assessed by 32P-postlabelling in three rat strains exposed to dietary tamoxifen: the relationship between cell proliferation and liver tumour formation. Carcinogenesis16, 1299–1304 (1995). - PubMed
    1. Carthew, P. et al. Cumulative exposure to tamoxifen: DNA adducts and liver cancer in the rat. Arch. Toxicol.75, 375–380 (2001). - PubMed
    1. Busch, H. Adducts and tamoxifen. Semin. Oncol.24, S1-98–S1-104 (1997). - PubMed
    1. Hernandez-Ramon, E. E. et al. Tamoxifen–DNA adduct formation in monkey and human reproductive organs. Carcinogenesis35, 1172–1176 (2014). - PMC - PubMed

MeSH terms

LinkOut - more resources