. 2025 Aug 22;10(1):270.
doi: 10.1038/s41392-025-02366-w.

Hemoglobin as a pseudoperoxidase and drug target for oxidative stress-related diseases

Affiliations

Hemoglobin as a pseudoperoxidase and drug target for oxidative stress-related diseases

Woojin Won et al. Signal Transduct Target Ther. .

Abstract

Hemoglobin (Hb) is well known for transporting oxygen in the blood, but its role in the brain remains poorly understood. Here, we identified Hb in the cytosol, mitochondria, and nuclei of hippocampal and substantia nigra astrocytes and dopaminergic neurons. As a pseudoperoxidase, Hb decomposes hydrogen peroxide (H2O2) and mitigates H2O2-induced oxidative damage. However, in Alzheimer's disease, Parkinson's disease, and aging, excessive H2O2 diminishes astrocytic Hb, perpetuating a vicious cycle of oxidative stress and neurodegeneration. To counter the harmful effects of aberrant H2O2 production in diseases, we developed KDS12025, a BBB-permeable small molecule that enhances Hb pseudoperoxidase activity 100-fold, even at a low level of Hb. KDS12025 and its analogs achieve this enhancement through its electron-donating amine group, possibly stabilizing the complex between Hb, H2O2, and KDS12025. KDS12025 reduces astrocytic H2O2, alleviates astrogliosis, normalizes Hb, and reverts to a virtuous cycle of redox balance, preventing neurodegeneration without altering the oxygen-transport function of Hb. Gene silencing of Hb abrogates the impact of KDS12025 in both culture and animal models, confirming the necessity of Hb for the effects of KDS12025. KDS12025 extends survival and improves motor function even in severe amyotrophic lateral sclerosis and aging. Furthermore, the enrichment of astrocytic Hb in the nucleolus highlights a novel antioxidative mechanism potentially protecting against nuclear oxidative damage. Our findings suggest that Hb is a new therapeutic target for neurodegenerative diseases, with KDS12025 emerging as a first-in-class approach that enhances Hb pseudoperoxidase activity to reduce H2O2. Increasing Hb pseudoperoxidase activity with KDS12025 mitigates oxidative stress and alleviates neurodegeneration in AD, PD, and ALS patients and increases the degree of aging, with broad applicability for numerous oxidative-stress-driven diseases.


Conflict of interest statement

Competing interests: W.W., E.H.L., K.D.P., and C.J.L., as well as IBS and KIST, are inventors on a patent for the novel aromatic compounds (KR-10-2643543-0000) and have a pending PCT application (PCT/KR2021/016542). The authors have no other competing interests to declare.

Figures
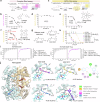
Fig. 1
Fig. 1
Hemoglobin’s peroxidase-like activity: developing an enhancer for decomposition of H2O2. a Schematic diagram of the HRP-dependent Amplex Red H2O2 assay. b Dose‒response curve for HTPEB in the Amplex Red assay. c HRP-independent ROS-Glo H2O2 assay. d, e Dose‒response curve for HTPEB in the ROS-Glo assay without or with replenishing HRP. f Hb-dependent H2O2 decomposition in the ROS-Glo assay with (red square) or without (black circle) HTPEB. g Chemical structure of KDS derivatives (KDS12008, KDS12017, and KDS12025) retaining the essential N-phenethylaniline core with an electron-donating group. h Dose‒response curve for KDS derivatives in the presence (circle) or absence (triangle) of Hb (EC50 with Hb in μM: HTPEB, 0.15; KDS12008, 0.08; KDS12017, 0.09; KDS12025, 0.04). i ITC analysis of the binding interaction between Hb (50 μM) and KDS12025 (5 μM), with or without H2O2. j (left) General view of KDS12025 binding to Hb as proposed by docking simulations. The protein unit color codes are as follows: Hbɑ—wheat and Hbβ—cyan. Heme cofactors and KDS12025 are represented in stick form. (middle) Predicted binding modes of selected active compounds KDS12008, KDS12017, KDS12025, and HTPEB with Hbβ and H2O2. In ligand structures, polar and interacting nonpolar hydrogens are explicitly shown. The distances between H2O2 and the ligand and protein (Å) are labeled. The binding energies (ΔGbind) are labeled in the bottom right corner of each panel. (right) 2D interaction map of KDS12025 binding to Hbβ. Dose‒response curves and EC50 values were determined via GraphPad Prism software. The data are presented as the means ± s.e.m
Fig. 2
Fig. 2
KDS12025 enhances Hb pseudoperoxidase activity. a Comparison of H2O2 decomposition by HRP and Hb after drug treatment (10 μM) for 30 min via the ROS-Glo assay. b Fold change (vehicle difference divided by drug difference) in H2O2 decomposition facilitated by HRP and Hb under drug conditions. c Experimental timeline investigating Hb intrinsic peroxidase activity and enhancement by drug preincubation. d Hb peroxidase activity and dose-dependent effects of drugs (D, DMSO; H, HTPEB; K, KDS12025) at various Hb concentrations. e Dose‒response curve showing the EC50 and EC20 values for Hb H2O2 decomposition activity. f, g Bubble generation observed from CAT, HRP, and Hb in reaction with H2O2 under a microscope and quantified per 1 × 1 mm2 area. h Schematic and quantification of bubble liberation volumes measured in the cylinders. i Schematic of arterial blood collection by direct cardiac puncture. P50 values (mmHg), calculated from pO2 and SO2 using the i-STAT analyzer, between vehicle- and KDS12025-treated mice (0.1, 1, or 10 mg/kg, i.p., 24 h). j Arterial Hb concentration (g/dL) across groups. k Timeline of the PhenoMaster experiments investigating the metabolic effects of KDS12025 at different concentrations (0.1, 1, and 10 mg/kg/day). Measurements of oxygen consumption (l), carbon dioxide production (m), and the respiratory exchange ratio (RER; L) (n) during night (dark) and day (white) cycles, with a summary graph provided. The EC20 and EC50 values were determined via GraphPad Prism software. The data are presented as the means ± s.e.m. *P < 0.05, **P < 0.01, ***P < 0.001; ns not significant. Additional statistics are provided in Supplementary Table 8
Fig. 3
Fig. 3
KDS12025 effectively reduces AD- and PD-like pathology in vitro. a Representative Lattice-SIM images showing the colocalization of a mitochondrial marker (MitoTracker), Hbβ, and DAPI in cultured astrocytes. b Schematic diagram of Aβ, putrescine (a precursor of MAOB-dependent H2O2 production), or 6-OHDA-induced aberrant H2O2 in astrocytes. c Timeline of 40-h live H2O2 imaging using an oROS-G probe in Aβ-, putrescine-, or 6-OHDA-incubated cultured hippocampal astrocytes. d DCFDA assay in cultured astrocytes treated with various concentrations of Aβ42 (0, 1, 5, or 10 μM; n values indicate the number of wells). e Measurement of Aβ-induced ROS, including H2O2 levels, in cultured astrocytes treated with KDS12008 (10 µM), KDS12017 (10 µM), KDS12025 (10 µM), HTPEB (10 µM), or sodium pyruvate (1 mM). f oROS-G fluorescence assay in cultured astrocytes expressing oROS-G treated with Aβ42 (0, 1, 5, or 10 μM) to assess the level of intracellular H2O2. g Dose‒response curve of KDS12025 in Aβ (5 µM)-treated astrocytes. 40-h continuous H2O2 imaging using an oROS-G probe following oligomerized Aβ (5 μM, h) and putrescine (180 μM, i) treatment, with the administration of KDS12025 (10 μM) and sodium pyruvate (1 mM). j oROS-G assay in cultured astrocytes treated with 6-OHDA (10, 30, 50 μM). k Live-cell H2O2 imaging via an oROS-G probe following treatment with the oligomerized 6-OHDA (30 μM), KDS12025, and sodium pyruvate. n values in oROS-G indicate the number of cells. The data are presented as the means ± s.e.m. *P < 0.05, **P < 0.01, ***P < 0.001; ns not significant. Additional statistics are provided in Supplementary Table 8
Fig. 4
Fig. 4
The therapeutic effect of KDS12025 in neurodegenerative mouse models. a Schematic timeline of reactive astrocytes in APP/PS1 mice generated via focal expression of DTR (fGiD) in astrocytes via intraperitoneal (i.p.) injection of KDS12025 (3 mg/kg/day) or DT (2 mg/ml) for 16 days. b Transfer latency to enter the dark chamber of control, fGiD, and fGiD+KDS mice in the passive avoidance test (PAT). c Discrimination indices of control, fGiD, and fGiD+KDS mice in the NPR test. The discrimination index reflects the preference for the relocated object. d Representative hippocampal CA1 images stained for NeuN and GFAP in WT, fGiD, and fGiD+KDS mice (N = 3 per group; scale bar, 10 μm). e Quantification of the mean GFAP intensity in the GFAP-positive area. f Neurodegeneration according to the number of NeuN-positive cells (50 × 50 μm2). g Schematic timeline of the A53T virus-induced PD model and KDS12025 treatment (1 mg/kg/day; water ad libitum). h Rotarod test diagram and latency-to-fall test results for control, A53T, and A53T + KDS mice. i Representative images of the SNpc region with ipsilateral (ipsi.) and contralateral (contra.) Side effects of GFAP, GABA, and TH in control, A53T, and A53T + KDS mice (N = 3 for each, scale bar, 10 µm). j Quantification of the GFAP-positive area in the SNpc. k Mean GABA intensity in GFAP-positive areas in the SNpc. l TH-positive neuron counts per hemisphere in the SNpc. m Schematic timeline of SOD1G93A mice treated with KDS12025 (1 and 10 mg/kg/day, drinking water ad libitum). n Ratios of the running times of the control, SOD1, and SOD1 + KDS mice in the rotarod test. o Survival probability curves of control, SOD1G93A, and SOD1 + KDS mice. p Representative images of GFAP and NeuN staining in the ventral spinal cord (L2–L5) of control, SOD1, and SOD1 + KDS mice (N = 3 per group; scale bar, 50 μm). q Quantification of the GFAP-positive area in the ventral spinal cord of control, SOD1, and SOD1 + KDS mice. r Quantification of NeuN intensity in the ventral spinal cord. The data are presented as the means ± s.e.m. *P < 0.05, **P < 0.01, ***P < 0.001; ****P < 0.0001; ns not significant. Additional statistics are provided in Supplementary Table 8
Fig. 5
Fig. 5
Hbβ is decreased in the hippocampus of AD patients and in the SNpc of PD patients. a Representative images of postmortem hippocampal tissues for GFAP and Hbβ in normal subjects and AD patients (N = 3 per group; n values indicate cell numbers; scale bar, 20 μm). b Quantification of Hbβ intensity in the GFAP-positive area across hippocampal subregions. c Schematic timeline of APP/PS1 mice treated with KDS12025 (3 mg/kg/day; drinking ad libitum), followed by behavior tests. d Representative Lattice-SIM images of the hippocampus for GFAP and Hbβ in WT, APP, and APP + KDS mice (n = 3 mice per group). Representative 3D images from Imaris software (green, GFAP; magenta, Hbβ) and Sholl analysis (circles) are shown. Scale bars, 20 μm (main); 10 μm (Imaris). e Mean Hbβ intensity in GFAP-positive areas in the hippocampus. f Mean GFAP intensity in GFAP-positive areas. gi The summary graph shows the sum of intersections, the ramification index, and the ending radius in Sholl analysis. j The number of intersections relative to their distance from the center (*** indicates WT vs. APP; ### indicates APP vs. APP + KDS). k Schematic diagram of spike probability measurements and representative traces of evoked EPSPs from perforant pathway stimulation in WT, APP, and APP + KDS mice (n = 2 mice per group). l Spike probability across stimulation intensities (100–1000 μA) (left) and comparison of spike probability at 300 μA (right). m Transfer latency to enter the dark chamber in the PAT for WT, APP, and APP + KDS mice (N = 6 mice per group). n Discrimination index in the NPR test for WT, APP, and APP + KDS mice. o Representative confocal images of the SNpc region with the ipsilateral and contralateral sides for GFAP, GABA, and TH in control, A53T, and A53T + KDS12025 mice. Representative 3D images from Imaris software (magenta, GFAP; green, TH; cyan, Hbβ). Scale bars, 20 μm (left); 10 μm (right). Mean intensity of Hbβ in the GFAP-positive (p) and TH-positive areas (q) in the SNpc (ctr: control, ipsi: ipsilateral, con: contralateral). Data are presented as the means ± s.e.m. *P < 0.05, **P < 0.01, ***,###P < 0.001; ns not significant. Additional statistics are provided in Supplementary Table 8
Fig. 6
Fig. 6
Hbβ is necessary for the action of KDS12025. a Representative superresolution microscopy image showing Hbβ expression and gene silencing in cultured astrocytes transfected with the AAV-Hbβ-shRNA or AAV-Sc-shRNA vector. b Quantification of Hbβ expression specifically in DAPI-negative nucleolus regions in Sc- and Hbβ-shRNA-transfected astrocytes. c Relative levels of ROS, including H2O2, in Sc- or Hbβ-shRNA-transfected astrocytes treated with vehicle, Aβ, or Aβ + KDS12025 (10 μM). The “#” symbol (red) indicates differences in Aβ-induced H2O2 between Sc-shRNA and Hbβ-shRNA (n values indicate the number of wells). d Continuous live-cell H2O2 imaging using oROS-G in response to Aβ (5 μM) treatment, with KDS12025 (0.1, 1, or 10 μM) in Sc- or Hbβ-shRNA. e Comparison of oROS-G intensity between the Sc-shRNA and Hbβ-shRNA groups with KDS treatment (n indicates the number of cells). f Schematic timeline of the injection of AAV-pSicoR-Hbβ (or Sc)-shRNA into the CA1 hippocampus of APP/PS1 mice. g Discrimination index in the NPR test across the groups (n = 6 mice per group). h Quantification of Hbβ intensity in GFAP-positive areas (n indicates cell numbers; 3 mice per group; representative images in Supplementary Fig. 16). Quantification of the GFAP-positive area (i) and GFAP intensity (j). k Schematic timeline of the injection of AAV-pSico-Hbβ (or Sc)-shRNA combined with AAV-GFAP- (or CaMKII-) Cre virus into the CA1 hippocampus of APP/PS1 mice. l Discrimination index from the NPR test across the groups (n = 4 mice per group, CaMKII; n = 3). m Quantification of Hbβ intensity in GFAP-positive areas (n indicates cell numbers; 3 mice per group; representative images in Supplementary Fig. 17). GFAP-positive area (n) and GFAP intensity (o) quantification. p Schematic timeline of the injection of AAV-pSico-Hbβ (or Sc)-shRNA combined with AAV-GFAP- (or CaMKII-) Cre virus into the SNpc of A53T mice. q Schematic diagram of the rotarod test and latency-to-fall test of A53T+Sc::GFAP, A53T+Sc::GFAP + KDS, A53T+Sh::GFAP + KDS, and A53T+Sh::CaMKII+KDS mice. r, s Quantification of the GFAP-positive area and number of TH-positive neurons per hemisphere in the SNpc (representative images in Supplementary Fig. 18). The data are presented as the means ± s.e.m. *P < 0.05, **P < 0.01, ***P < 0.001; ns not significant. Additional statistics are provided in Supplementary Table 8
Fig. 7
Fig. 7
Broad effects of KDS12025. a Schematic timeline of aging evaluation and KDS12025 treatment (0.1, 1 mg/kg/day; drinking ad libitum) administered from 14 to 36 months (158 weeks, humane endpoint). Arrows indicate the behavior assessments or sacrifice periods. b Survival probability curves for the aged control and control+KDS12025 groups (0.1 and 1 mg/kg). The red arrow indicates the starting point of drug administration (N = 15 mice per group). c, d Evaluation of locomotor activity in terms of velocity and distance traveled by young and old (26-month-old) mice treated with KDS12025. e Representative hippocampal CA1 images of NeuN and GFAP in control (18- and 30-month-old) and KDS12025-treated (1 mg/kg/day, 30 months old) mice (N = 4 mice per group; scale bar, 20 μm). f Quantification of NeuN-positive neurons in the CA1 pyramidal layer, calculated as NeuN intensity × neuron number (n indicates mouse number). g Quantification of the GFAP-positive area (n indicates the number of cells). h Representative Sholl analysis of astrocytes across groups. Sum of intersections (i) and number of intersections (j) from Sholl analysis. k Representative images of hippocampal astrocytic Hbβ expression in control mice at 18 months and 30 months (control and KDS12025 treatment) (scale bar, 10 μm). l Quantification of age-dependent astrocytic Hbβ expression in the hippocampus. Data are presented as the means ± s.e.m. *P < 0.05, **P < 0.01, ***,###P < 0.001; ns not significant. Additional statistics are provided in Supplementary Table 8

References

    1. Bulters, D. et al. Haemoglobin scavenging in intracranial bleeding: biology and clinical implications. Nat. Rev. Neurol.14, 416–432 (2018). - PubMed
    1. Altinoz, M. A. et al. Involvement of hemoglobins in the pathophysiology of Alzheimer’s disease. Exp. Gerontol.126, 110680 (2019). - PubMed
    1. Biagioli, M. et al. Unexpected expression of alpha- and beta-globin in mesencephalic dopaminergic neurons and glial cells. Proc. Natl. Acad. Sci. USA106, 15454–15459 (2009). - PMC - PubMed
    1. Agyemang, A. A. et al. Cell-free oxidized hemoglobin drives reactive oxygen species production and pro-inflammation in an immature primary rat mixed glial cell culture. J. Neuroinflamm.18, 42 (2021). - PMC - PubMed
    1. Codrich, M. et al. Neuronal hemoglobin affects dopaminergic cells’ response to stress. Cell Death Dis.8, e2538 (2017). - PMC - PubMed

MeSH terms