. 2025 Aug 22;16(1):7852.
doi: 10.1038/s41467-025-62751-5.

Episodic transport of protein aggregates achieves a positive size selectivity in aggresome formation

Affiliations

Episodic transport of protein aggregates achieves a positive size selectivity in aggresome formation

Rui Fang et al. Nat Commun. .

Abstract

Eukaryotic cells direct toxic misfolded proteins to various quality control pathways based on their chemical properties and aggregation status. Aggregated proteins are targeted to selective autophagy or specifically sequestered into the "aggresome", a perinuclear inclusion at the microtubule-organizing center (MTOC). However, the mechanism for selective aggresome recruitment remains unclear. To investigate this process, here we reconstitute MTOC-directed aggregate transport in Xenopus laevis egg extract using AgDD, a chemically inducible aggregation system. High-resolution single-particle tracking reveals that dynein-mediated aggregate transport is highly episodic, with average velocity positively correlating with aggregate size. Mechanistic modeling suggests that recurrent formation of the dynein transport complex biases larger aggregates towards active transport, compensating for the slowdown due to viscosity. Both episodic transport and positive size selectivity are conferred by aggresome-specific dynein adapters. Coupling an aggresome adapter to polystyrene beads recapitulates positive size selectivity in transport, while recruiting conventional dynein adapters to protein aggregates perturbs aggresome formation and reverses the size selectivity.


Conflict of interest statement

Competing interests: The authors claim no competing interests.

Figures

Fig. 1
Fig. 1. AgDD aggregates are selectively transported into the aggresome.
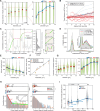
A Schematic and representative live-cell confocal images of AgDD aggresome formation. 10 μM FKBP(F36V) was added to HEK293T cell culture stably expressing AgDD-sfGFP (AgDD) to deplete Shield-1. Representative cells with a high AgDD expression level that formed aggresomes after Shield-1 removal and cells with a low AgDD expression level that did not form detectable aggresomes were selected from the same field-of-view (FOV). B Colocalization analysis of AgDD with aggresome markers in cells with high AgDD and low AgDD levels. AgDD (green)-expressing U2OS cells were fixed and stained with anti-vimentin (red) and anti-pericentrin (magenta) antibodies, 4 h after Shield-1 removal. DNA was stained with DAPI (blue). Experiments were performed once using U2OS cells and once using HEK293T cells, with similar results. C Effects of drug treatment on aggresome formation. HEK293T cells stably expressing AgDD and H2B-mCherry were treated with 20 μM Nexturastat A, 10 μM MLN7243, or 1 μg/mL colchicine for 30 min before Shield-1 removal to induce aggresome formation, and imaged using a confocal microscope. The fraction of cells that had completed aggresome formation, as indicated by the sequestration of all peripheral aggregates into a single perinuclear punctum, was determined at the indicated time points. Error bars represent the standard error of the mean (SEM) over four randomly chosen FOVs; n: number of cells analyzed. P-values were determined by an unpaired two-tailed Student’s t-test as indicated. Below: representative images under each condition with AgDD (green) and H2B (red) channels, 8 h after Shield-1 removal. D Correlation between AgDD aggregation and aggresome formation. AgDD-expressing HEK293T cells were induced by Shield-1 removal with or without 1 μM bortezomib (BTZ) and subjected to time-lapse imaging at 10 min per frame for 4 h. Randomly chosen cells under each condition were classified according to the change of AgDD distribution during the time-lapse. D, diffusive AgDD signal; P, peripheral AgDD aggregates; A, AgDD aggresome. Cells with high (>2.5 μM) and low (<2.5 μM) initial AgDD levels were counted separately. Error bars represent SEM over 4 FOVs; n: number of cells analyzed. Representative images are shown in (E), with aggresomes indicated by arrowheads. F Degradation of diffusive AgDD upon Shield-1 removal. The diffusive AgDD signal was determined in the aggresome-free cells (“D → D” in (D)) during the time-lapse, normalized by the initial AgDD intensity right after Shield-1 removal (t = 0). Line shading represents SEM over n cells analyzed. G Live-cell confocal images of U2OS cells 3 h after Shield-1 removal, overlaid with trajectories of individual AgDD aggregates whose initial positions were marked with filled circles. Cells were treated with 1 μg/mL colchicine or DMSO for 30 min before aggresome induction and imaged once per minute. Nuclear contours were marked with white dashed lines. H The relationship between the MTOC-directed velocity and the diameter of AgDD aggregates. The MTOC-directed velocities of individual aggregates were determined frame-by-frame, and correlated with the aggregate diameter at each time point in a violin plot (n = 10286 velocity-diameter pairs from four cells). Positive velocity values represent movement towards the MTOC. Error bars in the zoom-in plot (left) represent the SEM within each size group. Source data are provided as a Source data file. I Live-cell confocal images of MCF10A cells stably expressing GFP-tagged synphilin 1 (synph-GFP) after treatment with 100 nM MG132. Cells were imaged once per minute. J The relationship between the MTOC-directed velocity and the intensity of synph-GFP aggregates. The MTOC-directed velocities of individual aggregates were determined frame-by-frame, and correlated with the aggregate intensity at each time point in a violin plot as in (H) (n = 180934 velocity-intensity pairs from 16 cells). Source data are provided as a Source data file.
Fig. 2
Fig. 2. Reconstitution of dynein-dependent transport of AgDD aggregates in Xenopus laevis egg extract (XE).
A Schematic and wide-field images of the aggregate transport assay. Recombinant AgDD (green) was induced to aggregate in XE and 1:20 diluted into a working XE containing Alexa647-labeled microtubule asters (magenta) and imaged in a 1 cm × 1 cm × 20 μm customized chamber once per minute for 30 min at 18 °C. Experiments were performed 10 times independently with similar results. B Example trajectories of AgDD aggregates. Measurement was performed as in (A), with or without 40 μg/mL CC1 to inhibit dynein-dynactin in XE. Aggregates were randomly selected and colored by diameter. The MTOC was marked with an empty red circle at the center. Among the 100 trajectories from the untreated group, Trajectories of the 10 largest and the 10 smallest aggregates are plotted in (C) (mean diameter ± standard deviation in legend), with the averaged trajectories shown as thick lines. D The relationship between the time-averaged transport velocity and diameter of individual aggregates. The average velocity of individual aggregates was calculated as the total travel distance towards the MTOC divided by the trajectory’s duration (illustrated in (E)). The velocities of individual aggregates were grouped by their diameter in the violin plot. Right: a zoom-in plot showing the mean ± SEM within each group. A total of 1152 (n) aggregates around 16 microtubule asters from 2 batches of XE were included in the analysis. Source data are provided as a Source data file. E An example trajectory of AgDD aggregate to illustrate the result of trajectory segmentation. “Pause” and “Transport Engaged (TE)” segments were colored in pink and green respectively. F The relationship between aggregate diameter and lengths of the pause and the TE segments, shown as mean ± SEM within each size group. 851 (n) trajectories from the experiment in (D) that are longer than 15 min were selected and segmented as illustrated in (E). TE (+): transport-engaged segment when the aggregate moves towards the MTOC; TE (-): transport-engaged segment when the aggregate moves away from the MTOC. G The relationship between the aggregate diameter and the proportion of the pause segment, determined using the data in (F). The plot shows the mean proportion ± SEM within each size group. H Aggregates’ diffusion constants during pauses, with or without 40 μg/mL CC1 in XE. Indicated numbers (n) of aggregates that could be tracked for at least 15 min were selected and grouped by their diameters. Diffusion constants during pause were calculated as described in the methods and plotted against the inverse of the mean diameter within each size group. The dashed line represents the prediction by the Stokes-Einstein law as kBT/(3πηd), where d is the aggregate diameter, η is the dynamic viscosity of XE (0.01 Pa·s), kB is the Boltzman constant, and T is 291 Kelvin. Data are presented as mean values ± SEM.
Fig. 3
Fig. 3. Positive size selectivity in aggregate transport originates from a size-dependent increase in the likelihood of engaging in active transport.
A The relationship between the time-averaged velocity and the diameter of individual aggregates, presented in a violin plot with a zoom-in axis on the right. 799 trajectories around 6 microtubule asters were acquired at 30 frames per second for 120 s. Error bars represent the SEM within each size group. Source data are provided as a Source data file. B Example trajectories of AgDD aggregates. Data were from the experiment in (A). Trajectories of the 10 largest (top 2%) and the 10 smallest (bottom 2%) aggregates are plotted as faint lines (mean diameter ± standard deviation in legend). The averaged trajectories of the large and the small groups are shown as thick lines. C An example trajectory of AgDD aggregate to illustrate the result of trajectory segmentation. “Pause”: pink; “Transport (+)”: moving towards the MTOC, green; “Transport (-)”: moving away from the MTOC, blue. The instantaneous velocity was calculated as the time derivative using a 2-s rolling time window, overlaid (gray curve) on the right axis, and the probability density is shown on the side. Zoom-in windows of the shaded regions, marked by T1, T2 and T3, are shown on the right. D The probability densities of instantaneous velocities of AgDD aggregates calculated as in (C) using only the “Transport (+)” segments. 799 trajectories from (A) were divided into three groups by aggregates’ diameter: <1 μm (0–33 percentile); 1–1.4 μm (33–66 percentile); > 1.4 μm (66–100 percentile). The probability density of the entire population is overlaid as gray bars. Inset: a view with a local y-axis. E The relationship between the intrinsic velocity and the diameter of AgDD aggregates, presented in a violin plot. Intrinsic velocity was defined for each aggregate as the mean of the top 20% of instantaneous velocities calculated as in D. The mean intrinsic velocity within each size group was plotted against the inverse of the aggregate diameter in (F). Similar results were obtained using the top 10% and top 50% of instantaneous velocities in the definition of intrinsic velocity. Error bars represent the SEM in each group. Data were from the experiment in (A). G The relationship between the proportion of the transport segment and the diameter of AgDD aggregates in a violin plot. Trajectories in (A) were grouped by size and segmented into transport (+/-) and pause segments as illustrated in (C) (Methods). The mean proportion within each size group is highlighted on the right. Error bars represent the SEM in each group. H Probability densities of the lengths of pause and transport segments. Trajectories of the largest 10% and the smallest 10% aggregates in (A) were included in the analysis. The mean and median values of the segment lengths are labeled on the top panel. Lower panel: time constants for the large aggregates (0.77 ± 0.03 s and 7.24 ± 3.12 s at the 95% confidence level) and the small aggregates (0.76 ± 0.04 s and 27.79 ± 14 s) were from fitting their pause length distributions with a double exponential function. The red and green lines represent the two exponential modes of the large aggregates in a semi-log plot. Inset: ratio of the pause length distribution of the small aggregates over that of the large aggregates. The statistical significance of the difference between groups of large and small aggregates was calculated using a Student’s two-tailed t-test (*p = 0.036; ****p = 1×10¹⁶). I The relationship between the diffusion constants of AgDD aggregates during pause and the pause length. The apparent diffusion constant during each pause segment was calculated based on a linear regression of the mean square displacement on time, grouped by the pause length, presented in a violin plot. For each group, the median values of the pause length and diffusion constant are labeled next to the distribution, and the error bars represent the first and third quartiles. The statistical significance of the difference between groups was calculated using a Student’s one-tailed t-test (ns: p = 0.16; **p = 0.01; ****p = 2×10⁻¹¹). Data were from the experiment in (A).
Fig. 4
Fig. 4. Aggresome adapters mediate dynein-dependent transport in Xenopus laevis egg extract (XE).
A schematic workflow for studying the transport of adapter-coated beads in XE. Different adapters were immunoprecipitated from HeLa S3 extract using Dynabeads. Adapter-coated beads were incubated in interphase XE with Alexa647-labeled microtubule asters (cyan), imaged every 1 min for 30 min at 18 °C. Representative images from an experiment with chaperonin (CCT) coated beads (red) are shown on the right. Experiments were performed two times independently with similar results. B The averaged trajectories of different factor-coated beads in XE. Experiments were performed as described in (A), except that HOOK2 was immunoprecipitated from XE using Dynabeads as a positive control. Transport of AgDD aggregates (AgDDagg) was included for comparison. Line shading represents SEM. n: number of trajectories. C Transport segment length distribution for beads coated with indicated factors in a violin plot. Experiments were performed as in (A), but acquired at 30 frames per second for 120 s. The distributions of the transport segment proportion and the intrinsic velocity are presented in (D) and (E), respectively. Intrinsic velocity was defined as the mean of the top 20% of instantaneous velocities as in Fig. 3E. n: number of trajectories. F The average velocity of beads with different surface density of HDAC6. Beads were prepared as described in (A), but using anti-HDAC6 antibody diluted with random IgG at the indicated ratios (%). The XE transport assay was performed as described in (A), but using Tau-mCherry to label microtubules. Average velocities of individual particles were calculated as in Fig. 2D and are displayed in a violin plot with mean values indicated. n: number of trajectories. G Positive size selectivity for HDAC6-coated beads. Fluoresbrite® YG Carboxylate Microspheres with 1 μm or 0.5 μm diameter were passivated with PEG and then coated with HDAC6 (see Methods) or left untreated (“PEG only”). Transport assay and data analysis were performed as described in (F). n: number of trajectories. Representative images of HDAC6-coated beads at 30 min into the transport assay are shown in (H) (experiments were performed two times independently with similar results).
Fig. 5
Fig. 5. Dynein’s activating adapters HOOK2 and HOOK3 are associated with a negative size selectivity in aggregate transport.
A Anti-GFP western blot of U2OS cells stably expressing AgDD (41 kDa), AgDD-HOOK2 (124.5 kDa) and AgDD-HOOK3 (124.4 kDa). Blot was reprobed with anti-GAPDH antibody as the loading control. Source data are provided as a Source data file. Experiment was performed one time. B Schematic and live-cell confocal images of U2OS cells stably expressing AgDD (top) or AgDD-HOOK2 (bottom), before and after Shield-1 removal. Peripheral aggregates were identified by TrackMate and circled in yellow at “10 min” as an example where 55 particles were identified in the AgDD cell, and 2 in the AgDD-HOOK2 cell. C Classification of the aggregation-to-aggresome phenotypes, presented as in Fig. 1D. Bar plot shows the mean ± SEM, over 4 different FOVs. n: number of cells analyzed. D, P, and A are defined as in Fig. 1D. A0: perinuclear puncta detected in the presence of Shield-1. Inset: cellular GFP signal in the analyzed AgDD and AgDD-HOOK2 cells before Shield-1 removal. P-value > 0.2 by an unpaired Student’s two-tailed t-test. Boxplot shows mean (“x”), median (-), first and third quartiles; upper/lower whiskers extend to 1.5 × the interquartile range. D The relationship between the mean MTOC-directed velocity and the aggregate diameter, as presented in Fig. 1H. Error bars represent the SEM within each size group. Source data are provided as a Source data file. E Probability distributions of the MTOC-directed displacement over 1 min of AgDD, AgDD-HOOK2, and AgDD-HOOK3 aggregates in the experiment in (D). Dashed red lines mark the mean values.
Fig. 6
Fig. 6. A physical model of dynein-mediated transport suggests the stability of the active transport complex determines cargo size selectivity.
A Schematic of the dynein transport model. See text for details. The transport complex formed by cargo, dynein, and microtubule is labeled on the graph. vC: intrinsic velocity of dynein transport. B Diagram showing the proposed mechanism that determines the size selectivity in cargo transport when the transport complex has low or high stability. The scaling of the average transport velocity v0 as a function of cargo diameter d was derived under two scenarios: (1) When the transport complex is transient or has low stability, v0 changes in proportion to αd1.5, which gives rise to PSS. α is the probability of the freely-diffusing state as a function of d (Fig. 2G); (2) When the transport complex has high stability, v0 changes in proportion to (1α)d1, which gives rise to NSS. Expressions were derived based on an analytical model of the system (see Methods for details). C Comparison of the model predictions with experimental measurements. v0 and α were obtained from the experiments as in Fig. 2D (n = 1154 aggregates), Fig. 2G (n = 851 aggregates). Experimental results are replotted as the mean ± SEM of either v0/α (blue, left axis, by the low-stability expression) or v0/(1α) (red, right axis, by the high-stability expression), against d in a log-log plot. Blue line represents the linear regression using the low-stability expression with the fitted slope k 1.36 and correlation coefficient r 0.96. The red dashed line is the best-fitting result by the high-stability expression (slope = −1). Source data are provided as a Source data file. D Stochastic simulation of size selectivity in dynein-mediated transport. Simulated average transport velocity, v0, of single particles with different diameters when the stability of the transport complex was set to low (p6 = 0.1; see Methods). Data are presented as empty circles connected by dashed lines and replotted as v0/α against diameter, with a linear regression fit (slope k) displayed in the log-log plot in (E). Simulation was performed using a numerical model of (B) (see Methods for details). F Stochastic simulation results when the stability of the transport complex was set to high (p6 = 0.0001), presented as in (D). Data are replotted as v0/(1α) against diameter in (G). H Stochastic simulation results by continuously varying the transport complex stability parameter p6 from 0.0001 to 0.1, denoting a decrease in stability (color-coded from red to blue). Data are presented as a surface plot, with white lines overlaid to indicate the velocity-diameter relationship at different p6 values.

Update of

References

    1. Labbadia, J. & Morimoto, R. I. The biology of proteostasis in aging and disease. Annu. Rev. Biochem.84, 435–464 (2015). - PMC - PubMed
    1. Brundin, P., Melki, R. & Kopito, R. Prion-like transmission of protein aggregates in neurodegenerative diseases. Nat. Rev. Mol. Cell Biol.11, 301–307 (2010). - PMC - PubMed
    1. Johnston, H. E. & Samant, R. S. Alternative systems for misfolded protein clearance: life beyond the proteasome. FEBS J. 10.1111/febs.15617 (2020). - PubMed
    1. Johnston, J. A., Ward, C. L. & Kopito, R. R. Aggresomes: a cellular response to misfolded proteins. J. Cell Biol.143, 1883–1898 (1998). - PMC - PubMed
    1. Olanow, C. W., Perl, D. P., DeMartino, G. N. & McNaught, K. S. P. Lewy-body formation is an aggresome-related process: a hypothesis. Lancet Neurol.3, 496–503 (2004). - PubMed

LinkOut - more resources