. 2025 Aug 22;16(1):7827.
doi: 10.1038/s41467-025-63146-2.

Targeting spermine metabolism to overcome immunotherapy resistance in pancreatic cancer

Affiliations

Targeting spermine metabolism to overcome immunotherapy resistance in pancreatic cancer

Hanshen Yang et al. Nat Commun. .

Abstract

While dysregulation of polyamine metabolism is frequently observed in cancer, it is unknown how polyamines alter the tumor microenvironment (TME) and contribute to therapeutic resistance. Analysis of polyamines in the plasma of pancreatic cancer patients reveals that spermine levels are significantly elevated and correlate with poor prognosis. Using a multi-omics approach, we identify Serpinb9 as a vulnerability in spermine metabolism in pancreatic cancer. Serpinb9, a serine protease inhibitor, directly interacts with spermine synthase (SMS), impeding its lysosome-mediated degradation and thereby augmenting spermine production and secretion. Mechanistically, the accumulation of spermine in the TME alters the metabolic landscape of immune cells, promoting CD8+ T cell dysfunction and pro-tumor polarization of macrophages, thus creating an immunosuppressive microenvironment. Small peptides that disrupt the Serpinb9-SMS interaction significantly enhance the efficacy of immune checkpoint blockade therapy. Together, our findings suggest that targeting spermine metabolism is a promising strategy to improve pancreatic cancer immunotherapy.


Conflict of interest statement

Competing interests: The authors declare no competing interests.

Figures

Fig. 1
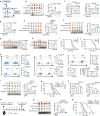
Fig. 1. Spermine and Serpinb9 are associated with pancreatic tumor progression and poor prognosis.
a Quantification of polyamines in plasma from healthy individuals (n = 10), PR (n = 20) patients, and PD patients (n = 8) with PDAC. b OS of PDAC patients with high or low plasma spermine concentrations (n = 40 patients). c Correlation between spermine levels in TIF and intratumoral CD8+ T cells (n = 40 patients). d Intersection of differentially expressed genes from four pancreatic cancer datasets with T cell dysfunction-related genes. e Extracellular relative spermine levels in BxPC-3 cells after the top seven genes knockdown (n = 3 biologically independent samples). f Positive correlation between Serpinb9 expression and spermine levels in PDAC patients (n = 40 patients). g Representative staining and negative correlation between Serpinb9 expression and CD8+ T cell infiltration in PDAC tissues (n = 40 patients). Scale bars: 50 μm. H-score: histological score. h Uniform manifold approximation and projection (UMAP) of scRNA-seq from PDAC tumors showing 10 clusters. i Dot plot of canonical marker expression in each cluster. j Representative UMAP plot displaying the distribution of Serpinb9 expression in tumor versus normal tissues. k Quantification of Serpinb9 in different cell types, including ductal, T, myeloid, and CAFs. l Representative staining of Serpinb9, pan-CK, CD3, CD68, and ASMA in tumor and paired normal tissues. m Quantification of Serpinb9 in different cell types (n = 7 patients). n, o Association between Serpinb9 expression and tumor grade or TNM stage (n = 148 patients). p OS of all patients with pancreatic cancer, stratified by high versus low Serpinb9 expression (n = 112 patients). q, r OS (q), and disease-specific survival (DSS) (r) of pancreatic cancer patients in TCGA, based on Serpinb9 expression. For a, e, k, m, n, and o, data were presented as mean ± S.D. For b and pr data were generated using Kaplan-Meier survival curves based on log-rank tests. For c, f, and g Spearman correlations and P values were calculated using a two-sided Spearman’s test. Statistical significance was determined using two-sided unpaired Student’s t-test or one-way ANOVA followed by Tukey’s post hoc test. Box plots show the median (center line), 25th–75th percentiles (box), and whiskers (1.5×IQR range). Source data are provided as a Source Data file.
Fig. 2
Fig. 2. Interaction between Serpinb9 and SMS prevents SMS migration into the lysosome.
a KEGG enrichment analysis of differentially expressed proteins in Serpinb9 KD vs. Serpinb9 NC KPC cells (n = 3 biologically independent samples). b Western blotting analysis of proteins within three metabolic pathways in Serpinb9 NC and KD KPC cells. c Correlation analysis of Serpinb9 and SMS expression in PDAC tissue microarrays (n = 148 patients). d Co-IP and western blotting analysis showing the interaction between HA-tagged SMS and Flag-tagged Serpinb9. e GST-pull-down assay of SMS-His and Serpinb9-GST proteins. f Duolink immunofluorescence images of Serpinb9-SMS interaction in KPC and BxPC-3 cells; red dots indicate interaction. Scale bars: 10 μm. g The predicted complex of the Serpinb9 (blue) and SMS (pink), showing the relative binding free energy difference (ΔΔG) from alanine scanning of crucial residues in Serpinb9 (n = 10 biologically independent samples). h Co-IP and quantification of SMS binding to wild-type or mutant Serpinb9 (F336A; E306A/R307A/D308A). i SMS stability in Serpinb9 NC and KD KPC cells after CHX treatment (200 μg/mL). j SMS levels in KPC cells treated with MG132 (5 μM, 12 h) or CQ (50 μM, 12 h). k Representative images and quantification of lysosomes in KPC cells (n = 5 biologically independent samples). Scale bars: 0.5 μm. l SMS distribution in Serpinb9 NC vs. KD cells via confocal microscopy. Scale bar: 25 μm. m SMS expression in CQ-treated NC and KD cells. n Co-IP of HA-tagged SMS in KPC cells. o SMS interaction with Lamp2A in Serpinb9 NC vs. KD cells. p Schematic and binding free energy of Serpinb9 and Lamp2A competitively binding to SMS (n = 50 biologically independent samples). For h, i, j, m, o data were presented as mean ± S.D., n = 3 biologically independent samples. For k data were presented as mean ± S.D., n = 5 biologically independent samples. For g data were presented as mean ± S.D., n = 10 biologically independent samples. For p, data were presented as mean ± SEM, n = 50 independent samples. For c Spearman correlations and P values were calculated using a two-sided Spearman’s test. Statistical significance was determined using two-sided unpaired Student’s t-test or one-way ANOVA followed by Tukey’s post hoc test. NS, no significance. Source data are provided as a Source Data file.
Fig. 3
Fig. 3. Spermine enhances pancreatic tumor progression and immunotherapy resistance.
a Diagram of the polyamine metabolic synthesis pathway. b Photographs and weights of tumors from each group (n = 5 mice). c IHC quantification of CD8+ and GZMB+ cells (n = 5 mice). d Spermine concentrations in TIF from tumors (n = 5 mice). e Photographs and tumor weights of orthotopic tumors from mice implanted with Serpinb9-KO KPC cells, with or without spermine (n = 5 mice). f Photographs and tumor weights from mice with or without CD8+ T cell depletion, inoculated with Serpinb9-overexpressing tumor cells (n = 5 mice). g, h Photographs and weights of KPC orthotopic pancreatic tumors from C57BL/6 J and nude mice treated with saline or spermine (10 mg/kg) (n = 7 mice). i, j Survival of KPC-bearing C57BL/6 J and nude mice treated with saline or spermine (n = 10 mice). k Representative images and statistical results of CD8+ T cells, GZMB+CD8+ T cells, IFN-γ+CD8+T cells, Ki67+CD8+T cells, Tregs, and flow cytometric analysis of PD-1+CD8+ T cells, CD80+TAMs, CD206+TAMs, and PD-L1+ TAMs (n = 7 mice). l Tumor photographs and weights from mice treated with SPM, αPD-1 (100μg/mouse), or combination (n = 5 mice). m Survival of mice treated with SPM, αPD-1, or combination (n = 8 mice). n Flow cytometric analysis of CD8 + T cells and GZMB + CD8 + T cells (n = 5 mice). o Schematic of the protocol of SMS knockout combined with αPD-1 therapy in orthotopic KPC SMS NC and SMS KO cells (5 × 10⁵)-bearing mice. p Tumor photographs and weights from each group (n = 5 mice). q Survival of mice in each group (n = 10 mice). For bf, l, n, and p, data were presented as mean ± S.D., n = 5 biologically independent samples. For g, h, and k data were presented as mean ± S.D., n = 7 biologically independent samples. For i, j, m, and q data were generated using Kaplan-Meier survival curves based on log-rank tests. Statistical significance was determined using two-sided unpaired Student’s t-test or one-way ANOVA followed by Tukey’s post hoc test. NS, no significance. o was created in part with BioRender. Hanshen, Y. (https://BioRender.com/nfthfna). Source data are provided as a Source Data file.
Fig. 4
Fig. 4. Spermine-induced metabolic reprogramming and functional dysregulation of CD8+ T cells.
a Differential energy metabolism-related metabolites in CD8+ T cells treated with spermine (n = 3 biologically independent samples per group). b GSEA plots of mTORC1 and OXPHOS signaling based on RNA-seq of CD8+ T cells treated with spermine (n = 3 biologically independent samples per group). c Western blotting of mTOR, p-mTOR, S6K, pS6K, 4EBP1, and p-4EBP1 levels in CD8+ T cells treated with spermine (2 μM, 24 h). d Flow cytometric analysis of Ca²+ levels in the cytoplasm of CD8+ T cells. (n = 3 biologically independent samples). e Flow cytometric analysis of Ca²+ levels in the mitochondria of CD8+ T cells. (n = 3 biologically independent samples). f Representative images and quantification of mitochondria in CD8+ T cells (n = 5 biologically independent samples). Scale bars: 0.5 μm. g Representative images and quantification of MitoSOX in CD8+ T cells treated with spermine (n = 3 biologically independent samples). Scale bars: 8 μm. h Representative images and quantification of JC-1 in CD8+ T cells treated with spermine (n = 3 biologically independent samples). Scale bars: 8 μm. i Quantification of ATP levels in CD8+ T cells treated with spermine (n = 3 biologically independent samples). j OCR data of CD8+ T cells treated with spermine (n = 3 biologically independent samples). k ECAR data of CD8+ T cells treated with spermine (n = 3 biologically independent samples). l Representative images and quantification of apoptosis in CD8+ T cells treated with spermine (n = 3 biologically independent samples). m CFSE images and quantification of CD8+ T cells treated with spermine (n = 3 biologically independent samples). n Flow cytometric analysis of Ki67, PD-1, Granzyme B, IFN-γ, TNF-α, and Perforin in CD8+ T cells treated with spermine (n = 3 biologically independent samples). For c n = 3 biologically independent samples. For f, data were presented as mean ± S.D., n = 5 biologically independent samples. For d, e, and gn data were presented as mean ± S.D., n = 3 biologically independent samples. Statistical significance was determined using two-sided unpaired Student’s t-test or one-way ANOVA followed by Tukey’s post hoc test. Source data are provided as a Source Data file.
Fig. 5
Fig. 5. Spermine regulates the immunosuppressive function of TAMs through the TGF-β signaling pathway.
a Flow cytometric analysis of CD86, CD206, PD-L1, and RELMa in BMDMs and Raw cells treated with spermine (n = 3 biologically independent samples). b Flow cytometric analysis of Ca²+ levels in the mitochondria of BMDMs (n = 3 biologically independent samples). c GSEA plot of ETC and OXPHOS based on proteomic sequencing of BMDMs treated with spermine. d GSEA plot of purine metabolism based on proteomic sequencing of BMDMs treated with spermine. e Western blotting of ADA, GUK1, XDH, and IMPDH levels in BMDMs treated with spermine (10 μM, 24 h). f KEGG enrichment analysis of differentially expressed proteins in BMDMs treated with spermine, highlighting the top ten pathways (n = 3 biologically independent samples per group). g Western blotting of Smad2, p-Samd2, Smad3, and p-Smad3 levels in BMDMs treated with spermine (10 μM, 24 h). h Extracellular TGF-β levels in BMDMs treated with spermine (n = 3 biologically independent samples). i Schematic diagram illustrating the interaction between BMDMs and CD8 + T cells under the influence of spermine. j Flow cytometric analysis of CD206, PD-L1, and RELMa in BMDMs (n = 3 biologically independent samples). k OCR data of CD8+ T cells (n = 3 biologically independent samples). l CFSE images and quantification of CD8+ T cells (n = 3 biologically independent samples). m Flow cytometric analysis of Ki67, PD-1, GZMB, IFN-γ, TNF-α, and Perforin in CD8+ T cells (n = 3 biologically independent samples). For a, b, h, jm data were presented as mean ± S.D., n = 3 biologically independent samples. For e and g, n = 3 biologically independent samples. Statistical significance was determined using two-sided unpaired Student’s t-test or one-way ANOVA followed by Tukey’s post hoc test. Panel i was created in part with BioRender. Hanshen, Y. (https://BioRender.com/rbvmrne). Source data are provided as a Source Data file.
Fig. 6
Fig. 6. Enhancing antitumor immunity with Serpinb9 deficiency and ICB combination therapy.
a Serpmine concentrations in TIF from Serpinb9 NC and Serpinb9 KD KPC tumors (n = 5 mice). b, c Tumor growth curves of Serpinb9 NC and Serpinb9 KD KPC tumors from immunocompetent (b) and immunodeficient mice (c) (n = 5 mice). d, e Survival of Serpinb9 NC and Serpinb9 KD KPC-bearing immunocompetent (d) and immunodeficient mice (d) (n = 10 mice). f Schematic of the protocol for CD8+ T cells depletion in orthotopic KPC (5 × 10⁵)-bearing mice receiving combination therapy. g Tumor photographs and weights from each mouse group (n = 5 mice). h Flow cytometry and statistical analysis of CD8+ T cells in spleens (n = 5 mice). i Representative images and quantification of aSMA (upper) and Sirius red (lower) in Serpinb9 NC and Serpinb9 KD pancreatic cancer tissues (n = 5 mice). Scale bars: 100 μm (upper), 75 μm (lower). j Representative images of luminescence intensity change in tumors, with final day luminescence intensity (n = 3 mice). k Tumor weights from each mouse group (n = 5 mice). l Schematic of the protocol of Serpinb9 deficiency combined with αPD-1/αPD-L1 therapy in orthotopic KPC Serpinb9 NC and Serpinb9 KD tumor-bearing mice. m Tumor photographs and weights from each mouse group (n = 5 mice). n Survival of mice in each group (n = 7 mice). o Flow cytometric analysis of CD8+ T cells, Ki67+CD8+ T cells, GZMB+CD8+ T cells, IFN-γ+CD8+ T cells, and PD-1+CD8+ T cells (n = 5 mice). For ac, gk, m, and o, data were shown as the means ± SD., n = 5 biologically independent samples. For d, e, and n data were generated using Kaplan-Meier survival curves based on log-rank tests. Statistical significance was determined using two-sided unpaired Student’s t-test or one-way ANOVA followed by Tukey’s post hoc test. NS, no significance. f and l were created in part with BioRender. Hanshen, Y. (https://BioRender.com/nfthfna). Source data are provided as a Source Data file.
Fig. 7
Fig. 7. Serpinb9-mimic peptides targeting SMS treatment suppress pancreatic cancer progression and improve ICB efficacy.
a Computational design workflow for Serpinb9-mimic peptides targeting SMS. b Co-IP and western blotting analysis showing the interaction between HA-tagged SMS and Flag-tagged Serpinb9. c, d Heatmap of relative SMS levels in pancreatic cancer cell lines (BxPC-3, KPC) treated with a concentration and time gradient of Pep2 or Pep4. e Statistical analysis of relative extracellular spermine levels in BxPC-3 and KPC cells treated with Pep2 or Pep4 (n = 3 biologically independent samples). f Statistical analysis of relative SMS levels in KPC tumors treated with Pep4 (n = 5 mice). g Statistical analysis of relative spermine concentrations in TIF from KPC tumors treated with Pep4 (n = 5 mice). h, i Tumor growth curves and weights from mice treated with Pep4, αPD-1, or their combination (n = 5 mice). j Changes in body weights of mice in each group (n = 5 mice). k Representative t-SNE images and statistical results of CD8+ T cells by flow cytometry (n = 5 mice). l Representative mIHC staining and quantification of CD8, GZMB, CD206, and Foxp-3 (n = 5 mice). Scale bars = 20 μm. For bd, n = 3 biologically independent samples. For e data were presented as mean ± S.D., n = 3 biologically independent samples. For fl data were presented as mean ± S.D., n = 5 biologically independent samples. Statistical significance was determined using two-sided unpaired Student’s t-test or one-way ANOVA followed by Tukey’s post hoc test. Source data are provided as a Source Data file.
Fig. 8
Fig. 8. Graphic summary of this research.
Spermine levels are markedly elevated in the plasma of pancreatic cancer patients and correlate with poor prognosis. In tumor cells, Serpinb9 directly interacts with spermine synthase to hinder its lysosomal degradation, thereby augmenting the biosynthesis of spermine. Inhibiting Serpinb9 or its interaction with spermine synthase enhances the efficacy of pancreatic cancer immunotherapy. This Figure was created with BioRender. Hanshen, Y. (https://BioRender.com/dwim8mz).

References

    1. Siegel, R. L., Miller, K. D., Fuchs, H. E. & Jemal, A. Cancer statistics, 2022. CA Cancer J. Clin.72, 7–33 (2022). - PubMed
    1. Hu, Z. I. & O’Reilly, E. M. Therapeutic developments in pancreatic cancer. Nat. Rev. Gastroenterol. Hepatol.21, 7–24 (2024). - PubMed
    1. Topalian, S. L. et al. Neoadjuvant immune checkpoint blockade: a window of opportunity to advance cancer immunotherapy. Cancer Cell41, 1551–1566 (2023). - PMC - PubMed
    1. Sun, Q. et al. Immune checkpoint therapy for solid tumours: clinical dilemmas and future trends. Signal Transduct. Target Ther.8, 320 (2023). - PMC - PubMed
    1. O’Reilly, E. M. et al. Durvalumab with or without tremelimumab for patients with metastatic pancreatic ductal adenocarcinoma: a phase 2 randomized clinical trial. JAMA Oncol.5, 1431–1438 (2019). - PMC - PubMed

MeSH terms