. 2025 Aug 22;16(1):7854.
doi: 10.1038/s41467-025-62288-7.

Harnessing artificial intelligence to identify Bufalin as a molecular glue degrader of estrogen receptor alpha

Affiliations

Harnessing artificial intelligence to identify Bufalin as a molecular glue degrader of estrogen receptor alpha

Shilong Jiang et al. Nat Commun. .

Abstract

Target identification in natural products plays a critical role in the development of innovative drugs. Bufalin, a compound derived from traditional medicines, has shown promising anti-cancer activity; however, its precise molecular mechanism of action remains unclear. Here, we employ artificial intelligence, molecular docking, and molecular dynamics simulations to elucidate the molecular mechanism of Bufalin. Using an integrated multi-predictive strategy, we identify CYP17A1, ESR1, mTOR, AR, and PRKCD as the potential targets of Bufalin. Subsequent validation via surface plasmon resonance, biotin pulldown, and thermal shift assays confirms Bufalin's direct binding to ESR1, which encodes estrogen receptor alpha (ERα). Molecular docking analyses pinpoint Bufalin's selective interaction with Arg394 on ERα. Molecular dynamic simulations further show that Bufalin acts as a molecular glue, enhancing the interaction between ERα and the E3 ligase STUB1, thereby promoting proteasomal degradation of ERα. Given the therapeutic potential of ERα degradation in overcoming endocrine resistance, we investigate the inhibitory effect of Bufalin on endocrine-resistant models and prove Bufalin reverses Tamoxifen resistance in vitro, in vivo, and in patient-derived breast cancer organoids from tamoxifen-relapsed cases. Collectively, our findings indicate that Bufalin functions as a molecular glue to degrade ERα, offering a potential therapeutic strategy for reversing Tamoxifen resistance.


Conflict of interest statement

Competing interests: The authors declare no competing interests.

Figures

Fig. 1
Fig. 1. Exploring pharmacological mechanisms of Bufalin based on a combinatorial target screening strategy.
a The entire process of target prediction for Bufalin. b Venn diagram of predicted targets by four web servers and the FMBS method. c Bubble chart of KEGG enrichment analysis for 53 targets. d Chord diagram of pathways with statistically significant p-values and those corresponding to cancer, as retained by KEGG analysis. This diagram illustrates these pathways and their corresponding targets, leading to the selection of 11 key targets. e A multi-task neural network model was developed for these 11 targets, resulting in the identification of 5 high-confidence targets: CYP17A1, ESR1, mTOR, AR, and PRKCD.
Fig. 2
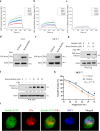
Fig. 2. Bufalin directly interacts with estrogen receptor α (ERα).
SPRi graph showing the interaction of Bufalin with ESR1 (a), PKC delta (b) and CYP17A1 (c) recombinant protein. d 293 T cell was transfected with ERα plasmid, after transfected 48 h, the cell lysates were incubated with D-Biotin or Biotin-Bufalin at 4 °C overnight, followed by pulling-down with streptavidin magnetic beads. The proteins bound to the magnetic beads were separated by SDS-PAGE, followed by western blot using ERα antibody. e MCF-7 cell lysates were incubated with D-Biotin or Biotin-Bufalin at 4 °C overnight, followed by pulling-down with streptavidin magnetic beads. The proteins bound to the magnetic beads were separated by SDS-PAGE, followed by western blot using ERα antibody. f 293 T cell was transfected with ERα plasmid, after transfected 48 h, the cell lysates were incubated with a series of concentrations of Biotin-Bufalin at 4 °C overnight, followed by pulling-down with streptavidin magnetic beads. The proteins bound to the magnetic beads were separated by SDS-PAGE, followed by western blot using ERα antibody. g 293 T cell was transfected with Flag-ERα plasmid, after transfected 48 h, the cells were incubated with Bufalin, then the cell lysates were incubated with Biotin-Bufalin at 4 °C, followed by pulling-down with streptavidin magnetic beads. The proteins bound to the magnetic beads were separated by SDS-PAGE, followed by western blot using Flag antibody. h The thermal shift assay experiment (CETSA) was used to evaluate the binding interaction between Bufalin and ERα, the data are presented as mean ± SD, n = 3 independent experiments. i. The cellular location of ERα and Biotin-Bufalin was examined by immunofluorescence staining in MCF-7 cells (Scale bar 5μm). Representative data are shown from n = 3 independent experiments with consistent results.
Fig. 3
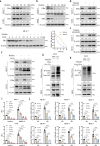
Fig. 3. Bufalin induces ERα degradation and suppresses its transcriptional activity.
a MCF-7 and T47D cells were treated with a series of concentrations of Bufalin for 48 h, and the expression of ERα was measured by western blot. b MCF-7 and T47D cells were treated with 50 nM Bufalin for different periods of time, and the expression of ERα was measured by western blot. c MCF-7 cells were treated with Bufalin, and then subjected to cycloheximide (CHX) (10 μg/ml) chase at the indicated time, the expression of ERα was measured by western blot. Representative data are shown from n = 3 independent experiments with consistent results. d MCF-7 and T47D cells were treated with Bufalin for 48 h with or without MG-132. The expression of ERα was measured by western blot. e MCF-7 and T47D cells were treated with Bufalin for 48 h in the presence or absence of MLN4924. The expression of ERα was measured by western blot. f MCF-7 and T47D cells were treated with Bufalin in the presence or absence of hydroxychloroquine (HCQ). The expression of ERα and LC3 was measured by western blot, the samples derive from the same experiment, and the gels/blots were processed in parallel. g 293 T cells were transfected with ERα plasmid and HA-Ub plasmid, and then subjected to Bufalin for 48 h, followed by treatment with MG-132 (10 μM) for 10 hours before harvest. Then the cells lysates were subjected immunoprecipitation with anti-ERα antibodies and blotted with anti-HA antibodies. h 293 T cells were transfected with Flag-ERα plasmid, and then subjected to Bufalin for 48 h, followed by treatment with MG-132 (10 μM) for 10 hours before harvest. Then the cells lysates were subjected immunoprecipitation with anti-Flag antibodies and blotted with anti-Ub antibodies. i ERE-luciferase assay after Bufalin treatment, the data are presented as mean ± SD, n = 3 independent experiments. Two-way ANOVA was used for statistical analysis, P < 0.05 was considered to be statistically significant. j MCF-7 cells were treated with a series of concentrations of Bufalin for 48 h in the presence or absence of E2, the mRNA levels of AGR2, CCND1, GREB1, NRIP1, PGR, and SIAH2 were analyzed by real-time PCR, the data are presented as mean ± SD, n = 3 independent experiments. Two-way ANOVA was used for statistical analysis, P < 0.05 was considered to be statistically significant.
Fig. 4
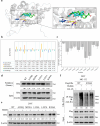
Fig. 4. Bufalin selectively binds to Arg394 (R394) of ERα.
a Bufalin was docked into the binding pocket of ESR1 using the Glide SP protocol. b The docked structure of the ESR1-Bufalin complex was then subjected to 100 ns of molecular dynamics simulations using Amber, followed by MM-GBSA energy calculations and residue energy decomposition. The top 10 residues from the MM-GBSA residue energy decomposition scoring. c The top 10 residues selected for alanine scanning mutagenesis. Error values were derived from energy snapshots based on 100 frames uniformly extracted from the last 100 ns of the MD simulation trajectory. d 293 T cell was transfected with ERα wild type (WT) plasmid or mutant plasmid, after transfected 48 h, the cell lysates were incubated with Biotin-Bufalin at 4 °C overnight, followed by pulling-down with streptavidin magnetic beads. The proteins bound to the magnetic beads were separated by SDS-PAGE, followed by western blot using ERα antibody. e 293 T cells were transfected with ERα WT or mutant plasmid, followed by treatment with Bufalin for 48 h. The ERα protein levels were measured by western blot. f 293 T cells were transfected with Flag-ERα WT or R394A mutant plasmid and HA-Ub plasmid, and then subjected to Bufalin for 48 h, followed by treatment with MG-132 (10 μM) for 10 hours before harvest. Then the cells lysates were subjected immunoprecipitation with anti-Flag antibodies and blotted with anti-HA antibodies.
Fig. 5
Fig. 5. Bufalin facilitates ERα degradation by enhancing interaction between ERα and the E3 ligase STUB1.
a The binding poses of ERα and STUB1 with or without Bufalin. The magenta structure represents the result of protein-protein docking, the green structure corresponds to the clustered conformation after a 200 ns MD simulation with Bufalin, and the blue structure represents the clustered conformation after a 200 ns MD simulation without Bufalin. Bufalin is shown as yellow sticks in the structural representation. b The conformational changes of the ERα-Bufalin-STUB1 complex at 200 ns. c RMSD plots of the ERα-STUB1 complex over 200 ns of MD simulation with or without Bufalin. d The binding surface area analysis between ERα and STUB1 with or without Bufalin. e RMSF (root-mean-square fluctuation) profiles of ERα and STUB1 with or without Bufalin. f Changes in the number of H-bonds throughout the simulation between ERα and STUB1 with or without Bufalin. g MCF-7 and T47D cell was transfected with nontargeting siRNA or STUB1-targeted siRNA, the expression of ERα and STUB1 were measured by western blot, the samples derive from the same experiment and that gels/blots were processed in parallel. h 293 T cells transfected with Flag-ERα and HA-STUB1 plasmid were treated by Bufalin, then lysed and lysates were subjected immunoprecipitation with anti-Flag antibodies. Proteins retained on sepharose were blotted with the indicated antibodies. The input samples derive from the same experiment, and that gels/blots were processed in parallel. i MCF-7 and T47D cells were transfected with nontargeting siRNA or STUB1-targeted siRNA followed by treatment with Bufalin for 48 h. The ERα and STUB1 protein levels were measured by Western blot.
Fig. 6
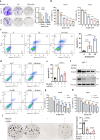
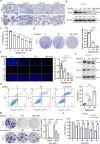
Fig. 6. Bufalin’s anti-cancer effects in ER+ cells are dependent on ERα.
a The colony formation assay was used to measure MCF-7 and T47D cell proliferation after treatment by Bufalin, the data are presented as mean ± SD, n = 3 independent experiments. One-way ANOVA was used for statistical analysis, P < 0.05 was considered to be statistically significant. b MCF-7 and T47D cells were treated with a series of concentrations of Bufalin, and cell viability was determined using the CCK-8 assay, the data are presented as mean ± SD, n = 3 independent experiments. One-way ANOVA was used for statistical analysis, P < 0.05 was considered to be statistically significant. c MCF-7 cells were treated with 20 or 50 nM Bufalin for 48 h, and the apoptosis was examined by measuring Annexin V staining, the data are presented as mean ± SD, n = 3 independent experiments. One-way ANOVA was used for statistical analysis, P < 0.05 was considered to be statistically significant. d, e MCF-7 cells were transfected with nontargeting siRNA or ESR1 siRNA followed by treatment with Bufalin for 48 h, and apoptosis was examined by measuring Annexin V staining, the data are presented as mean ± SD, n = 3 independent experiments. One-way ANOVA was used for statistical analysis, P < 0.05 was considered to be statistically significant. f MCF-7 cells were transfected with nontargeting siRNA or ESR1 siRNA followed by treatment with Bufalin for 48 h, and the ERα and PARP protein levels were measured by western blot, the samples derive from the same experiment and that gels/blots were processed in parallel. g T47D cells were transfected with nontargeting siRNA or ESR1 siRNA followed by treatment with Bufalin, and the cell viability was determined using the CCK-8 assay, the data are presented as mean ± SD, n = 3 independent experiments. Two-way ANOVA was used for statistical analysis, P < 0.05 was considered to be statistically significant. h 293 T cells were transfected with Flag-ERα plasmid followed by treatment with Bufalin, and the cell viability was determined using the CCK-8 assay, the data are presented as mean ± SD, n = 3 independent experiments. Two-way ANOVA was used for statistical analysis, P < 0.05 was considered statistically significant. i MCF-7 cells were transfected with nontargeting siRNA or ESR1 siRNA followed by treatment with Bufalin, and the colony formation assay was used to measure cell proliferation, the data are presented as mean ± SD, n = 3 independent experiments. One-way ANOVA was used for statistical analysis, P < 0.05 was considered to be statistically significant.
Fig. 7
Fig. 7. Bufalin overcomes Tamoxifen resistance in vitro.
a Representative IHC staining for ERα in Tamoxifen treatment relapsed simple (Scale bar 20μm). b Tamoxifen-resistant cells LCC2 were treated with a serious of Bufalin, the expression of ERα was measured by western blot. c Tamoxifen-resistant cells LCC2 were treated with Bufalin, and cell viability was determined using the CCK-8 assay, the data are presented as mean ± SD, n = 3 independent experiments. One-way ANOVA was used for statistical analysis, P < 0.05 was considered statistically significant. d The colony formation assay was used to measure LCC2 cell proliferation after treatment by Bufalin, the data are presented as mean ± SD, n = 3 independent experiments. One-way ANOVA was used for statistical analysis, P < 0.05 was considered to be statistically significant. e The EdU assay was used to measure LCC2 cell proliferation following treatment with Bufalin (Scale bar 100μm), the data are presented as mean ± SD, n = 3 independent experiments. One-way ANOVA was used for statistical analysis, P < 0.05 was considered statistically significant. f LCC2 cells were treated with 50 or 100 nM Bufalin for 48 h, and the expression of PARP and Bcl-2 was measured by western blot, the samples derive from the same experiment and that gels/blots were processed in parallel. g LCC2 cells were treated with 50 or 100 nM Bufalin for 48 h, and apoptosis was examined by measuring Annexin V staining, the data are presented as mean ± SD, n = 3 independent experiments. One-way ANOVA was used for statistical analysis, P < 0.05 was considered statistically significant. h The colony formation assay was used to measure LCC2 cell proliferation after treatment with Bufalin or Fulvestrant, the data are presented as mean ± SD, n = 3 independent experiments. One-way ANOVA was used for statistical analysis, P < 0.05 was considered statistically significant. i Tamoxifen-resistant cells LCC2 were treated with Bufalin and Fulvestrant, and cell viability was determined using the CCK-8 assay, the data are presented as mean ± SD, n = 3 independent experiments. Two-way ANOVA was used for statistical analysis, P < 0.05 was considered statistically significant.
Fig. 8
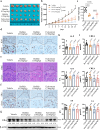
Fig. 8. Bufalin overcomes Tamoxifen resistance in vivo.
4-week-old female nude mice were inoculated with LCC2 cells. The tumor-bearing mice were subsequently given the indicated treatment (n = 7 mice per group). a Subcutaneous tumors were excised and photographed at the end of the experiment. b Tumor sizes were measured on the specified days, the data are presented as mean ± SD, n = 7 mice. One-way ANOVA was used for statistical analysis, P < 0.05 was considered to be statistically significant. c Tumor weights were measured at the end of the experiments, the data are presented as mean ± SD, n = 7 mice. One-way ANOVA was used for statistical analysis, P < 0.05 was considered to be statistically significant. d Representative IHC images for detecting Ki67 expression in the tumor specimens (Scale bar 20μm). e Representative histological analysis of tumor specimen stained by H&E (Scale bar 20μm). f Representative IHC images for detecting ERα expression in the tumor specimens (Scale bar 20μm). g Western blot analysis of the ERα protein expression in xenografts following the indicated treatment. h, i Mice liver and kidney functions were measured at the end of the experiments, the data are presented as mean ± SD, n = 7 mice. One-way ANOVA was used for statistical analysis, P < 0.05 was considered to be statistically significant (Vehicle vs. Buf (0.5 mg/kg), Vehicle vs. Buf (1.0 mg/kg), Vehicle vs. Ful (2.0 mg/kg)). Buf Bufalin, Ful Fulvestrant.
Fig. 9
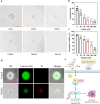
Fig. 9. Bufalin exerts significant anti-cancer activity in Tamoxifen-resistant patient-derived organoids.
a Representative images of Tamoxifen treatment relapsed patient-derived organoids after treatment by Bufalin (Scale bar 50 μm). Representative data are shown from n = 3 independent experiments with consistent results. b Statistics of tumor organoid size of formed organoids after Bufalin treatment, the data are presented as mean ± SD, n = 3 independent experiments. One-way ANOVA was used for statistical analysis, P < 0.05 was considered statistically significant. c The proliferation of Tamoxifen treatment relapsed patient-derived organoids treated with Bufalin, the data are presented as mean ± SD, n = 3 independent experiments. One-way ANOVA was used for statistical analysis, P < 0.05 was considered statistically significant. d The growth inhibition of Bufalin was demonstrated by Calcein-AM/PI fluorescence staining of PDO (Scale bar 50μm). BF: bright field. Representative data are shown from n = 3 independent experiments with consistent results. e Schematic of the proposed mechanism of Bufalin in ER-positive breast cancer. This study harnessed artificial intelligence combined with molecular docking to predict the molecular mechanism of Bufalin against tumor. Bufalin could bind to ERα and increase the interaction between ERα and the ubiquitin E3 ligase STUB1, leading to the degradation of ERα. Additionally, Bufalin could overcome Tamoxifen resistance in vitro and in vivo.

References

    1. Zhang, H. et al. Bufalin targeting CAMKK2 inhibits the occurrence and development of intrahepatic cholangiocarcinoma through Wnt/β-catenin signal pathway. J. Transl. Med.21, 900 (2023). - PMC - PubMed
    1. Yu, Z. et al. Bufalin stimulates antitumor immune response by driving tumor-infiltrating macrophage toward M1 phenotype in hepatocellular carcinoma. J. Immunother. Cancer10, e004297 (2022). - PMC - PubMed
    1. Farooqi, A. A. et al. Bufalin-mediated regulation of cell signaling pathways in different cancers: spotlight on JAK/STAT, Wnt/β-Catenin, mTOR, TRAIL/TRAIL-R, and non-coding RNAs. Molecules28, 2231 (2023). - PMC - PubMed
    1. Chen, J. et al. Bufalin targets the SRC-3/MIF pathway in chemoresistant cells to regulate M2 macrophage polarization in colorectal cancer. Cancer Lett.513, 63–74 (2021). - PubMed
    1. Soumoy, L., Ghanem, G. E., Saussez, S. & Journe, F. Bufalin for an innovative therapeutic approach against cancer. Pharm. Res.184, 106442 (2022). - PubMed

MeSH terms