. 2025 Aug 23;14(1):275.
doi: 10.1038/s41377-025-01941-8.

Time-deterministic cryo-optical microscopy

Affiliations

Time-deterministic cryo-optical microscopy

Kosuke Tsuji et al. Light Sci Appl. .

Abstract

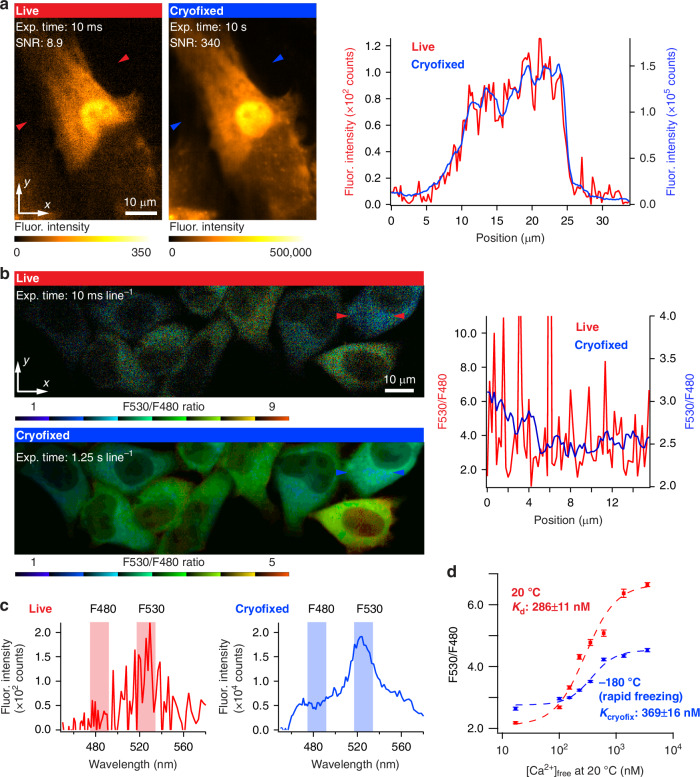
Fluorescence microscopy enables the visualization of cellular morphology, molecular distribution, ion distribution, and their dynamic behaviors during biological processes. Enhancing the signal-to-noise ratio (SNR) in fluorescence imaging improves the quantification accuracy and spatial resolution; however, achieving high SNR at fast image acquisition rates, which is often required to observe cellular dynamics, still remains a challenge. In this study, we developed a technique to rapidly freeze biological cells in milliseconds during optical microscopy observation. Compared to chemical fixation, rapid freezing provides rapid immobilization of samples while more effectively preserving the morphology and conditions of cells. This technique combines the advantages of both live-cell and cryofixation microscopy, i.e., temporal dynamics and high SNR snapshots of selected moments, and is demonstrated by fluorescence and Raman microscopy with high spatial resolution and quantification under low temperature conditions. Furthermore, we also demonstrated that intracellular calcium dynamics can be frozen rapidly and visualized using fluorescent ion indicators, suggesting that ion distribution and conformation of the probe molecules can be fixed both spatially and temporally. These results confirmed that our technique can time-deterministically suspend and visualize cellular dynamics while preserving molecular and ionic states, indicating the potential to provide detailed insights into sample dynamics with improved spatial resolution and temporal accuracy in observations.


Conflict of interest statement

Conflict of interest: K.F. and Y.K. are inventors on the patent related to this work (application number: PCT/JP2022/020045, applicant: The University of Osaka, publication date: 17 November 2022, publication number: WO 2022/239830 A1), and PCT national phase applications have been filed in the United States, Japan, Europe, and China. K.F., M.Y., Y.K., and K.T. have patent applications (application number: PCT/JP2023/038854, applicant: The University of Osaka). K.F. is a co-founder and the chief technology officer (CTO) of Millde Co., Ltd. The authors declare no additional conflict of interest.

Figures

Fig. 1
Fig. 1
On-stage freezing chamber, Cryofixation of cellular dynamics under microscopic observation, and cryogenic super-resolution imaging. a Cross-sectional schematics and photograph of on-stage freezing chamber. b Cryofixation of Ca2+ wave propagating in the neonatal rat cardiomyocytes (frame rate: 100 frames s-1, Video S1). Ca2+ wave motion stopped at the frame of 0 ms by cryofixation. The white arrow in the image indicated the region where Ca2+ wave motion stopped. Post-cryofixation, the image contrast was predominantly preserved, with only slight discernible differences. Although further investigations are needed to elucidate the details of the slight difference in the image contrast before and after cryofixation, this may be attributed to variations in optical property of Fluo-4 in the cytoplasm and cellular organelles, contamination of cellular autofluorescence, which is also enhanced under cryogenic conditions, and the difference of physiochemical properties between Fluo-4 and cellular molecules under cryogenic conditions. If contamination of cellular autofluorescence is the case, employing spectral unmixing techniques or a calcium indicator with longer excitation and emission wavelengths would mitigate this issue significantly. Note that, as described in the Materials and Methods, the fluorescence intensity of each image was normalized for visualization purpose based on the fluorescence intensity of the selected area in the observed cells. c Fluorescence intensity profiles of the line indicated with the red and blue arrows in (b). These profiles show that the leading edge of the Ca2+ wave moves from left to right in this plot and is then arrested by cryofixation. These intensity line profiles were normalized to allow for comparison of the time variation in graph shapes at each line location. d Ca2+ titration curve of Fluo-4 under 20 °C and −180 °C (rapid freezing). This data was measured using Fluo-4 in a Ca2+ calibration buffer (“Materials and Methods”). After freezing the dissociation of calcium indicator is unlikely to occur in freezing conditions, as it does in liquid environments, we referred to the values calculated from the fitting function of the post-freezing data as Kcryofix, instead of Kd to avoid confusion. It was confirmed that a Kd value similar to that in ref. was obtained at the room temperature, and the shape of the Ca2+ titration curve was preserved after cryofixation. This result supports the preservation of the image contrast of the Fluo-4 loaded neonatal rat cardiomyocytes after cryofixation, as demonstrated in (b). e Cryogenic dual-color super-resolution and conventional widefield fluorescence images of Ca2+ distribution and actin filaments in the neonatal rat cardiomyocytes. f Cryogenic 3D super-resolution fluorescence image of Ca2+ distribution in the neonatal rat cardiomyocyte (Video S2). 3D visualization was produced by using alpha rendering (Nikon, NIS-Elements). g Cryogenic conventional widefield fluorescence images of a HeLa cell expressing DsRed in mitochondria (frame rate: 1 frames s−1, Video S3). The mitochondria moved at 37 °C and were immobilized by cryofixation. Although the cell shape was slightly deformed by cryofixation, it was not significant as shown in the enlarged views in this figure
Fig. 2
Fig. 2
Time-deterministic cryofixation of Ca2+ dynamics. a Optical microscope setup equipped with a UV laser source for signal triggering and a precise cryogen injection control system (Materials and Methods). The timing of UV laser irradiation and cryogen injection was controlled by electrical trigger signals, which can be sent individually and synchronously or asynchronously to each device. The delay time between the trigger signal timing to cryogen injector and the cryogen injection timing onto samples was measured three times and plotted in red, green, and light blue, confirming the freezing time precision of ± 10 ms. 133 ms ± 10 ms delay was observed between triggering the cryogen injector and the moment when the cryogen reaches samples. By advancing the timing of the trigger signal for the cryogen injector relative to that for the UV laser light source, our system enables rapid freezing at any desired timing with the time precision of ± 10 ms under optical stimulation. b Schematics of the time course of Ca2+ signal triggering and cryofixation, and the time course of the change of fluorescence intensity of Fluo-4 at the line indicated by the red arrows in the frame of the X-Y image at −13,410 ms, and X-Y images at different times. Ca2+ propagation stopped at 120 ms after UV light irradiation by cryofixation (Video S4). c, d Cryofixation of the neonatal rat cardiomyocytes loaded with Fluo-4 during contraction and relaxation phases (Video S5). Liquid cryogen was provided onto the sample manually for C and D. The fluorescence images were acquired at a frame rate of 100 frames s−1 in all data
Fig. 3
Fig. 3
Image quantification ability is improved by ultra-rapid fixation and cryogenic imaging. a Fluorescence images of Fluo-4 loaded neonatal rat cardiomyocyte and fluorescence intensity line profiles of the lines indicated by the red and blue arrows in the fluorescence images. By increasing the exposure time by a factor of 1000, the SNR was improved from 8.9 to 340. The experimental data are the same as that shown in Fig. 1b. The fluorescence image of the cryofixed sample with the exposure equivalent to 10 s was generated by integrating 1000 fluorescence images with an exposure time of 10 ms under cryogenic conditions. b Ratiometric fluorescence images of HeLa cells expressing YC3.60 acquired with a slit-scanning hyperspectral fluorescence microscope before and after cryofixation. Here, we utilized MetaMorph software (Molecular Devices) to generate the ratiometric image using 8 shades of color in a look-up table shown at the bottom of the image. To facilitate the identification of cellular morphology, the intensities of each color in the image were adjusted to correspond with fluorescence intensities observed in the fluorescence image of Venus. Fluorescence ratio line profiles are also shown for the lines indicated by the red and blue arrows in the ratio images. The ratio values in the line profiles were calculated from the fluorescence intensity images of ECFP and Venus (Fig. S20). Similar to (a), the fluorescence image with the equivalent long exposure time under cryogenic conditions was generated by the integration of 125 fluorescence images with an exposure time of 10 ms line−1. c Representative fluorescence spectra of YC3.60 in the sample shown in (b). The increase of the exposure time allows us to improve SNR in the spectrum measurement. d Ca2+ titration curve of YC3.60 before and after cryofixation, which was measured by using YC3.60 dispersed in Ca2+ calibration buffer solution
Fig. 4
Fig. 4
Cryogenic spontaneous Raman and super-resolution fluorescence imaging of HeLa cells. The super-resolution fluorescence image of actin filaments was taken with 3D-SIM and shown in yellow color. Raman intensities at 750, 1680, and 2850 cm−1 are mapped, representing the distributions of cytochromes (green), protein (blue), and lipid (red), respectively

References

    1. Kneen, M. et al. Green fluorescent protein as a noninvasive intracellular pH indicator. Biophys. J.74, 1591–1599 (1998). - PMC - PubMed
    1. Lou, Z. R., Li, P. & Han, K. L. Redox-responsive fluorescent probes with different design strategies. Acc. Chem. Res.48, 1358–1368 (2015). - PubMed
    1. Vu, C. Q. et al. A highly-sensitive genetically encoded temperature indicator exploiting a temperature-responsive elastin-like polypeptide. Sci. Rep.11, 16519 (2021). - PMC - PubMed
    1. Morishita, Y. et al. Generation of myocyte agonal Ca2+ waves and contraction bands in perfused rat hearts following irreversible membrane permeabilisation. Sci. Rep.13, 803 (2023). - PMC - PubMed
    1. Almada, P. et al. Automating multimodal microscopy with NanoJ-Fluidics. Nat. Commun.10, 1223 (2019). - PMC - PubMed

LinkOut - more resources