. 2025 Aug 22;23(1):490.
doi: 10.1186/s12916-025-04324-3.

Basophil-derived exosomes exacerbate systemic lupus erythematosus by regulating B-cell proliferation via miR-24550

Affiliations

Basophil-derived exosomes exacerbate systemic lupus erythematosus by regulating B-cell proliferation via miR-24550

Jiaxuan Chen et al. BMC Med. .

Abstract

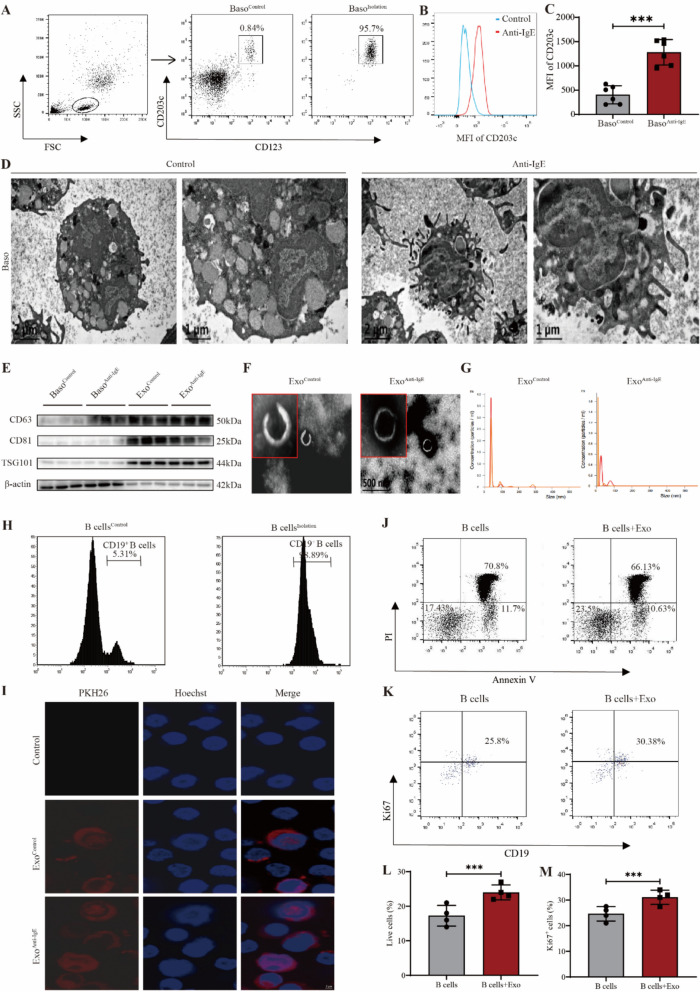
Background: Systemic lupus erythematosus (SLE) is a complex autoimmune disease where B-cell proliferation and activation play a pivotal role in pathogenesis. While the role of basophils in SLE is recognized, the impact of basophil-derived exosomes on B-cell proliferation and activation has not been thoroughly investigated.

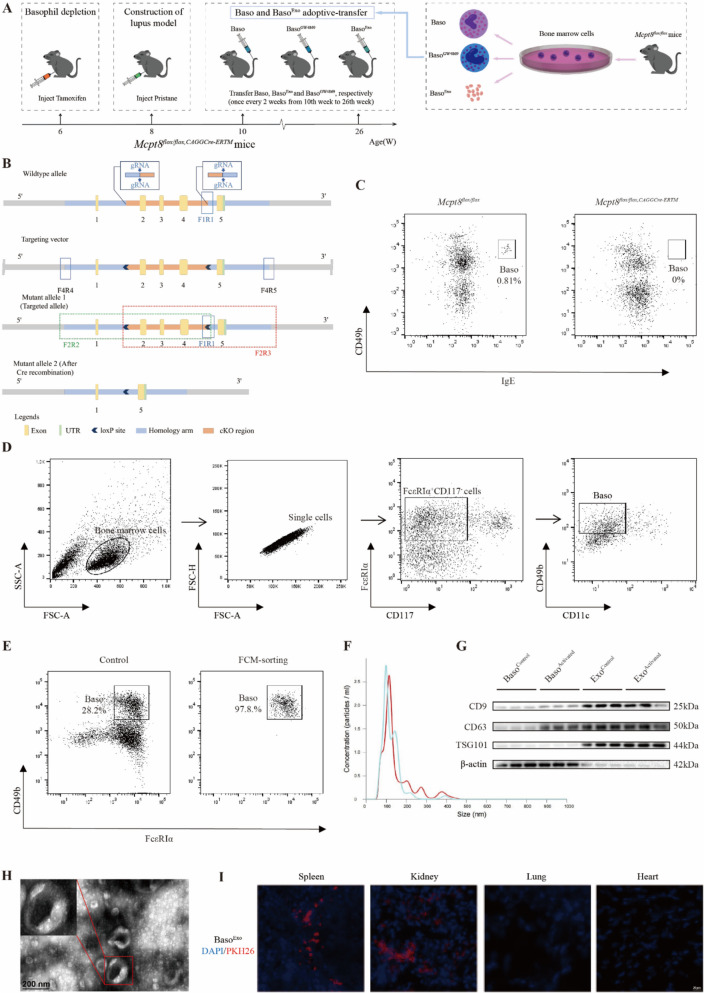
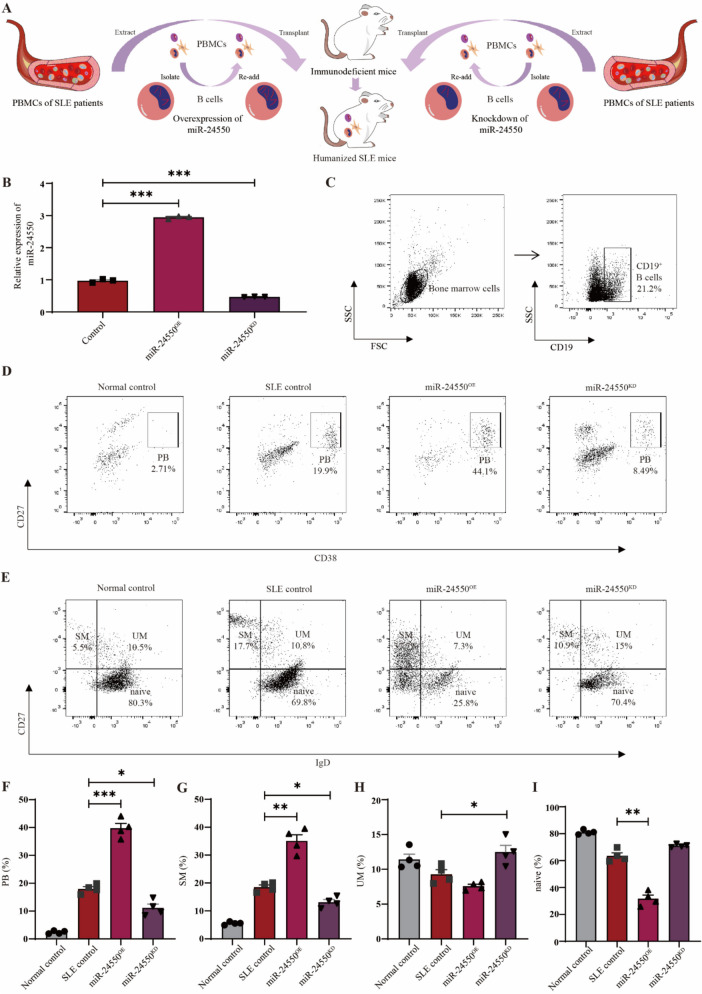
Methods: Exosomes from human basophils in both resting and activated states were isolated and characterized. These exosomes were then co-cultured with B cells to assess their effects on B-cell survival and proliferation. To investigate the in vivo roles, a Pristane-induced lupus model in Mcpt8flox/flox CAGGCre-ERTM mice was utilized. The Pristane-Mcpt8flox/flox, CAGGCre-ERTM mice were analyzed for basophil-derived exosome accumulation in the spleen and kidneys, and the effects on immune cell proliferation and plasma cell-plasmablast balance were assessed. Transcriptomic analysis was conducted on basophil-derived exosomes to identify key non-coding RNAs. Lupus mice were humanized by transplanting peripheral blood mononuclear cells (PBMCs) from patients with SLE into immunodeficient mice to evaluate the effects of intervening miR-24550 in B cells.

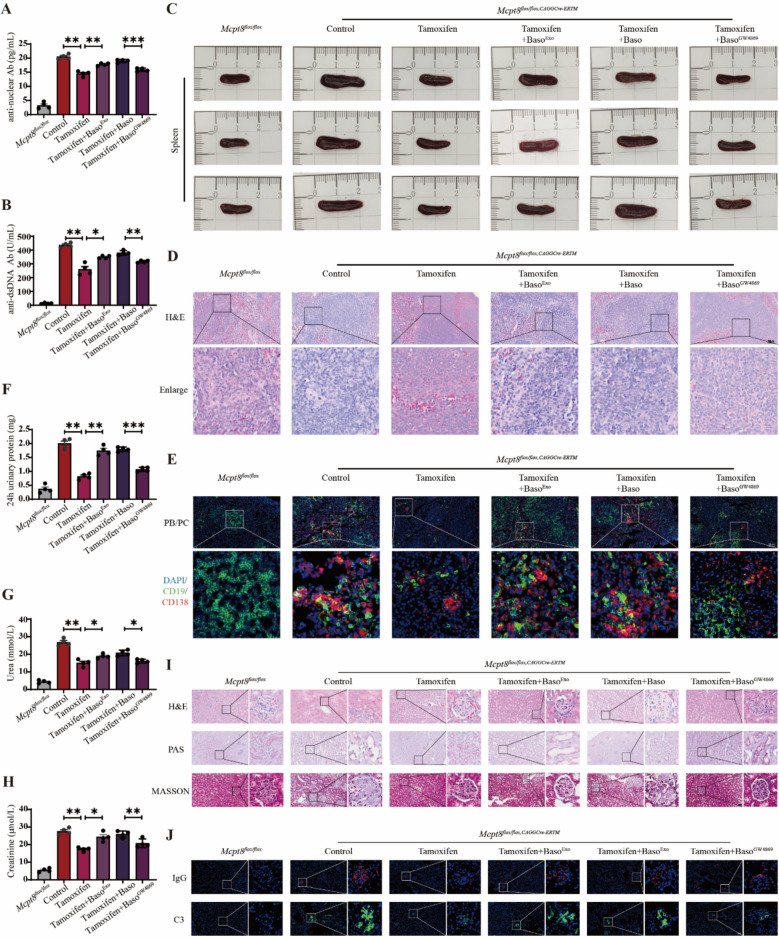
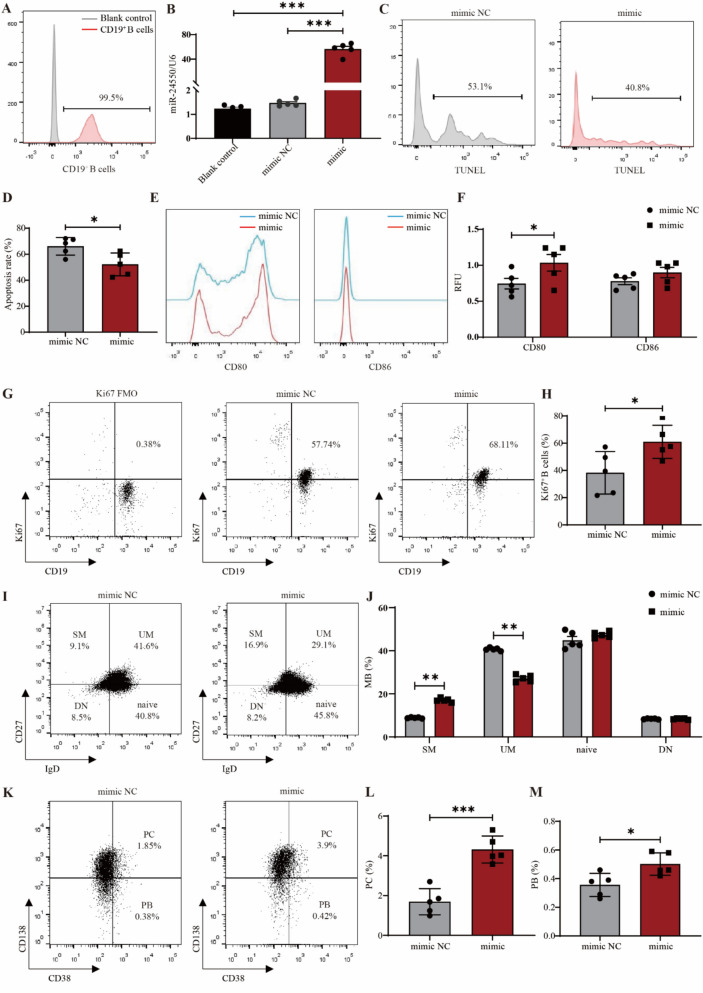
Results: Activated basophil-derived exosomes were found to enhance B-cell survival and proliferation in patients with SLE. In the lupus mouse model, basophil-derived exosomes accumulated primarily in the spleen and kidneys, inducing excessive immune cell proliferation and disrupting the plasma cell-plasmablast balance, which worsened kidney damage. Transcriptomic analysis revealed key non-coding RNAs within basophil-derived exosomes. Activated basophil-derived exosomes were internalized by B cells, releasing miR-24550, which promoted B-cell proliferation. In humanized SLE mice, inhibiting miR-24550 in B cells reduced immune hyperactivation and improved renal function, similar to the effects of inhibiting basophil-derived exosomes release in Pristane-Mcpt8flox/flox, CAGGCre-ERTM mice. Ultimately, basophil-derived exosomal miR-24550 promotes B-cell proliferation and activation by targeting Krüppel-like factor 5 (KLF5), which exacerbates SLE progression.

Conclusions: Basophil-derived exosomal miR-24550 promotes B-cell proliferation and activation by targeting KLF5, thereby exacerbating SLE progression. This study presents a novel strategy for SLE prevention and treatment.

Keywords: B cells; Basophils; Exosomes; Systemic lupus erythematosus; miR-24550.


Conflict of interest statement

Declarations. Ethics approval and consent to participate: Based on the modified SLE classification criteria formulated by the American College of Rheumatology in 1997, 48 patients with SLE were enrolled in this study at the Department of Nephrology between September 2020 and November 2024. This study was approved by the Affiliated Hospital of Guangdong Medical University’s ethics committee (Approval no. YJYS2020107). Written informed consent was obtained from all the patients. Mcpt8flox/flox, CAGGCre−ERTM, Mcpt8flox/flox, and NKG mice were obtained from Cyagen Biosciences (License No. SCXK (Yue) 2020–0055). The maintenance of these mice was approved by the Ethics Committee for Experimental Animals of the Affiliated Hospital of Guangdong Medical University (Approval no. GDY2002081). All experiments were conducted under the national animal welfare guidelines. Consent for publication: All authors read and approved the manuscript. Competing interests: The authors declare no competing interests.

Figures

Fig. 1
Fig. 1
Basophil-derived exosomes enhance the survival and proliferation of B cells in SLE patients. A Flow cytometric analysis of CD123+ CD203c+ basophil purity. B Flow cytometric analysis of CD203c expression in human basophils. C Statistical analysis of CD203c expression in human basophils (n = 6). D Transmission electron microscopy images of human basophil morphology. E Western blotting analysis of human basophils and their exosomes. F Transmission electron microscopy images of human basophil-derived exosome morphology. G Nanoparticle tracking analysis of basophil-derived exosome size. H Flow cytometric analysis of CD19+ B-cell purity. I Immunofluorescence analysis of basophil-derived exosomes and B-cell colocalization. J Flow cytometric analysis of B-cell survival. K Flow cytometric analysis of B-cell proliferation. L Statistical analysis of B-cell survival (n = 4). M Statistical analysis of B-cell proliferation. Results are shown as mean ± SEM (n = 4). C, L, and M were analyzed by independent-samples t-tests. *P < 0.05; **P < 0.01; ***P < 0.001
Fig. 2
Fig. 2
Basophil-derived exosomes migrate to spleen and kidneys in Pristane-Mcpt8flox/flox, CAGGCre−ERTM lupus mice. A Timeline of basophil and exosome transfer in Mcpt8flox/flox, CAGGCre−ERTM mice. B Schematic of Mcpt8flox/flox, CAGGCre−ERTM mouse construction. C Flow cytometric analysis of basophil proportion in peripheral blood of Mcpt8flox/flox, CAGGCre−ERTM mice. D Flow cytometric gating for sorting induced basophils from mouse bone marrow. E Flow cytometric analysis of mouse basophil purity after sorting. F Nanoparticle tracking analysis of basophil exosome size in mice. G Western blotting analysis of mouse basophils and their exosomes. H Transmission electron microscopy of mouse basophil exosome morphology. I Immunofluorescence analysis of distribution of basophil-derived exosomes in Pristane-Mcpt8flox/flox, CAGGCre−ERTM lupus mice
Fig. 3
Fig. 3
Basophil-derived exosomes exacerbate disease progression in Pristane-Mcpt8flox/flox, CAGGCre−ERTM lupus mice. A Statistical analysis of plasma antinuclear antibodies in mice (n = 4). B Statistical analysis of plasma anti-dsDNA antibodies in mice (n = 4). C Morphological analysis of mouse spleen. D Hematoxylin and eosin (H&E) staining analysis of mouse spleen pathology. E Immunofluorescence staining analysis of plasma cell and plasmablast proportions in mouse spleen. F Statistical analysis of 24-h urinary protein levels in mice (n = 4). G Statistical analysis of urea levels in mice (n = 4). H Statistical analysis of creatinine levels in mice (n = 4). I H&E, PAS, and MASSON staining analysis of mice kidney pathology (n = 4). J Immunofluorescence staining analysis of IgG and C3 deposition in mouse kidneys. Results are shown as mean ± SEM. A, B, F, G, and H were analyzed by one-way ANOVA. *P < 0.05; **P < 0.01; ***P < 0.001
Fig. 4
Fig. 4
MiR-24550 in basophil-derived exosomes is crucial for their function. A miRNA differential expression heatmap (red indicates upregulation; green indicates downregulation; higher expression is indicated by brighter colors). B miRNA differential expression volcano plot (horizontal axis: fold change; vertical axis: P-value). C Relative expression levels of miRNAs in basophil-derived exosomes before and after activation (n = 3). D Relative expression levels of miRNAs in exosomes derived from activated basophils. E Flow cytometric gating scheme for detecting CD19+ B cells. F Flow cytometric analysis of CD19+ B cell purity before and after negative selection. G miRNA expression levels in B cells from healthy volunteers and patients with SLE (n = 3). H Changes in miR-24550 expression levels after basophil activation (n = 3). I Relative expression levels of miR-24550 in B cells after co-culturing of activated basophil-derived exosomes with B cells from patients with SLE (n = 3). Results are shown as mean ± SEM. C and G were analyzed by independent-samples t-tests. I was analyzed by paired t-tests. *P < 0.05; **P < 0.01; ***P < 0.001
Fig. 5
Fig. 5
MiR-24550 promotes B-cell differentiation and activation. A Flow cytometric analysis of CD19+ B cell purity before and after negative selection. B qPCR analysis of miR-24550 overexpression efficiency in B cells (n = 5). C TUNEL assay to detect the effect of miR-24550 overexpression on B-cell apoptosis. D Statistical analysis of the effect of miR-24550 overexpression on B-cell apoptosis (n = 5). E Flow cytometric analysis of the effect of miR-24550 overexpression on the expression of the B-cell activation markers CD80 and CD86. (F) Statistical analysis of the effect of miR-24550 overexpression on the expression of the B-cell activation markers CD80 and CD86 (n = 5). G Flow cytometric analysis of the effect of miR-24550 overexpression on the expression of the B-cell proliferation marker Ki-67. H Statistical analysis of the effect of miR-24550 overexpression on the expression of the B cell proliferation marker Ki-67 (n = 5). I Flow cytometric analysis of the effect of miR-24550 overexpression on memory B-cell subsets. J Statistical analysis of the effect of miR-24550 overexpression on memory B-cell subsets (n = 5). K Flow cytometric analysis of the effect of miR-24550 overexpression on plasma cells and plasmablasts. L Statistical analysis of the effect of miR-24550 overexpression on plasma cells (n = 5). M Statistical analysis of the effect of miR-24550 overexpression on plasmablasts (n = 5). Results are shown as mean ± SEM. B was analyzed by one-way ANOVA. D, F, H, J, L, and M were analyzed by independent-samples t-tests. *P < 0.05; **P < 0.01; ***P < 0.001
Fig. 6
Fig. 6
Construction of humanized SLE mouse models. A Procedure for construction of humanized SLE mouse models. B qRT-PCR analysis of miR-24550 overexpression and knockdown efficiency in B cells from patients with SLE (n = 3). C Flow cytometric analysis of CD19+ B cells from the bone marrow of humanized SLE mice. D Flow cytometric analysis of plasmablasts (PB) from the bone marrow of humanized SLE mice. E Flow cytometric analysis of memory B cells from the bone marrow of humanized SLE mice. F Statistical analysis of PB proportion in bone marrow of humanized SLE mice (n = 4). G Statistical analysis of switched memory (SM) B-cell proportion in bone marrow of humanized SLE mice (n = 4). H Statistical analysis of unswitched memory (UM) B-cell proportion in bone marrow of humanized SLE mice (n = 4). I Statistical analysis of naïve B cell proportion in bone marrow of humanized SLE mice (n = 4). Results are shown as mean ± SEM. B, F, G, H, and I were analyzed by one-way ANOVA. *P < 0.05; **P < 0.01; ***P < 0.001
Fig. 7
Fig. 7
B-cell miR-24550 knockdown ameliorates disease progression in humanized SLE mice. A Statistical analysis of plasma antinuclear antibodies in humanized SLE mice (n = 4). B Statistical analysis of plasma anti-dsDNA antibodies in humanized SLE mice (n = 4). C Statistical analysis of plasma IFN-γ in humanized SLE mice (n = 4). D Statistical analysis of plasma IL-17 in humanized SLE mice (n = 4). E Statistical analysis of plasma TNF-α in humanized SLE mice (n = 4). F Statistical analysis of plasma IL-4 in humanized SLE mice (n = 4). G) Statistical analysis of plasma IL-12P70 in humanized SLE mice (n = 4). H Statistical analysis of plasma IL-10 in humanized SLE mice (n = 4). I Morphological analysis of spleen morphology in humanized SLE mice. J Statistical analysis of spleen weight–body weight ratio in humanized SLE mice (n = 4). K H&E staining analysis of spleen pathology in humanized SLE mice. L Immunofluorescence staining analysis of plasma cells (PC) in the spleen of humanized SLE mice. M Statistical analysis of 24-h urinary protein levels in humanized SLE mice (n = 4). N Statistical analysis of plasma urea level in humanized SLE mice (n = 4). O Statistical analysis of plasma creatinine level in humanized SLE mice (n = 4). P H&E, PAS, and MASSON staining analysis of kidney pathology in humanized SLE mice. Q Immunofluorescence staining analysis of IgG and C3 deposition in the kidneys of humanized SLE mice. Results are shown as mean ± SEM. A, B, C, D, E, F, G, H, J, M, N, and O were analyzed by one-way ANOVA. *P < 0.05; **P < 0.01
Fig. 8
Fig. 8
MiR-24550 promotes B cell activation by inhibiting KLF5 expression. A Bioinformatic prediction of miR-24550 targeting KLF5. B qRT-PCR analysis of miR-24550 levels in B cells in healthy volunteers and patients with SLE (n = 3). C qRT-PCR analysis of KLF5 levels in B cells from healthy volunteers and patients with SLE (n = 3). D qRT-PCR analysis of KLF5 levels following miR-24550 overexpression in B cells (n = 5). E qRT-PCR analysis of KLF5 levels following miR-24550 knockdown in B cells (n = 5). F qRT-PCR analysis of KLF5 levels after modulation of B-cell miR-24550 level (n = 3). G Flow cytometric analysis of CD80 levels post-KLF5 knockdown in B cells. H Statistical analysis of CD80 levels post-KLF5 knockdown (n = 5). I Flow cytometric analysis of CD86 levels post-KLF5 knockdown in B cells. J Statistical analysis of CD86 levels post-KLF5 knockdown (n = 5). K Statistical analysis of IgG secretion following KLF5 modulation in B cells (n = 5). L Correlation between miR-24550 and KLF5 expression. M Correlation among miR-24550, KLF5, CD80, CD86, and IgG expression levels (n = 15). N Dual-luciferase reporter plasmid design for miR-24550 targeting KLF5. O Dual-luciferase reporter gene analysis of miR-24550 for targeting KLF5 (n = 3). Results are shown as mean ± SEM. B, C, D, E, and O were analyzed by independent-samples t-tests. F, H, J, and K were analyzed by one-way ANOVA. L was analyzed by Spearman correlation analyses. *P < 0.05; **P < 0.01; ***P < 0.001

References

    1. Helmink BA, Reddy SM, Gao J, Zhang S, Basar R, Thakur R, Yizhak K, Sade-Feldman M, Blando J, Han G, et al. B cells and tertiary lymphoid structures promote immunotherapy response. Nature. 2020;577(7791):549–55. - PMC - PubMed
    1. Müller F, Taubmann J, Bucci L, Wilhelm A, Bergmann C, Völkl S, Aigner M, Rothe T, Minopoulou I, Tur C, et al. CD19 CAR t-cell therapy in autoimmune disease-a case series with follow-up. N Engl J Med. 2024;390(8):687–700. - PubMed
    1. Parikh SV, Rovin BH. Current and emerging therapies for lupus nephritis. J Am Soc Nephrol. 2016;27(10):2929–39. - PMC - PubMed
    1. Finkelman FD, Khodoun MV, Strait R. Human IgE-independent systemic anaphylaxis. J Allergy Clin Immunol. 2016;137(6):1674–80. - PMC - PubMed
    1. Iype J, Odermatt A, Bachmann S, Coeudevez M, Fux M. IL-1β promotes immunoregulatory responses in human blood basophils. Allergy. 2021;76(7):2017–29. - PubMed

LinkOut - more resources